https://github.com/caesar0301/movr
Human mobility data (in form of <x,y,t>) analysis and visualization in R.
https://github.com/caesar0301/movr
human-mobility movr spatio-temporal-data statistical-models visualization
Last synced: over 1 year ago
JSON representation
Human mobility data (in form of <x,y,t>) analysis and visualization in R.
- Host: GitHub
- URL: https://github.com/caesar0301/movr
- Owner: caesar0301
- License: other
- Created: 2015-01-07T09:35:04.000Z (over 11 years ago)
- Default Branch: master
- Last Pushed: 2022-06-15T12:20:32.000Z (about 4 years ago)
- Last Synced: 2025-04-14T02:06:57.895Z (over 1 year ago)
- Topics: human-mobility, movr, spatio-temporal-data, statistical-models, visualization
- Language: R
- Homepage:
- Size: 1.84 MB
- Stars: 13
- Watchers: 2
- Forks: 4
- Open Issues: 0
-
Metadata Files:
- Readme: README.md
- License: LICENSE
- Codeowners: CODEOWNERS
Awesome Lists containing this project
README
# movr
For human mobility data analysis and visualization in R.
[Behavior informatics](https://en.wikipedia.org/wiki/Behavior_informatics) studies intrinsic laws of human or animals in nature. Insight on individual or group mobility dynamics facilitates developing enhanced simulation and prediction models in application fields like wireless communication networks, animal migration, epidemic prediction and so on. In common scenarios, individual mobility is described by three-element tuples, i.e. , in which location is represented by symbolic character name or geo-coordinates. `movr` originates from my research on human mobility and provides some general transformation, calculation and visualization tools. May this small library facilitates others job in the area.
## Install
See detailed prerequisites and installation in [INSTALL.md](https://github.com/caesar0301/movr/blob/master/INSTALL.md).
A quick start with `devtools::install_github("caesar0301/movr")` in R console.
## Usage
### Visualization
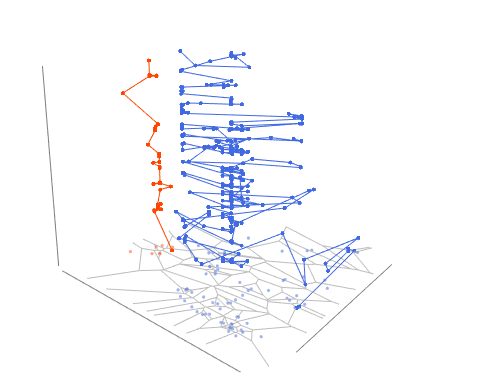
`movr` provides a suit of useful utilities to analyze human spatio-temporal mobility data.
* `plot_traj3d` (`voronoi3d`)
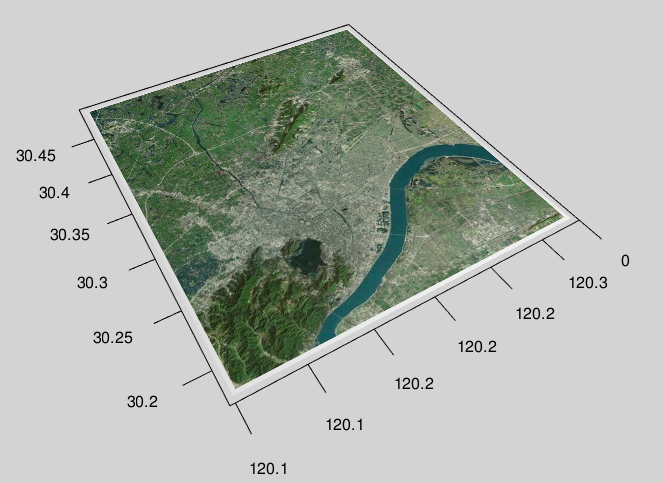
* `plot_flowmap` (using mobile data from Senegal, [D4D challenge 2014](http://www.d4d.orange.com/en/Accueil))

* `map3d` (3d map layer for `rgl` package)
## Related work
Some application of `movr` can be found in the Meta-Structure paper:
```
@article{CHEN2017464,
author = {Xiaming Chen and Haiyang Wang and Siwei Qiang and Yongkun Wang and Yaohui Jin},
doi = {https://doi.org/10.1016/j.pmcj.2017.02.001},
issn = {1574-1192},
journal = {Pervasive and Mobile Computing},
title = {Discovering and modeling meta-structures in human behavior from city-scale cellular data},
url = {https://www.sciencedirect.com/science/article/pii/S1574119217300743},
volume = {40},
year = {2017}}
```
## Bug Report
* https://github.com/caesar0301/movr/issues
* Or contact chenxm35@gmail.com