https://github.com/catamphetamine/chartogram
Charts in JS with no dependencies
https://github.com/catamphetamine/chartogram
Last synced: 3 months ago
JSON representation
Charts in JS with no dependencies
- Host: GitHub
- URL: https://github.com/catamphetamine/chartogram
- Owner: catamphetamine
- License: mit
- Created: 2019-03-27T10:16:03.000Z (about 6 years ago)
- Default Branch: master
- Last Pushed: 2019-04-07T17:39:39.000Z (about 6 years ago)
- Last Synced: 2025-02-11T14:57:59.329Z (4 months ago)
- Language: JavaScript
- Homepage: https://catamphetamine.github.io/chartogram/
- Size: 1.19 MB
- Stars: 1
- Watchers: 3
- Forks: 0
- Open Issues: 0
-
Metadata Files:
- Readme: README.md
- License: LICENSE
Awesome Lists containing this project
README
# chartogram
Charts in JS with no dependencies.
Also includes a [React](#react) component for those who're using React.
[DEMO](https://catamphetamine.github.io/chartogram)
Originally created as part of [Telegram Charts Contest](https://t.me/contest/6).
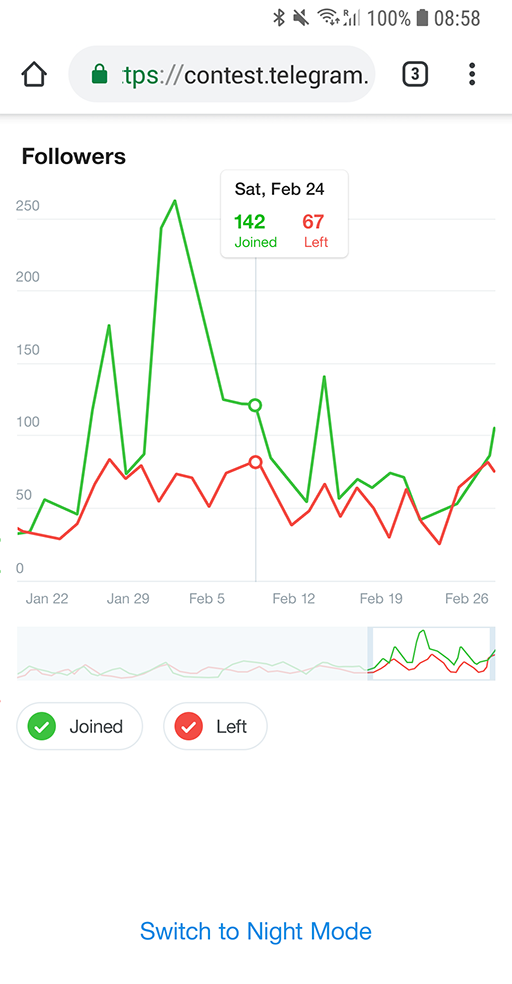
## Screenshots
### Day
[View in full resolution](https://raw.githubusercontent.com/catamphetamine/chartogram/master/docs/day.png)
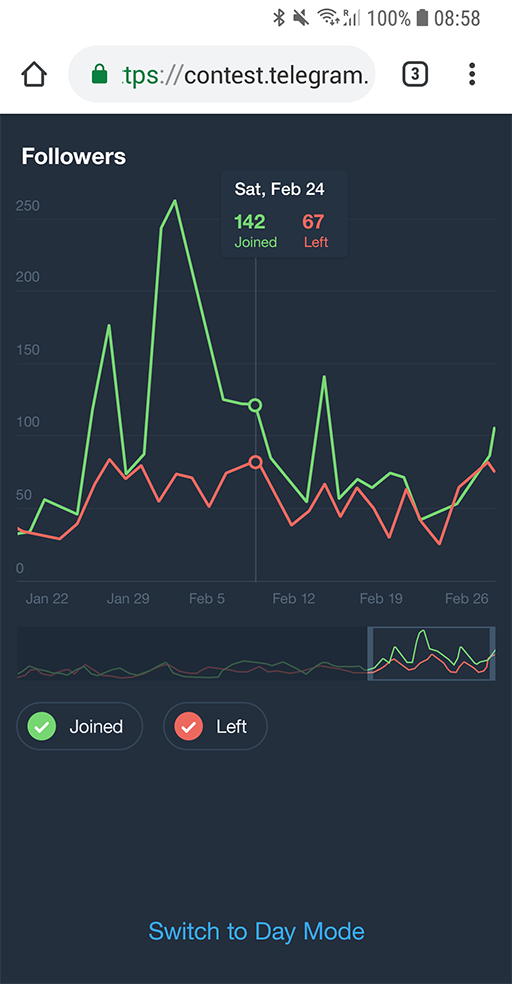
### Night
[View in full resolution](https://raw.githubusercontent.com/catamphetamine/chartogram/master/docs/night.png)
## Use
The default exported function takes four arguments:
* The DOM element where the chart will be rendered.
* Chart data.
* Chart title.
* (optional) [`options`](#options).
Chart data must have shape:
```js
{
x: {
points: Number[]
},
y: {
id: string,
name: string,
color: string,
points: Number[]
}[]
}
```
So there must be a single `x` and one or more `y`s.
Example:
```js
{
x: {
points: [
1553769000,
1553770000,
1553771000
]
},
y: [
{
id: 'y1',
name: 'Temperature',
color: '#cc0000',
points: [
60,
69,
65
]
},
{
id: 'y2',
name: 'CPU load',
color: '#00aa00',
points: [
95,
98,
90
]
}
]
}
```
The default exported function returns another function which must be called in case of "destroying" the chart (it cleans up global event listeners and resets the DOM node).
### Browser
```html
chartogram(document.getElementById('chart'), data, 'Title')
```
where `[version]` is an npm package version range (for example, `0.1.x` or `^0.1.0`).
### Bundler
```
npm install chartogram --save
```
```js
import chartogram from 'chartogram'
import 'chartogram/style.css'
chartogram(element, data, title)
```
### React (bundler)
```
npm install chartogram --save
```
```js
import React from 'react'
import Chartogram from 'chartogram/react'
import 'chartogram/style.css'
export default class Page extends React.Component {
render() {
return (
)
}
}
```
### React (browser)
```html
class Page extends React.Component {
render() {
return (
<Chartogram
data={data}
title="Followers"
options={options}/>
)
}
}
ReactDOM.render(
<Page/>,
document.getElementById("page")
)
```
where `[version]` is an npm package version range (for example, `0.1.x` or `^0.1.0`).
## Night mode
Add `chartogram--night-mode` CSS class to the chart `` to switch to Night Mode.
## Options
* `formatX(value: number, { long: boolean })` — Formats X axis labels. `long` option is for the tooltip. Uses `Intl.DateTimeFormat` by default.
* `formatY(value: number)` — Formats Y axis labels (including tooltip). Uses `Intl.NumberFormat` by default.
* `locale: string` — Is used to format dates (the default system locale is used if none supplied).
* `transitionDuration: number` — The maximum transition duration (in milliseconds).
* `transitionEasing: string` — Is `easeOutQuad` by default.
* `yAxisTickMarksCount: number` — Y axis tick marks count.
* `yAxisPrecision: number` — Y axis tick mark labels rounding precision: the number of fraction digits to use when formatting Y axis labels. Is `0` by default.
* `xAxisTickMarkWidth: number` — (in pixels) Is used to calculate the count of X axis tick marks based on canvas width (in pixels).
* `canvasWidth: number` — SVG `viewBox` width (not pixels).
* `precision: number` — SVG coordinates rounding precision.
* `timelineWindowSize: number` — The initial size of timeline window (in points).
## Custom colors
To customize colors override the CSS variables:
```css
body {
--content-color: black;
--background-color: white;
--night-mode-transition-duration: 300ms;
}
.night-mode {
--background-color: rgb(36,47,62);
--content-color: white;
}
.chartogram {
--chartogram-background-color: var(--background-color);
--chartogram-content-color: var(--content-color);
--chartogram-night-mode-transition-duration: var(--night-mode-transition-duration);
/* See `style.css` for the list of all available CSS variables. */
--chartogram-font-size: 16px;
--chartogram-tooltip-background-color: white;
}
.chartogram--night-mode {
/* See `style.css` for the list of all available CSS variables. */
--chartogram-tooltip-background-color: #293544;
}
```
## Browser compatibility
Tested in Chrome, Firefox, Microsoft Edge, Internet Explorer 11 and iOS Safari.
The styles use [CSS variables](https://caniuse.com/#feat=css-variables) which are supported in all browsers except Internet Explorer that would require using something like [PostCSS](https://postcss.org/) with a plugin like [`postcss-custom-properties`](https://github.com/postcss/postcss-custom-properties) or [`postcss-css-variables`](https://github.com/MadLittleMods/postcss-css-variables).
Internet Explorer would also require the following polyfills:
* [`Array.find`](https://babeljs.io/docs/en/babel-polyfill)
* [`Array.findIndex`](https://babeljs.io/docs/en/babel-polyfill)
* [`Math.log10`](https://babeljs.io/docs/en/babel-polyfill)
* [`classList`](https://github.com/eligrey/classList.js/)