https://github.com/cc-skuehn/Demo_Dashboard
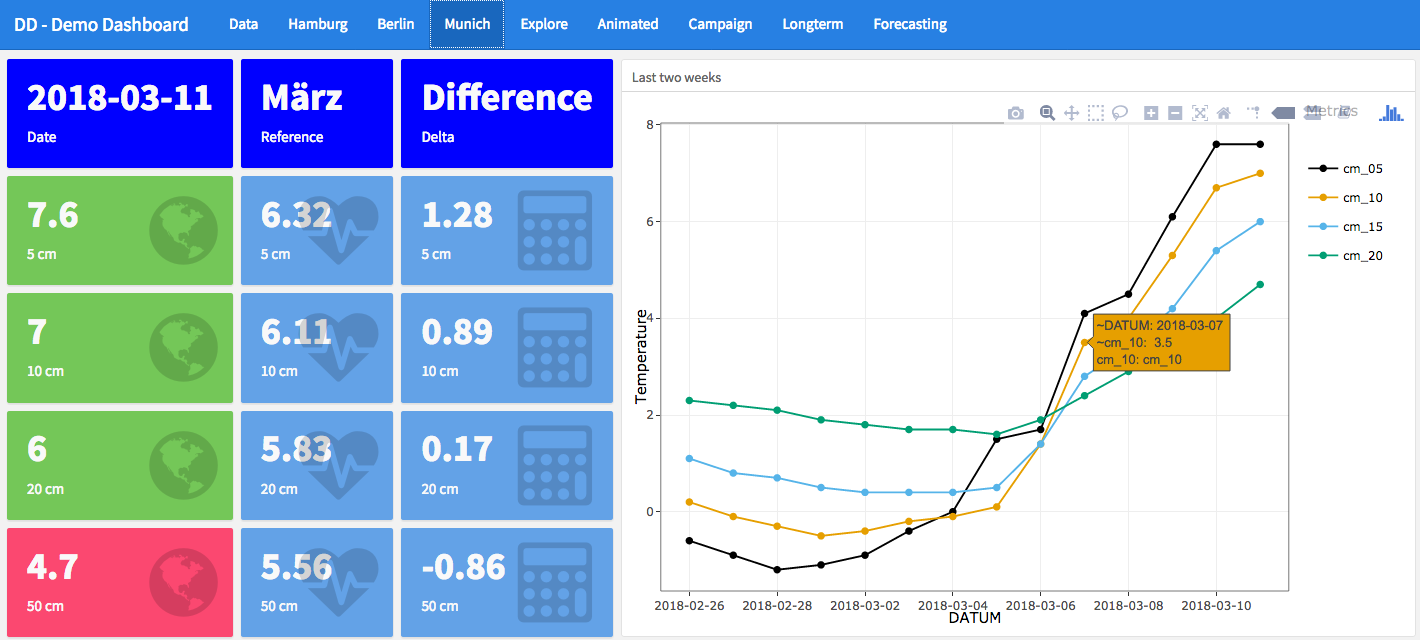
Interactive Dashboard in R using flexdashboard, shiny and plotly
https://github.com/cc-skuehn/Demo_Dashboard
dashboard flexdashboard plotly r shiny
Last synced: 4 months ago
JSON representation
Interactive Dashboard in R using flexdashboard, shiny and plotly
- Host: GitHub
- URL: https://github.com/cc-skuehn/Demo_Dashboard
- Owner: cc-skuehn
- Created: 2018-05-24T08:05:13.000Z (over 7 years ago)
- Default Branch: master
- Last Pushed: 2019-11-20T15:00:05.000Z (about 6 years ago)
- Last Synced: 2024-12-04T09:39:11.468Z (about 1 year ago)
- Topics: dashboard, flexdashboard, plotly, r, shiny
- Language: R
- Homepage:
- Size: 212 KB
- Stars: 9
- Watchers: 2
- Forks: 4
- Open Issues: 0
-
Metadata Files:
- Readme: README.md
Awesome Lists containing this project
- jimsghstars - cc-skuehn/Demo_Dashboard - Interactive Dashboard in R using flexdashboard, shiny and plotly (R)
README
# Demo_Dashboard
This is an interactive Demo Dashboard in R using flexdashboard, shiny, plotly and ggplot.
## Usage
The Dashboard comes as a set of .Rmd or RMarkdown files plus some standard R scripts. In order to run it you need to have downloaded certain packages and most probably it is a good idea to have RStudio and R version 3.4.x installed
### Packages
* markdown
* knitr
* flexdashboard
* ggplot2
* plotly
* shiny
* CausalImpact
* prophet
Some of these packages will have additional requirements, i.e. install additional packages.
### Starting the Dashboard
After installing the packages and once you have downloaded the source files from this repository (or cloned/forked the repository, whatever you prefer, but don't forget the Data folders), open the file "Demo_Dashboard.Rmd" with RStudio and click on "Run Document".
In case this does not work out of the box, try changing the working directory to the file's directory first: Session -> Set Working Directory -> To Source File Location
### Data
The raw data was downloaded on 2018-05-16 from the Climate Data Center (CDC, provided by Deutscher Wetterdienst (DWD))
https://www.dwd.de/EN/ourservices/cdcftp/cdcftp.html
### Author / Contact / Questions
Visit me on LinkedIn or XING
https://de.linkedin.com/in/stefan-k%C3%BChn-020a34119
https://www.xing.com/profile/Stefan_Kuehn46