https://github.com/ceems-dev/ceems
A Prometheus exporter and a REST API server to export metrics of compute units of resource managers like SLURM, Openstack, k8s, _etc_
https://github.com/ceems-dev/ceems
cloud containers dashboards ebpf emissions energy-monitor grafana green-computing hpc json-api kubernetes metrics-server metrics-visualization monitoring observability openstack performance-monitoring prometheus prometheus-exporter slurm
Last synced: 3 months ago
JSON representation
A Prometheus exporter and a REST API server to export metrics of compute units of resource managers like SLURM, Openstack, k8s, _etc_
- Host: GitHub
- URL: https://github.com/ceems-dev/ceems
- Owner: ceems-dev
- License: gpl-3.0
- Created: 2023-11-15T10:40:30.000Z (over 2 years ago)
- Default Branch: main
- Last Pushed: 2026-02-16T15:02:31.000Z (5 months ago)
- Last Synced: 2026-02-21T07:31:19.938Z (5 months ago)
- Topics: cloud, containers, dashboards, ebpf, emissions, energy-monitor, grafana, green-computing, hpc, json-api, kubernetes, metrics-server, metrics-visualization, monitoring, observability, openstack, performance-monitoring, prometheus, prometheus-exporter, slurm
- Language: C
- Homepage: https://ceems-dev.github.io/ceems/
- Size: 11.8 MB
- Stars: 63
- Watchers: 5
- Forks: 7
- Open Issues: 5
-
Metadata Files:
- Readme: README.md
- Changelog: CHANGELOG.md
- Contributing: CONTRIBUTING.md
- License: LICENSE
- Security: SECURITY.md
Awesome Lists containing this project
README
# Compute Energy & Emissions Monitoring Stack (CEEMS)
| | |
| ------- | --------------------------------------------------------------------------------------------------------------------------------------------------------------------------------------------------------------------------------------------------------------------------------------------------------------------------------------------------------------------------------------------------------------- |
| CI/CD | [](https://github.com/ceems-dev/ceems/actions/workflows/ci.yml?query=branch%3Amain) [](https://dl.circleci.com/status-badge/redirect/circleci/UVxmfk5AT3EHZpsg3FdfaR/PKvLaAH1ahBZf8kBKHhCiA/tree/main) [](https://github.com/ceems-dev/ceems/actions/workflows/ci.yml?query=branch%3Amain) |
| Docs | [](https://ceems-dev.github.io/ceems/) [](http://godoc.org/github.com/ceems-dev/ceems) [](https://discord.gg/bedRvX5uVY) |
| Package | [](https://github.com/ceems-dev/ceems/releases/latest) [](https://github.com/ceems-dev/ceems/releases) |
| Meta | [](https://github.com/ceems-dev/ceems) [](https://goreportcard.com/report/github.com/ceems-dev/ceems) [](https://pkg.go.dev/cmd/gofmt) |

Compute Energy & Emissions Monitoring Stack (CEEMS) (pronounced as *kiːms*) contains
a Prometheus exporter to export metrics of compute instance units and a REST API
server that serves the metadata and aggregated metrics of each
compute unit. Optionally, it includes a TSDB load balancer that supports basic access
control on TSDB so that one user cannot access metrics of another user.
"Compute Unit" in the current context has a wider scope. It can be a batch job in HPC,
a VM in cloud, a pod in k8s, *etc*. The main objective of the repository is to quantify
the energy consumed and estimate emissions by each "compute unit". The repository itself
does not provide any frontend apps to show dashboards and it is meant to use along
with Grafana and Prometheus to show statistics to users.
Although CEEMS was born out of a need to monitor energy and carbon footprint of compute
workloads, it supports monitoring performance metrics as well. In addition, it leverages
[eBPF](https://ebpf.io/what-is-ebpf/) framework to monitor IO and network metrics
in a resource manager agnostic way. It also supports eBPF based zero instrumentation
continuous profiling of compute units.
## 🎯 Features
- Monitors energy, performance, IO and network metrics for different types of resource
managers (SLURM, Openstack, k8s)
- Supports different energy sources like RAPL, HWMON, Cray's PM Counters and BMC _via_ IPMI or Redfish
- Supports NVIDIA (MIG, time sharing, MPS and vGPU) and AMD GPUs ([Partition](https://rocm.blogs.amd.com/software-tools-optimization/compute-memory-modes/README.html) like CPX, QPX, TPX, DPX)
- Supports zero instrumentation eBPF based continuous profiling using
[Grafana Pyroscope](https://grafana.com/oss/pyroscope/) as backend
- Realtime access to metrics *via* Grafana dashboards or a simple CLI tool
- Multi-tenancy and access control to Prometheus and Pyroscope datasources in Grafana
- Stores aggregated metrics in a separate DB that can be retained for long time
- CEEMS apps are [capability aware](https://tbhaxor.com/understanding-linux-capabilities/)
## ⚙️ Install CEEMS
> [!WARNING]
> DO NOT USE pre-release versions as the API has changed quite a lot between the
pre-release and stable versions.
Installation instructions of CEEMS components can be found in
[docs](https://ceems-dev.github.io/ceems/docs/category/installation).
## 📽️ Demo
Openstack and SLURM have been deployed on a small cloud instance and monitored using
CEEMS. As neither RAPL nor IPMI readings are available on cloud instances, energy
consumption is estimated by assuming a Thermal Design Power (TDP) value and current
usage of the instance. Several dashboards have been created in Grafana for visualizing
metrics which are listed below.
- [Overall usage of cluster](https://ceems-demo.myaddr.tools/d/adrenju36n2tcb/cluster-status?orgId=1&from=now-24h&to=now&var-job=openstack&var-host=$__all&var-provider=rte&var-country_code=FR&refresh=15m)
- [Usage of different Projects/Accounts by SLURM and Openstack](https://ceems-demo.myaddr.tools/d/cdreu45pp9erkd/user-and-project-stats?orgId=1&from=now-90d&to=now&refresh=15m)
- [Usage of Openstack resources by a given user and project](https://ceems-demo.myaddr.tools/d/be5x3it7gpx4wf/openstack-instance-summary?orgId=1&from=now-90d&to=now&var-user=gazoo&var-account=cornerstone&refresh=15m)
- [Usage of SLURM resources by a given user and project](https://ceems-demo.myaddr.tools/d/fdsm8aom8hqf4fewfwe3123dascdsc/slurm-job-summary?orgId=1&from=now-90d&to=now&var-user=wilma&var-account=bedrock&refresh=15m)
> [!WARNING]
> All the dashboards provided in the demo instance are only meant to be for demonstrative
purposes. They should not be used in production without properly protecting datasources.
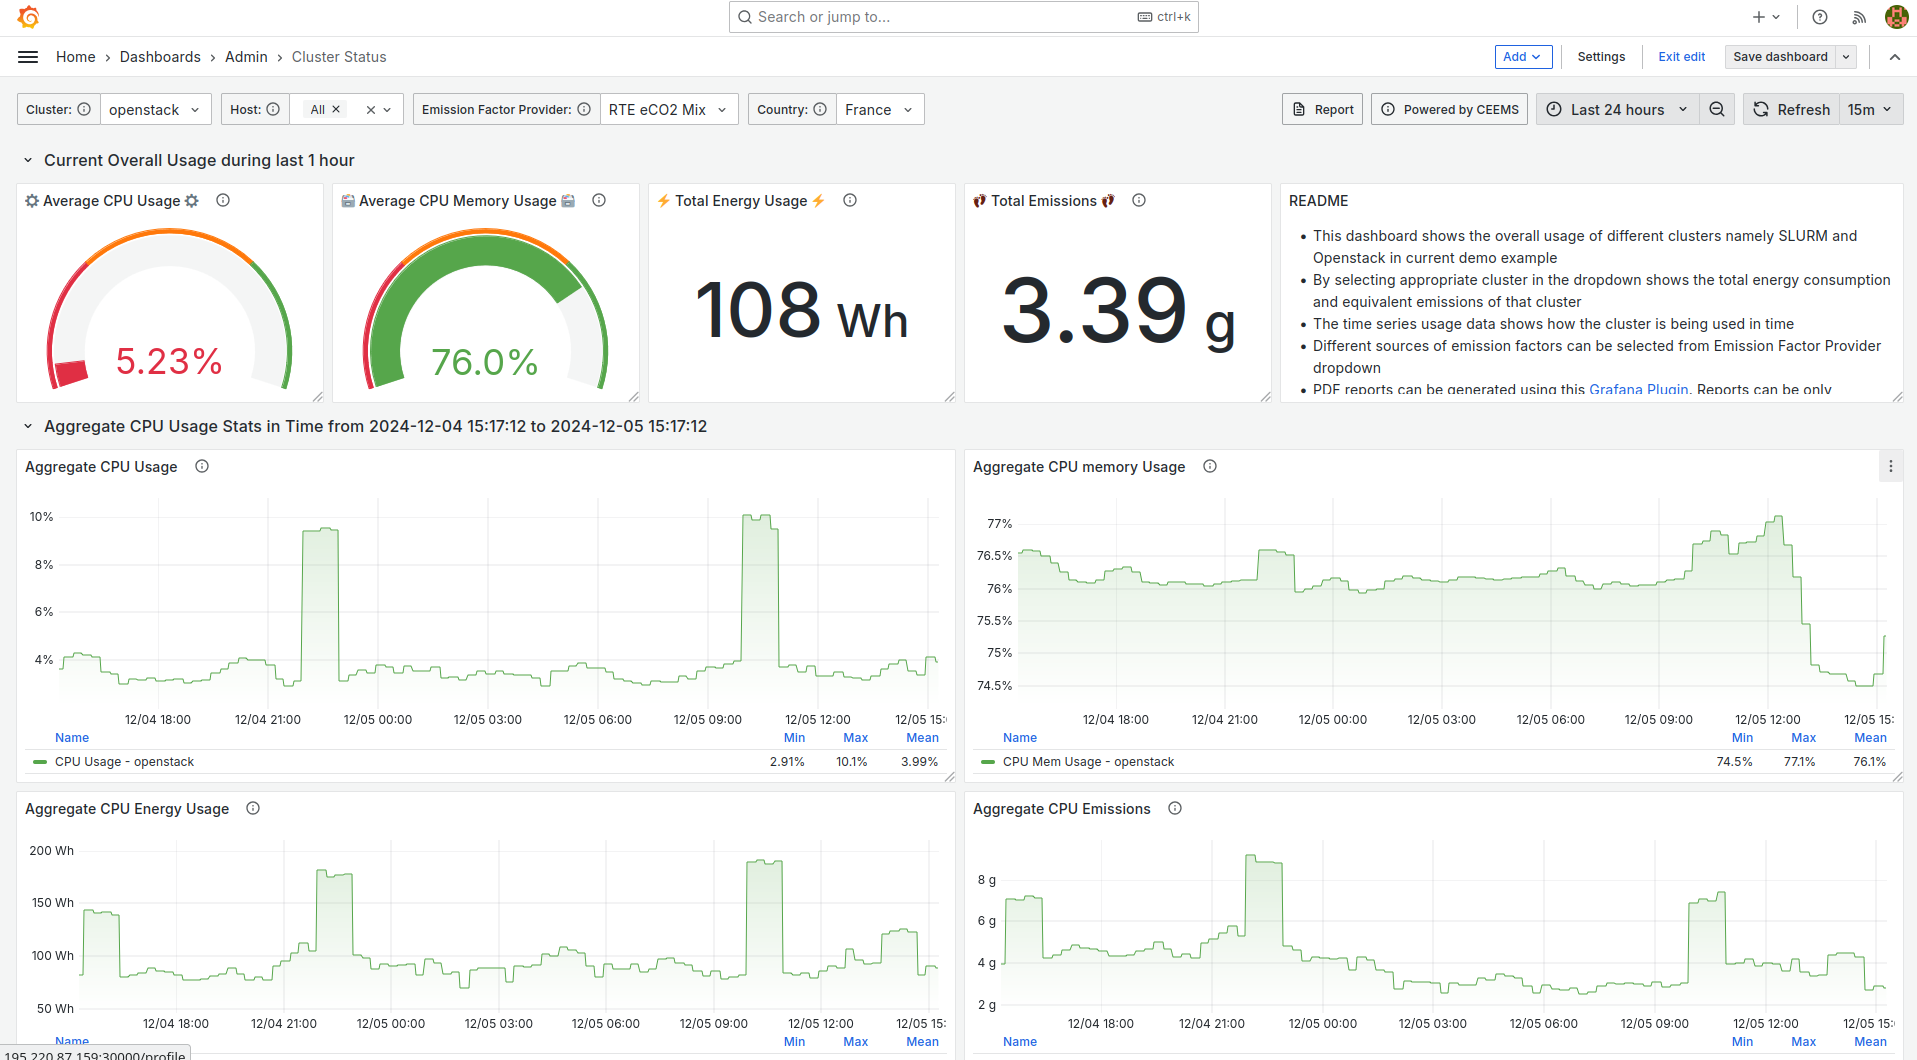
## Visualizing metrics with Grafana
Grafana can be used for visualization of metrics and below are some of the
screenshots of dashboards.
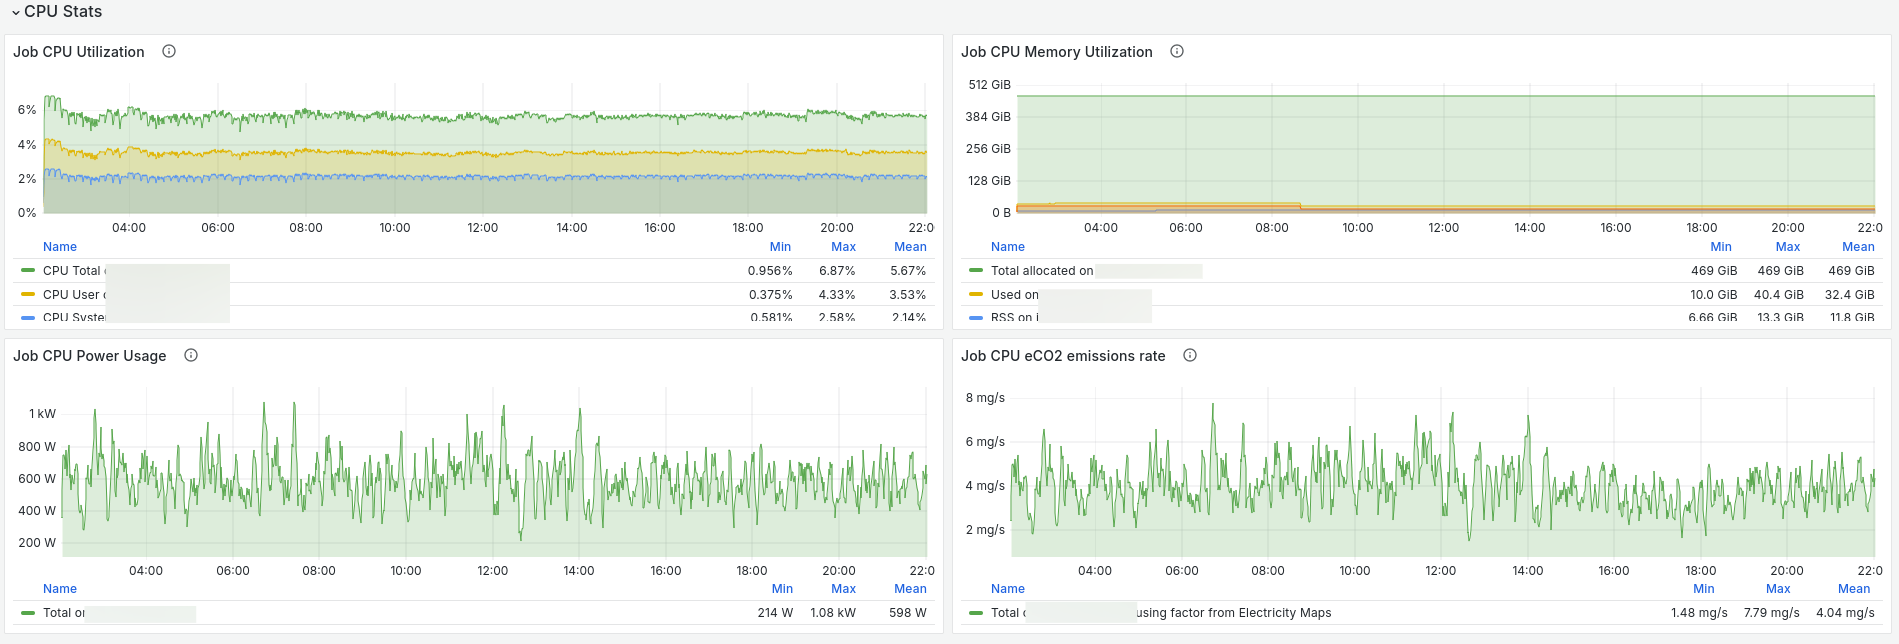
### Time series compute unit CPU metrics
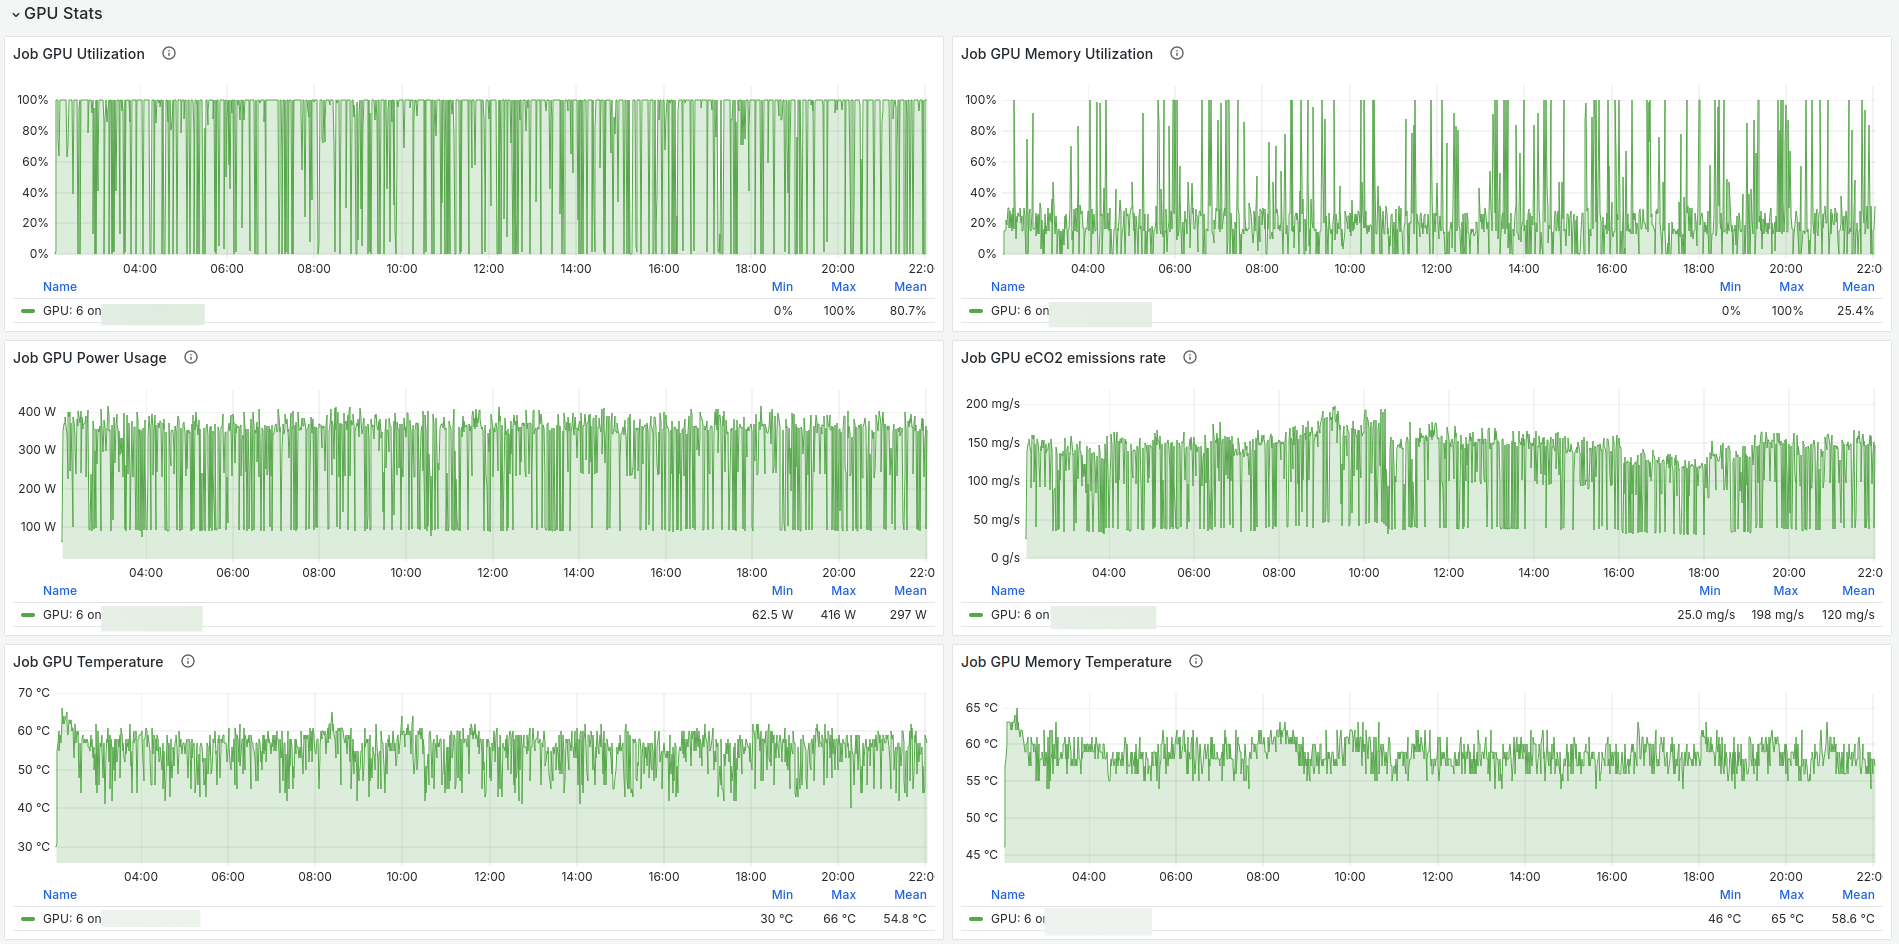
### Time series compute unit GPU metrics
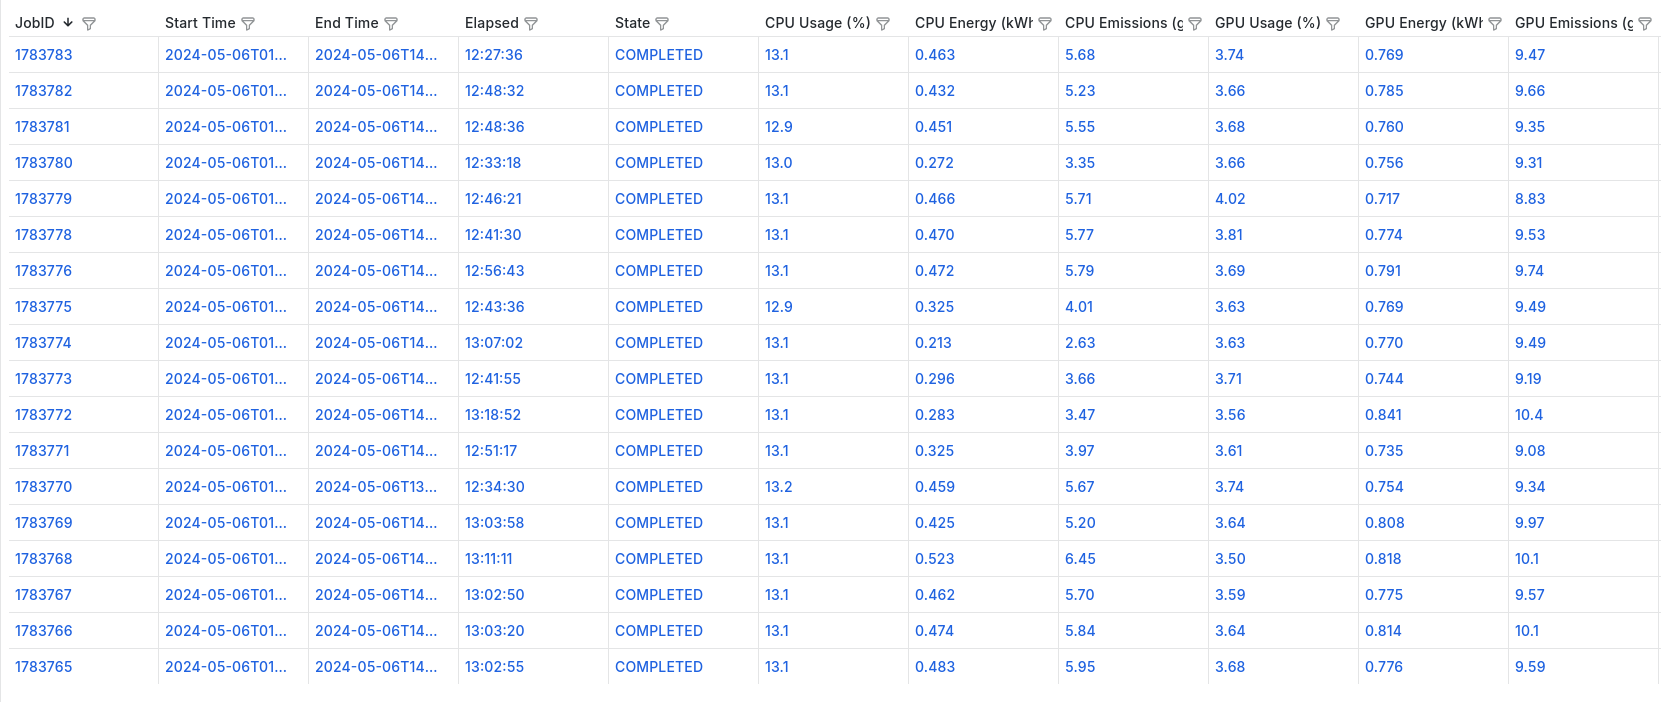
### List of compute units of user with aggregate metrics
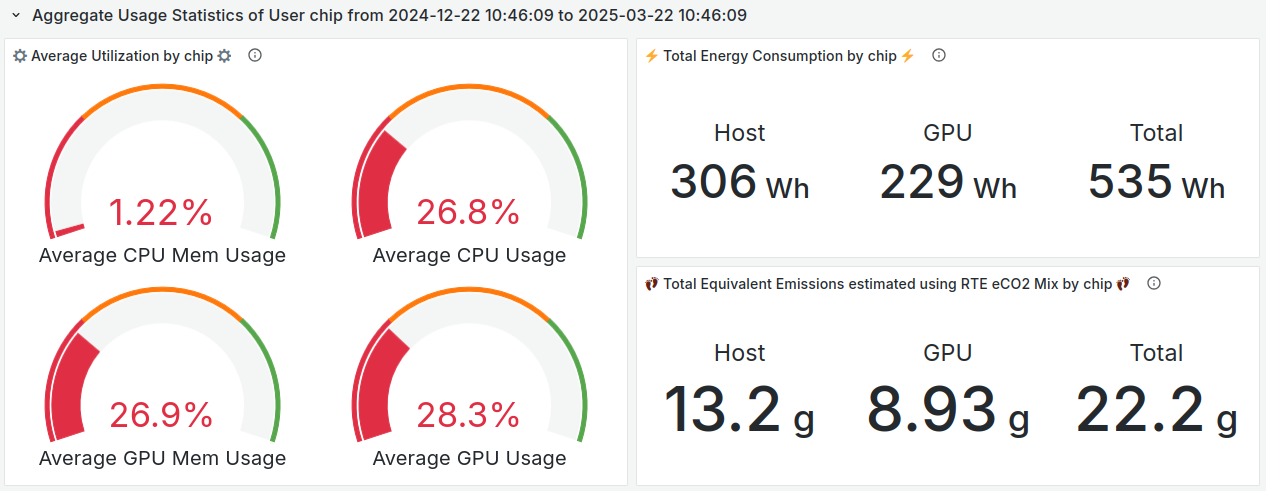
### Aggregate usage metrics of a user
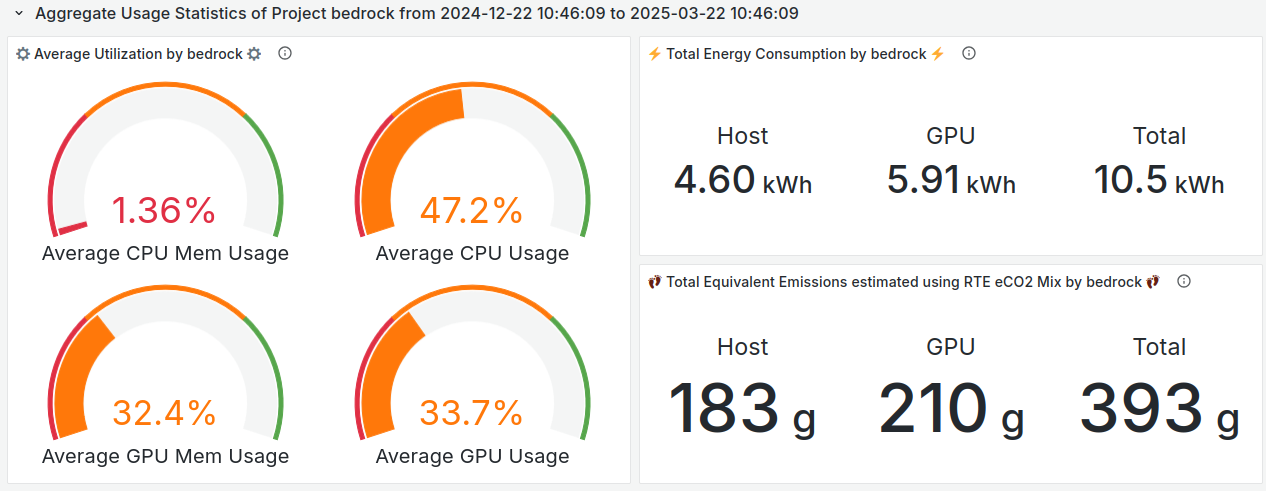
### Aggregate usage metrics of a project
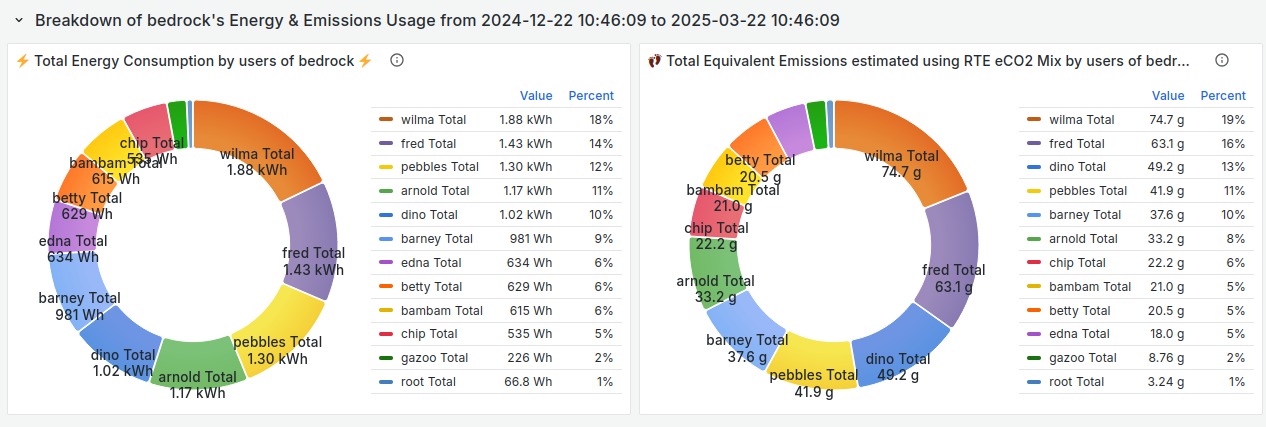
### Energy usage breakdown between project members
## Usage metrics via CLI tool
CEEMS ships a CLI tool for presenting usage metrics to end users for the deployments where Grafana usage is not
possible or prohibitive.
```bash
cacct --starttime="2025-01-01" --endtime="2025-03-22"
┌─────────┬─────────┬──────────┬────────┬────────┬──────────┬──────────────────────────────────────┬────────┬────────┬──────────┬──────────────────────────────────────┐
│ JOB ID │ ACCOUNT │ ELAPSED │ CPU US │ CPU ME │ HOST ENE │ HOST EMISSIO │ GPU US │ GPU ME │ GPU ENER │ GPU EMISSION │
│ │ │ │ AGE(%) │ M. USA │ RGY(KWH) │ NS(GMS) │ AGE(%) │ M. USA │ GY(KWH) │ S(GMS) │
│ │ │ │ │ GE(%) │ │ │ │ GE(%) │ │ │
│ │ │ │ │ │ │ EMAPS_TOTAL │ OWID_TOTAL │ RTE_TOTAL │ │ │ │ EMAPS_TOTAL │ OWID_TOTAL │ RTE_TOTAL │
├─────────┼─────────┼──────────┼────────┼────────┼──────────┼─────────────┼────────────┼───────────┼────────┼────────┼──────────┼─────────────┼────────────┼───────────┤
│ 106 │ bedrock │ 00:10:05 │ 99.32 │ 3.39 │ 0.053818 │ 4.725182 │ 5.648855 │ 3.860008 │ │ │ │ │ │ │
│ 108 │ bedrock │ 00:10:04 │ 99.60 │ 2.51 │ 0.055842 │ 5.091815 │ 5.840380 │ 4.197307 │ │ │ │ │ │ │
│ 118 │ bedrock │ 00:10:03 │ 99.65 │ 1.17 │ 0.061474 │ 4.450334 │ 6.512757 │ 3.683035 │ │ │ │ │ │ │
│ 131 │ bedrock │ 00:10:04 │ 99.71 │ 2.15 │ 0.055742 │ 1.835111 │ 5.562944 │ 1.245254 │ │ │ │ │ │ │
│ 134 │ bedrock │ 00:20:12 │ 0.53 │ 0.73 │ 0.004463 │ 0.030868 │ 0.100538 │ 0.021321 │ │ │ │ │ │ │
│ 138 │ bedrock │ 00:10:00 │ 99.61 │ 1.17 │ 0.056302 │ 2.595522 │ 5.570695 │ 1.837668 │ │ │ │ │ │ │
│ 150 │ bedrock │ 00:20:11 │ 0.54 │ 0.74 │ 0.003862 │ 0.076767 │ 0.086878 │ 0.058934 │ │ │ │ │ │ │
│ 154 │ bedrock │ 00:10:19 │ 99.48 │ 2.86 │ 0.055671 │ 4.906742 │ 6.610783 │ 4.127894 │ │ │ │ │ │ │
│ 162 │ bedrock │ 00:10:22 │ 96.51 │ 3.66 │ 0.055507 │ 3.274911 │ 4.711376 │ 2.497813 │ │ │ │ │ │ │
│ 163 │ bedrock │ 00:10:28 │ 99.71 │ 3.03 │ 0.051746 │ 3.673949 │ 4.392128 │ 2.780309 │ │ │ │ │ │ │
│ 169 │ bedrock │ 00:10:19 │ 99.71 │ 1.17 │ │ │ │ │ │ │ │ │ │ │
│ 181 │ bedrock │ 00:20:14 │ 0.56 │ 0.74 │ 0.001518 │ 0.115373 │ 0.085070 │ 0.081976 │ 36.31 │ 38.11 │ 0.184776 │ 14.042940 │ 10.354560 │ 9.977878 │
│ 183 │ bedrock │ 00:10:09 │ 99.68 │ 1.17 │ 0.049606 │ 3.676648 │ 2.779826 │ 2.926728 │ 37.87 │ 37.97 │ 0.187746 │ 13.919683 │ 10.521023 │ 11.077016 │
│ 229 │ bedrock │ 00:10:21 │ 99.57 │ 1.99 │ 0.048258 │ 1.930318 │ 2.704308 │ 1.109933 │ 38.71 │ 37.36 │ 0.197287 │ 7.891462 │ 11.055660 │ 4.537591 │
│ 232 │ bedrock │ 00:10:24 │ 99.63 │ 1.17 │ 0.050244 │ 1.385482 │ 2.815615 │ 0.954640 │ 31.90 │ 35.88 │ 0.131236 │ 3.618456 │ 7.354267 │ 2.493479 │
│ 269 │ bedrock │ 00:10:01 │ 99.69 │ 1.17 │ 0.048866 │ 2.738386 │ 2.123290 │ 22.18 │ 24.35 │ 0.0263 │ 1.477547 │ 1.141505 │ │ │
│ │ │ │ │ │ │ │ │ │ │ 67 │ │ │ │ │
│ 274 │ bedrock │ 00:10:16 │ 97.72 │ 3.49 │ 0.054060 │ 3.029430 │ 2.324568 │ │ │ │ │ │ │ │
├─────────┼─────────┴──────────┴────────┴────────┴──────────┴─────────────┴────────────┴───────────┴────────┴────────┴──────────┴─────────────┴────────────┴───────────┤
│ Summary │ │
├─────────┼─────────┬──────────┬────────┬────────┬──────────┬─────────────┬────────────┬───────────┬────────┬────────┬──────────┬─────────────┬────────────┬───────────┤
│ 20 │ bedrock │ 03:23:27 │ 69.84 │ 1.73 │ 0.706980 │ 37.769023 │ 59.189969 │ 33.830679 │ 35.74 │ 35.32 │ 0.727410 │ 39.472541 │ 40.763058 │ 29.227470 │
└─────────┴─────────┴──────────┴────────┴────────┴──────────┴─────────────┴────────────┴───────────┴────────┴────────┴──────────┴─────────────┴────────────┴───────────┘
```
## ⚡️ Talks and Demos
- [eBPF based I/O monitoring at ISC 2025](https://docs.google.com/presentation/d/11eqA9Bxf1hyKpGAXtZBN6mrm-X6YEZSllVNZ8dEkfnE/edit?usp=sharing)
- [Paper submitted to SC24 in Sustainable Computing Workshop](https://conferences.computer.org/sc-wpub/pdfs/SC-W2024-6oZmigAQfgJ1GhPL0yE3pS/555400b862/555400b862.pdf)
- [CEEMS at SC 2024](https://docs.google.com/presentation/d/1XBhfiHdTbNrS6e_I9mPy_BLPFEiAkmIwgp6FvSdMbLM/edit#slide=id.g317b4bf7fbe_2_54)
- [An Introduction to CEEMS at ISC 2024](https://drive.google.com/file/d/1kUbD3GgDKwzgIuxjrTY95YJN5aSuIejQ/view?usp=drive_link)
- [CEEMS Architecture and Usage](https://docs.google.com/presentation/d/1xNQTCsmPUz37KDb2BLrpWExuQWxk49NpVN9VDbxSe6Y/edit#slide=id.p)
## 🤝 Adopters
- Currently CEEMS is running on [Jean Zay HPC](http://www.idris.fr/eng/jean-zay/jean-zay-presentation-eng.html)
platform that has a daily job churn rate of around 25k jobs with a scrape interval of 10s.
- [LJAD](https://math.univ-cotedazur.fr) lab from [Université Côte d'Azur](https://univ-cotedazur.fr/)
is using CEEMS on their SLURM cluster for monitoring the energy consumption of user jobs.
## 👍 Contributing
We welcome contributions to this project, we hope to see this project grow and become
a useful tool for people who are interested in the energy and carbon footprint of their
workloads. A comprehensive guide can be found in
[CONTRIBUTING.md](https://github.com/ceems-dev/ceems/blob/main/CONTRIBUTING.md).
Please feel free to open issues and/or discussions for any potential ideas of
improvement.
## 🙏 Acknowledgements
- [Grid5000](https://www.grid5000.fr/w/Grid5000:Home) platform, supported by a scientific
interest group hosted by [Inria](https://www.inria.fr/) and including [CNRS](https://www.cnrs.fr/en),
[RENATER](https://www.renater.fr/en/accueil-english/) and several Universities as
well as other organizations, has been extensively used in the development of CEEMS.
- The demo instance has been deployed on the [CROCC](https://drocc.fr/crocc/)
which was kindly sponsored by [ISDM MESO](https://isdm.umontpellier.fr/mesolr)
in Montpellier, France.
## 💬 Contact
You can get in contact with the CEEMS community in the following ways:
### Discord
Please join the community's [Discord](https://discord.gg/bedRvX5uVY) server for keeping
up with the latest news about CEEMS, posting questions and, generally getting in touch
with other users and the developers.
## ⭐️ Project assistance
If you want to say **thank you** or/and support active development of CEEMS:
- Add a [GitHub Star](https://github.com/ceems-dev/ceems) to the project.
- Write articles about project on [Dev.to](https://dev.to/), [Medium](https://medium.com/) or personal blog.