https://github.com/chengzuopeng/ccgauge
Claude Code Dashboard — local web UI for Claude Code token usage and cost. npx ccgauge
https://github.com/chengzuopeng/ccgauge
anthropic claude claude-code cli cost-tracker dashboard nextjs usage-tracker
Last synced: 2 days ago
JSON representation
Claude Code Dashboard — local web UI for Claude Code token usage and cost. npx ccgauge
- Host: GitHub
- URL: https://github.com/chengzuopeng/ccgauge
- Owner: chengzuopeng
- License: mit
- Created: 2026-05-03T14:45:22.000Z (about 2 months ago)
- Default Branch: main
- Last Pushed: 2026-06-19T12:32:44.000Z (5 days ago)
- Last Synced: 2026-06-19T14:25:04.214Z (5 days ago)
- Topics: anthropic, claude, claude-code, cli, cost-tracker, dashboard, nextjs, usage-tracker
- Language: TypeScript
- Homepage: https://www.npmjs.com/package/ccgauge
- Size: 12.2 MB
- Stars: 2
- Watchers: 0
- Forks: 0
- Open Issues: 0
-
Metadata Files:
- Readme: README.md
- Changelog: CHANGELOG.md
- License: LICENSE
- Agents: AGENTS.md
Awesome Lists containing this project
README
# ccgauge
**Tokens, cost, and cache-savings dashboard for Claude Code + Codex CLI.**
One command. Zero install. Everything stays on your laptop.
[](https://www.npmjs.com/package/ccgauge)
[](https://github.com/chengzuopeng/ccgauge/blob/main/LICENSE)
[](#)
**🌐 [chengzuopeng.github.io/ccgauge](https://chengzuopeng.github.io/ccgauge)**
[English](https://github.com/chengzuopeng/ccgauge/blob/main/README.md) · [简体中文](https://github.com/chengzuopeng/ccgauge/blob/main/README.zh-CN.md)
```bash
npx ccgauge
```
ccgauge reads the JSONL session files Claude Code and Codex CLI already store on your disk, computes day / project / model / session breakdowns plus **dollar-equivalent cost**, and opens a unified browser dashboard. Switch providers with one click. Ask your LLM about your usage via the built-in MCP server. Or skip the browser entirely and run `ccgauge report -d` for a rich terminal dashboard.
**No login. No telemetry. No outbound network calls.**
---
## Why ccgauge stands out
- 🪟 **Two CLIs, one dashboard.** Claude Code and Codex CLI side by side — switch sources from the nav bar, or merge them in the All view. No other dashboard covers both.
- 💰 **Cache savings as a first-class KPI.** See exactly how many dollars Anthropic prompt caching saved you this week. Not a footnote — a card on the overview.
- ⏱️ **Live 5-hour block.** Countdown, progress bar, projected total cost — know when the rate-limit window rolls over *before* you hit it.
- 🤖 **MCP-native.** Plug into Claude Desktop / Cursor / Cline and ask *"What did I work on yesterday, by project?"* in plain English. Real numbers, no screenshots, no copy-paste.
- 🔒 **100% local & private.** Reads JSONL files you already have. Zero outbound calls. MIT licensed. Your transcripts never leave the machine.
- 🪜 **Worktree-aware projects.** All worktrees of the same repo collapse into one project row — the way you actually think about your work.
## What's new in v1.1.0
- **`ccgauge report --dashboard` / `-d`** — rich one-screen TUI: KPI tiles, stacked-bar trend chart, breakdown tables, day×hour heatmap. Perfect for SSH / tmux / a quick check without leaving the terminal. Falls back to plain text below 80 columns.
- **Custom date range** on `/usage` — proper calendar picker (react-day-picker), brand-themed, follows your language toggle. `?range=custom&from=...&to=...` URL contract.
- **Marketing site at root URLs** — English at `/cli/` / `/features/` / `/mcp/`, Chinese under `/zh/...`. Old `/en/*` paths still resolve via static redirects.
See [CHANGELOG.md](https://github.com/chengzuopeng/ccgauge/blob/main/CHANGELOG.md) for the full release notes.
## Features
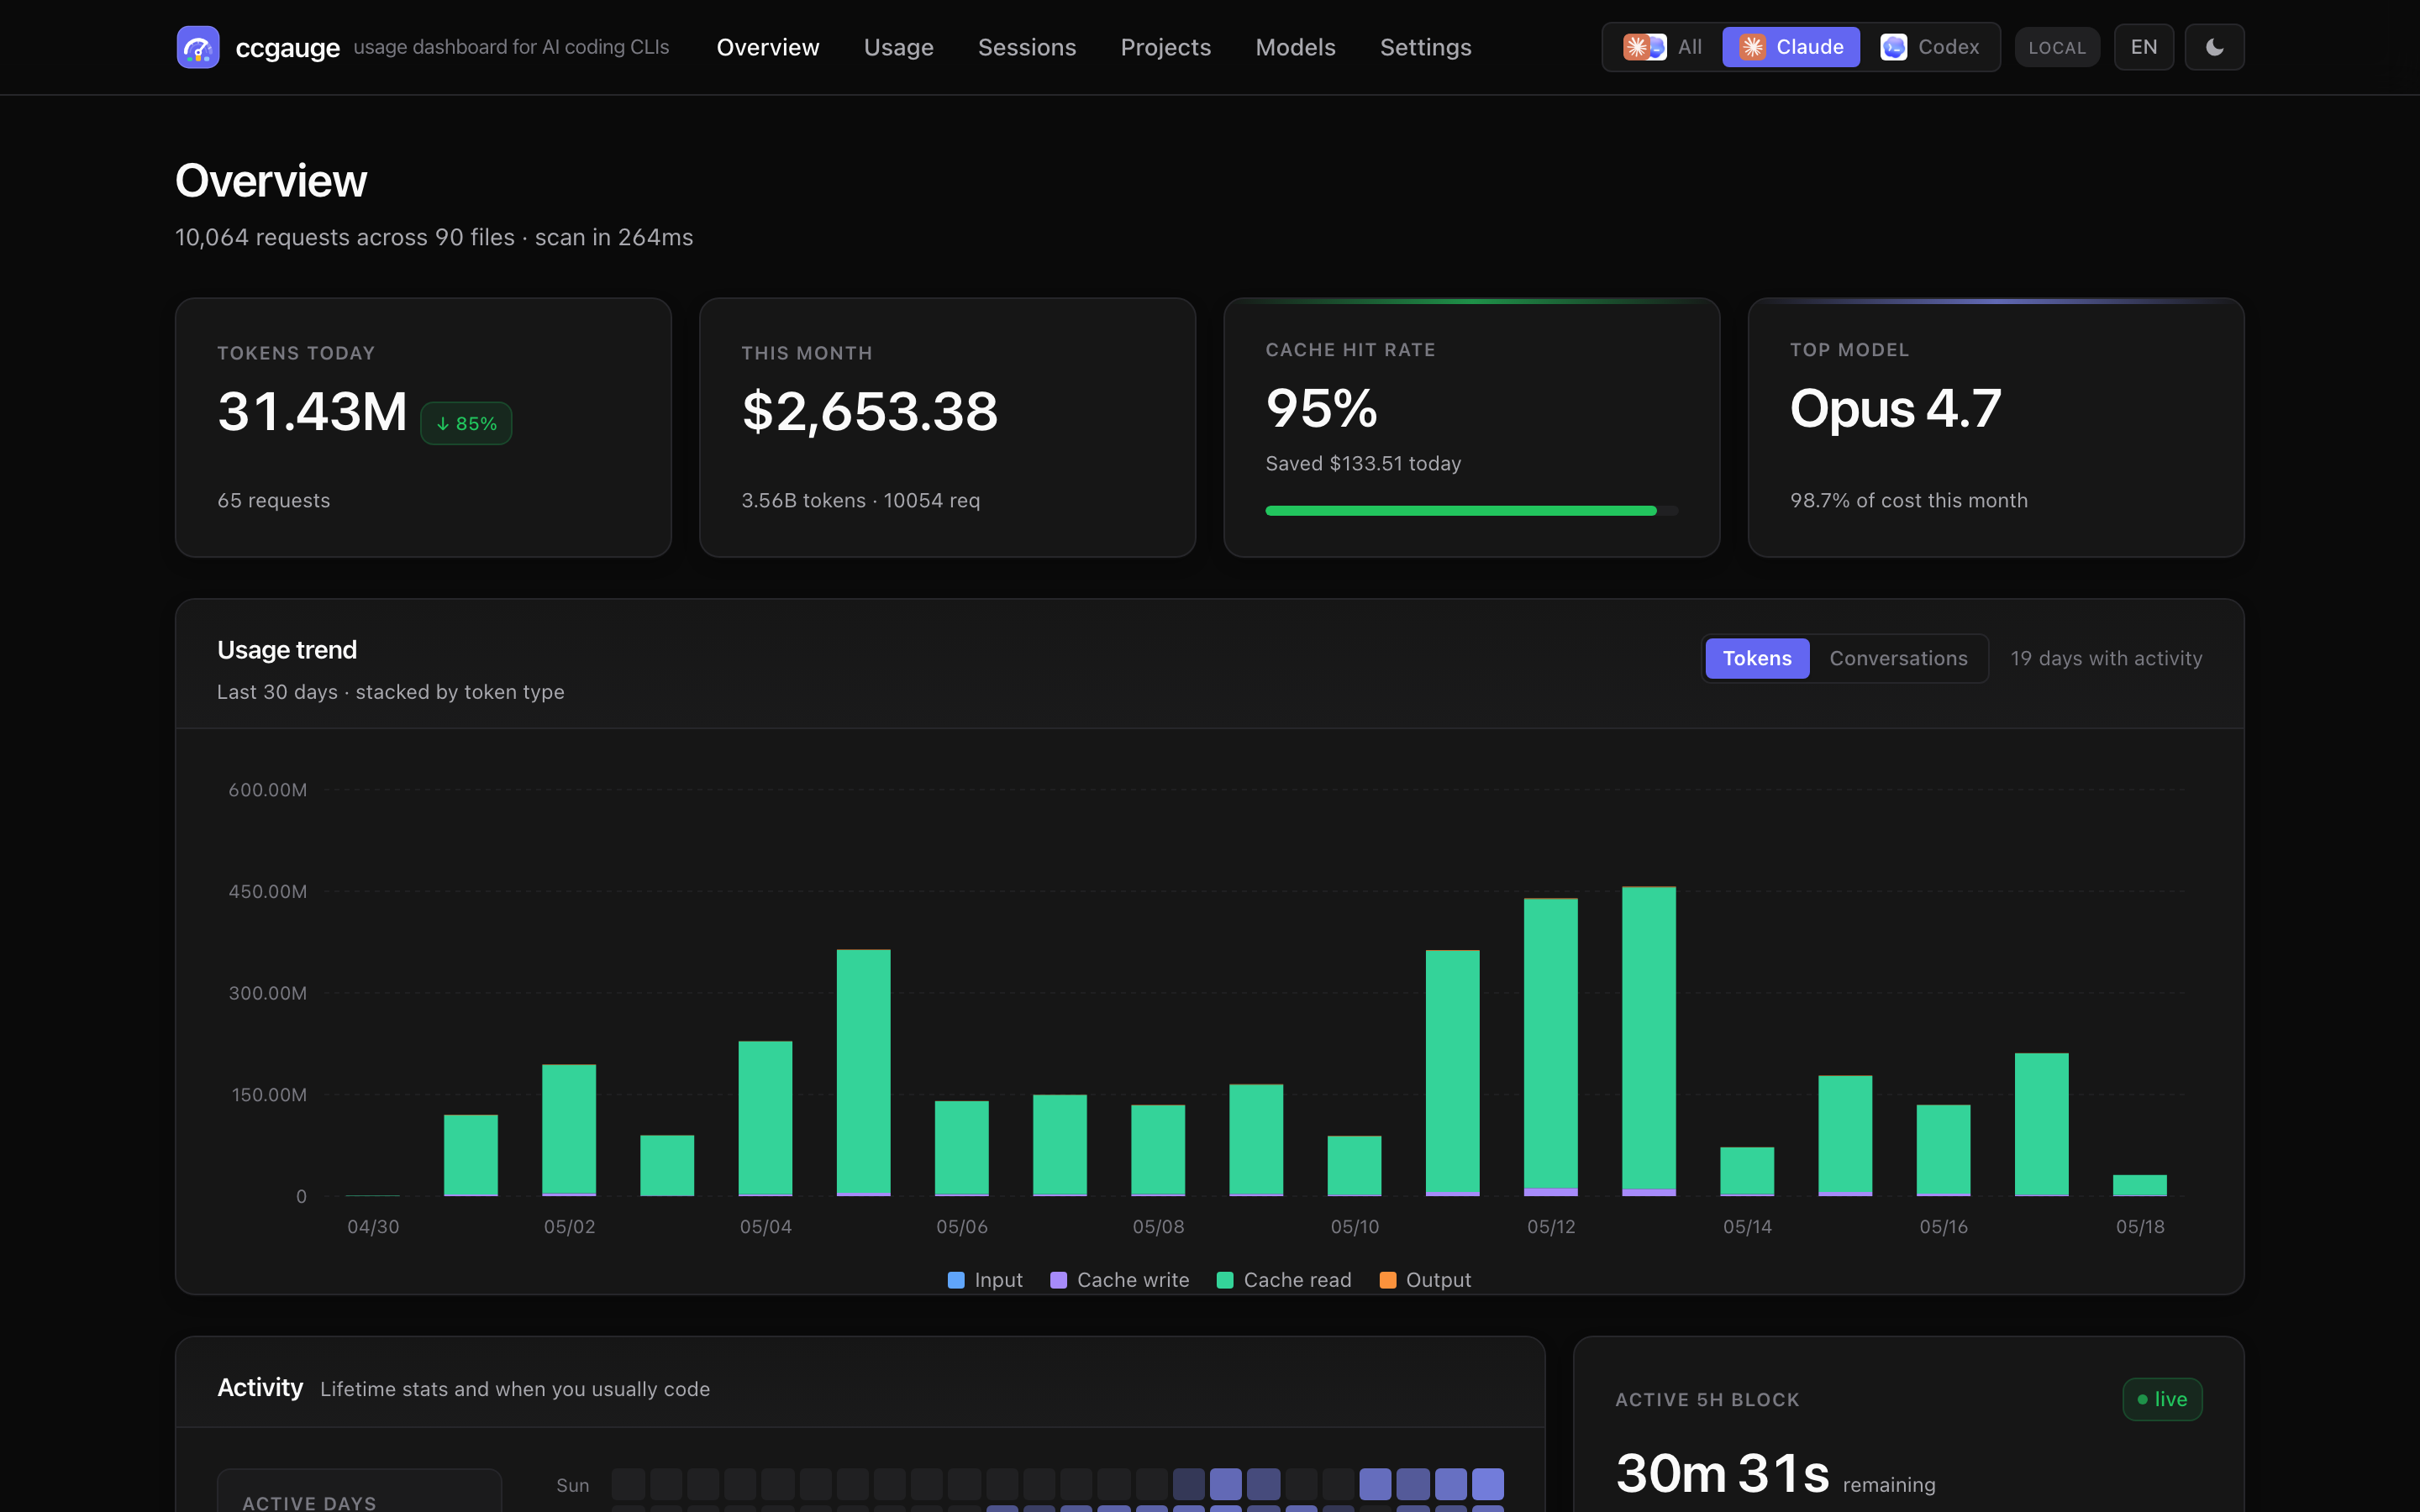
### Dashboard (browser)
- **Overview** — 6 KPI cards (tokens today / cost / cache hit / top model / active sessions / live 5h block) with day-over-day delta on each.
- **Usage** — turn-grouped table with expandable tool calls, CSV export, **Tokens / Conversations** chart toggle. Filters: range (incl. **custom date**), granularity, model + project multi-select.
- **Sessions** — per-conversation list with model / tokens / cost / duration; click in for the message-level timeline.
- **Projects** — per-`cwd` aggregation with sparkline and spend share; worktrees auto-collapsed.
- **Models** — side-by-side cost share, token share, cache hit, official per-1M pricing.
- **Light / Dark / System** themes (no flash), **EN / 中文**, cookie + localStorage synced.
### CLI report (terminal)
- `ccgauge report` — colored, aligned text report in ~0.2s, ideal for CI.
- `ccgauge report -d` — rich TUI: KPI tiles, stacked vertical-bar trend, double-column breakdown tables, 7×24 activity heatmap.
- Filters: `--range / --source / --by / --since / --until / --model / --project`.
- `--json` for scripts; `--no-color` auto-detected when piped.
### MCP server (LLM access)
- `ccgauge mcp` — stdio JSON-RPC server. Plug into Claude Desktop / Cursor / Cline / your own agent.
- **9 tools** for usage summary, time-series, per-model / project / session breakdowns, daily / weekly summaries, recent activity, hypothetical cost estimator.
- Reasoning-token breakdown for models that emit one.
- Separate cache (`index-mcp-v2.json`) so MCP and the dashboard never fight.
### Cost transparency
- **Cache savings** quantified as a dollar figure on the overview.
- Codex cost shown as **OpenAI API equivalent** so subscription users can compare value against pay-as-you-go.
- Built-in pricing: 12 Claude models + gpt-5 family + o-series; unknown models fall back to family-latest.
### Privacy by design
- 100% local: read-only access to JSONL files, zero outbound calls.
- Open source, MIT licensed.
- Background mode for an always-on service with `start / stop / restart / status / open / logs` lifecycle commands.
## Quick start
```bash
npx ccgauge # zero-install one-shot
npm i -g ccgauge && ccgauge # or install globally
```
Dashboard opens at [http://localhost:3737](http://localhost:3737). If the port is busy, ccgauge picks the next free one. `Ctrl+C` to stop.
**Requirements:** Node.js 20+. macOS / Linux / Windows.
## CLI
### Commands
| Command | Purpose |
| --- | --- |
| `ccgauge`, `ccgauge start` | Start dashboard server in foreground. |
| `ccgauge start --background` | Start a detached background service. |
| `ccgauge stop [--force]` | Stop the background service. |
| `ccgauge restart [options]` | Stop and re-start with new options. |
| `ccgauge status [--json]` | Inspect background service. Exits **3** (systemd-style "not running") when nothing is up. |
| `ccgauge open` | Open the running dashboard in your browser. |
| `ccgauge logs [-f] [-n N]` | Tail the background-service log. |
| `ccgauge report [options]` | One-shot text or TUI report (no server). |
| `ccgauge mcp` | Start the MCP server on stdio for LLM access. |
| `ccgauge doctor` | One-screen diagnostic — paste into bug reports. |
### Startup options
| Option | Default | Purpose |
| --- | --- | --- |
| `-p, --port ` | `3737` | Preferred port. Falls back if busy unless `--strict-port`. |
| `-H, --host ` | `127.0.0.1` | Bind host. |
| `--no-open` | — | Skip auto-open in foreground. |
| `-b, --background` | — | Run as detached background service. |
| `-q, --quiet` | — | Silence Next.js output. |
| `--dir ` | — | Add `/projects` as an extra Claude source. |
| `--strict-port` | — | Fail if the preferred port is busy. |
### Background mode
```bash
ccgauge start -b # detached service, state in ~/.ccgauge/
ccgauge status # PID / URL / uptime
ccgauge logs --follow # tail the service log
ccgauge stop # graceful stop (or --force)
```
`~/.ccgauge/` holds `state.json` (PID, URL, start time, log path) and `ccgauge.log`. Override with `CCGAUGE_STATE_DIR=/tmp/profile` for isolated profiles.
### `ccgauge report`
```bash
ccgauge report # last 7d, all sources, text
ccgauge report -d # rich TUI dashboard
ccgauge report -r 30d -b project # 30 days, broken down by project
ccgauge report -s codex -m gpt-5 # only Codex, only gpt-5 models
ccgauge report --json # machine-readable
```
| Option | Default | Purpose |
| --- | --- | --- |
| `-r, --range ` | `7d` | `today` / `1d` / `7d` / `30d` / `90d` / `all` |
| `-s, --source ` | `all` | `claude` / `codex` / `all` |
| `-b, --by ` | `model` | Breakdown: `model` / `project` / `session` |
| `-g, --gran ` | `day` | Trend bucket: `hour` / `day` / `week` / `month` |
| `-n, --limit ` | `10` | Rows in the breakdown table |
| `--since` / `--until` | — | ISO date range override (`YYYY-MM-DD`, local day-aligned) |
| `-m, --model ` | — | Filter records whose model contains `` |
| `--project ` | — | Filter by project basename / cwd substring |
| `-d, --dashboard` | — | Rich one-screen TUI layout (KPI tiles + stacked trend + breakdown + heatmap) |
| `--width ` | tty cols | Force output width — useful for screenshots / CI |
| `--no-banner / --compact` | — | Dashboard trimmings (skip banner / skip trend chart) |
| `-j, --json` | — | JSON output |
| `--no-color` | auto | Disable ANSI colors (auto when piped) |
| `--no-trend / --no-breakdown` | — | Skip sections (text mode only) |
## MCP — let an LLM query your usage
Configure once, then ask in plain English. Snippet shape is the same across clients (Claude Desktop / Cursor / Cline / Continue):
```json
{
"mcpServers": {
"ccgauge": {
"command": "npx",
"args": ["-y", "ccgauge", "mcp"]
}
}
}
```
Restart your client. Try: *"What ccgauge tools do you have? Run usage_summary for last 7 days."*
If you've installed ccgauge globally, drop the `npx` and use `"command": "ccgauge"`. To override scan paths, pass `CLAUDE_CONFIG_DIR` / `CCGAUGE_CODEX_DIR` via the `env` field.
### Tools
| Tool | What it answers |
| --- | --- |
| `usage_summary` | Total tokens / cost / cache savings for a date range. Always returns combined totals + per-source breakdown. |
| `usage_by_time` | Time-series buckets (hour / day / week / month) for trend questions. |
| `usage_by_model` | Per-model cost share. Each entry tagged with its `source`. |
| `usage_by_project` | Per-project (`cwd`) cost share + session counts + last activity. |
| `usage_by_session` | Session list sorted by recent / cost / tokens / duration. |
| `daily_summary` | *"What did I do today / yesterday / on YYYY-MM-DD?"* — sessions grouped by project + top tool calls. |
| `weekly_summary` | 7-day roll-up: daily cost trend, top sessions / projects, models. `week_offset=-1` for last week. |
| `recent_activity` | N most recently active sessions across providers. |
| `cost_estimator` | USD cost of a hypothetical request. Uses built-in pricing tables; does NOT consult history. |
Every analytical tool accepts `source` (`claude` / `codex` / `all`) and either `range` (`today` / `7d` / `30d` / `this_week` / `last_week` / `this_month` / `last_month` / `all`) or explicit `from` / `to`. The `all` view always returns combined totals + a `bySource: { claude, codex }` breakdown — one call, two answers.
### Prompt examples
- *"How much did I spend on AI coding this week, broken down by Claude vs Codex?"*
- *"Show me a daily cost trend for the last 30 days."*
- *"Top 5 most expensive sessions this month?"*
- *"What did I work on yesterday? Group by project."*
- *"Generate a Monday standup bullet list of what I shipped last week."*
- *"At my current burn rate, how much will I spend this month? If I run another 200K input + 50K output on Opus 4.7 today, what does that add?"*
### Privacy & troubleshooting
- **stdio only** in v1 — no network ports.
- Reads only existing JSONL files; absolute paths in error messages are scrubbed (`$HOME` → `~`).
| Symptom | Try |
| --- | --- |
| Client doesn't see tools | Restart client after editing config; run `ccgauge mcp --check` or `ccgauge doctor` |
| First call is slow | Cold start indexes all JSONL (~1–3s for 100 files); subsequent calls are O(1) |
| "no providers detected" | Pass `CLAUDE_CONFIG_DIR` / `CCGAUGE_CODEX_DIR` via `env` in MCP config |
| Want to see server logs | Watch client's MCP log — ccgauge writes to **stderr** (stdout is reserved for JSON-RPC) |
## Configuration
ccgauge auto-detects standard locations:
| Provider | Default sources |
| --- | --- |
| Claude Code | `~/.claude/projects`, `~/.config/claude/projects` |
| OpenAI Codex CLI | `~/.codex/sessions`, `~/.codex/archived_sessions` |
Override / extend via environment variables:
| Variable | Effect |
| --- | --- |
| `CLAUDE_CONFIG_DIR` | Add `/projects` as a Claude data source |
| `CCGAUGE_CONFIG_DIR` | Same as above (legacy ccgauge name) |
| `CCGAUGE_CODEX_DIR` | Add an extra Codex sessions directory |
| `CODEX_HOME` | Add `/sessions` and `/archived_sessions` |
| `CCGAUGE_STATE_DIR` | Override background service state / log directory |
## Develop
```bash
git clone https://github.com/chengzuopeng/ccgauge.git
cd ccgauge
pnpm install
pnpm dev # http://localhost:3738
pnpm typecheck # tsc --noEmit
pnpm test # parser smoke tests (Node 22+)
pnpm build # next build + bundle MCP + bundle CLI report
```
The repo is a working Next.js project — hot-reload against your live data while iterating. Adding a third provider (Gemini CLI, Cursor, Aider, …) is one new directory in [`lib/providers//`](https://github.com/chengzuopeng/ccgauge/tree/main/lib/providers) plus one registry line — `scan.ts`, the aggregator, the pricing module, and every page need no changes.
The marketing site lives in [`site/`](https://github.com/chengzuopeng/ccgauge/tree/main/site) (Astro + Tailwind) and ships separately from the npm package — run with `pnpm site:dev`.
## Troubleshooting
> First stop for any "why doesn't this work" question: **`ccgauge doctor`**. One screen, version + env + build artifacts + service state + per-provider scan. Paste into bug reports.
| Symptom | Try |
| --- | --- |
| Port keeps drifting | `ccgauge --strict-port --port 3737` |
| Stale background service | `ccgauge status`, then `ccgauge stop --force` |
| Background didn't start | `ccgauge logs` reads `~/.ccgauge/ccgauge.log` |
| No data shown for Codex | Ensure `~/.codex/sessions` exists; check the **Settings** page for detected paths |
| Want to bypass auto-open | `ccgauge --no-open` |
## FAQ
**Does ccgauge upload anything?**
No. Runs entirely on your machine; reads JSONL files Claude Code and Codex CLI already store locally; zero outbound calls; no API credentials needed.
**How is this different from [ccusage](https://github.com/ryoppippi/ccusage)?**
ccusage is a CLI that prints usage tables. ccgauge is a polished web dashboard with charts, per-session drill-down, a 5h rate-limit countdown, project / model breakdowns — and **also covers OpenAI Codex CLI** out of the box. Plus an MCP server so your LLM can answer questions about your usage in plain English, and an in-terminal TUI dashboard (`ccgauge report -d`) for when the browser isn't an option.
**Does it work for Claude Pro / Max / Team / Codex Plus subscribers?**
Yes. The dashboard always reports the **API-equivalent dollar value** of your usage — useful to gauge *"how much would this cost on PAYG?"*. Subscription plans bill differently; ccgauge is not your invoice.
**Which models are supported?**
All `claude-*` (Opus / Sonnet / Haiku, 3.x and 4.x) and the gpt-5 family + gpt-4.1 family + o-series (o3, o4-mini). Unknown models fall back to family-latest pricing automatically.
## License
MIT — see [LICENSE](https://github.com/chengzuopeng/ccgauge/blob/main/LICENSE).