https://github.com/chigix/linked-data-graphic
Linked Data Graphic and Visualization Components for Angular
https://github.com/chigix/linked-data-graphic
angular component linked-data ontology semantic-web visualization
Last synced: 9 months ago
JSON representation
Linked Data Graphic and Visualization Components for Angular
- Host: GitHub
- URL: https://github.com/chigix/linked-data-graphic
- Owner: chigix
- License: mit
- Created: 2019-04-21T18:28:43.000Z (about 7 years ago)
- Default Branch: master
- Last Pushed: 2023-01-26T22:41:06.000Z (over 3 years ago)
- Last Synced: 2025-09-26T01:55:47.736Z (10 months ago)
- Topics: angular, component, linked-data, ontology, semantic-web, visualization
- Language: TypeScript
- Homepage: https://linked-data-graphic.web.app/
- Size: 3.78 MB
- Stars: 8
- Watchers: 2
- Forks: 2
- Open Issues: 21
-
Metadata Files:
- Readme: README.md
- License: LICENSE
Awesome Lists containing this project
README
# 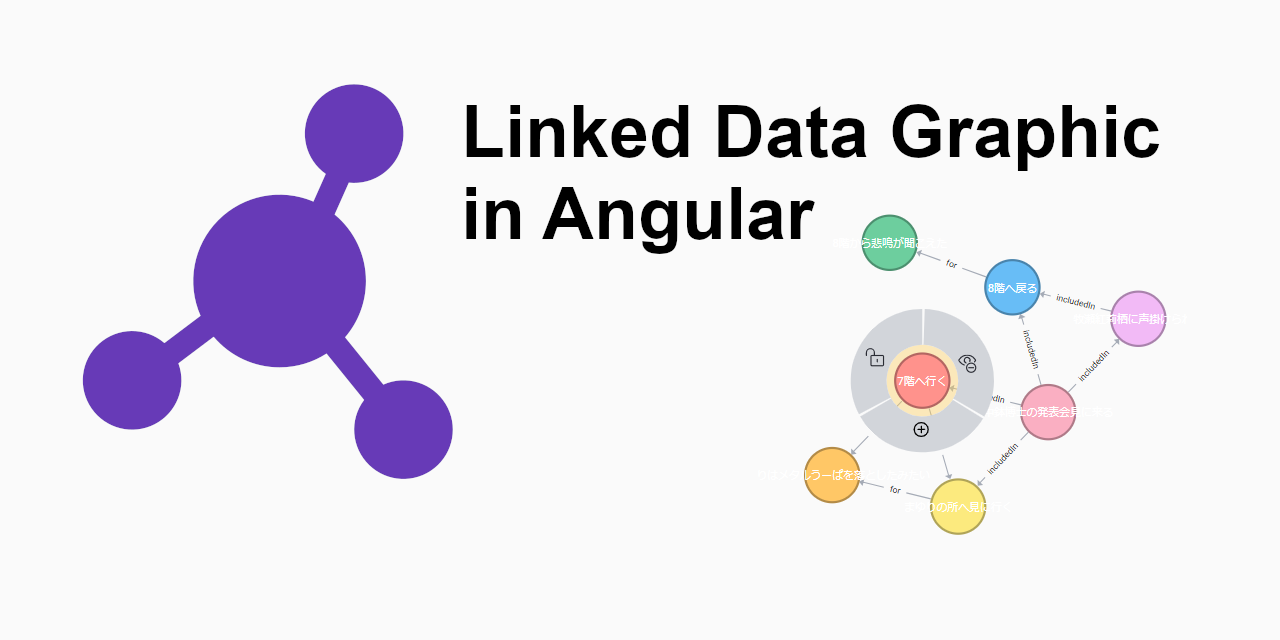
An Angular Module to have a Linked Data Visualization similar to neo4j.
[](https://www.npmjs.com/package/@ngld/canvas)
[](https://www.npmjs.com/package/@ngld/icon)
[](https://www.npmjs.com/package/@ngld/pan-zoom)
[](https://www.npmjs.com/package/@ngld/transition)
[](https://lernajs.io/)
## Features
* Compaptible with the Neo4j data format
* Compatible the D3.js data format: https://github.com/d3/d3-force#link_links , https://github.com/d3/d3-force#simulation_nodes
* Force simulation.
* Angular directives for event binding of hovering on nodes and relationshipis.
* A default info panel component that can be simply connected to the graph.
* An Angular Service to customize node colors of fill and strokes.
* Text nodes + Font Awesome icon nodes + SVG image nodes (e.g. using Twitter * Emoji)).
* Sticky nodes (drag to stick, single click to unstick).
* Toolbar to operate graph update
* Highlight nodes on init.
* Relationship auto-orientation.
* Zoom, pan, auto fit.
* More than one relationship between two nodes. (Coming Soon)
* Markers. (Coming Soon)
## Dependency
* Angular >= 10.0.0
## Quick Usage
Install this component through npm:
```bash
npm install @ngld/canvas
```
Add the component's element into the template with a prepared Linked Data set
conforming to D3's [node](https://github.com/d3/d3-force#simulation_nodes) and
[links](https://github.com/d3/d3-force#link_links) structure.
```html
```
## Story
This library is greatly inspired by the neo4j visualization library:
https://github.com/eisman/neo4jd3
## License
MIT