https://github.com/cirocosta/sample-collect-docker-metrics
Example of how to integrate Prometheus, Grafana and Docker Daemon metrics
https://github.com/cirocosta/sample-collect-docker-metrics
containers docker grafana metrics monitoring prometheus
Last synced: 5 months ago
JSON representation
Example of how to integrate Prometheus, Grafana and Docker Daemon metrics
- Host: GitHub
- URL: https://github.com/cirocosta/sample-collect-docker-metrics
- Owner: cirocosta
- Created: 2018-07-24T12:34:47.000Z (about 8 years ago)
- Default Branch: master
- Last Pushed: 2018-07-24T15:20:24.000Z (about 8 years ago)
- Last Synced: 2025-05-12T19:11:44.612Z (about 1 year ago)
- Topics: containers, docker, grafana, metrics, monitoring, prometheus
- Language: Shell
- Homepage: https://ops.tips/gists/how-to-collect-docker-daemon-metrics/
- Size: 10.7 KB
- Stars: 5
- Watchers: 1
- Forks: 7
- Open Issues: 0
-
Metadata Files:
- Readme: README.md
Awesome Lists containing this project
README
Sample Docker daemon metrics collection
How to collect Docker Daemon Metrics
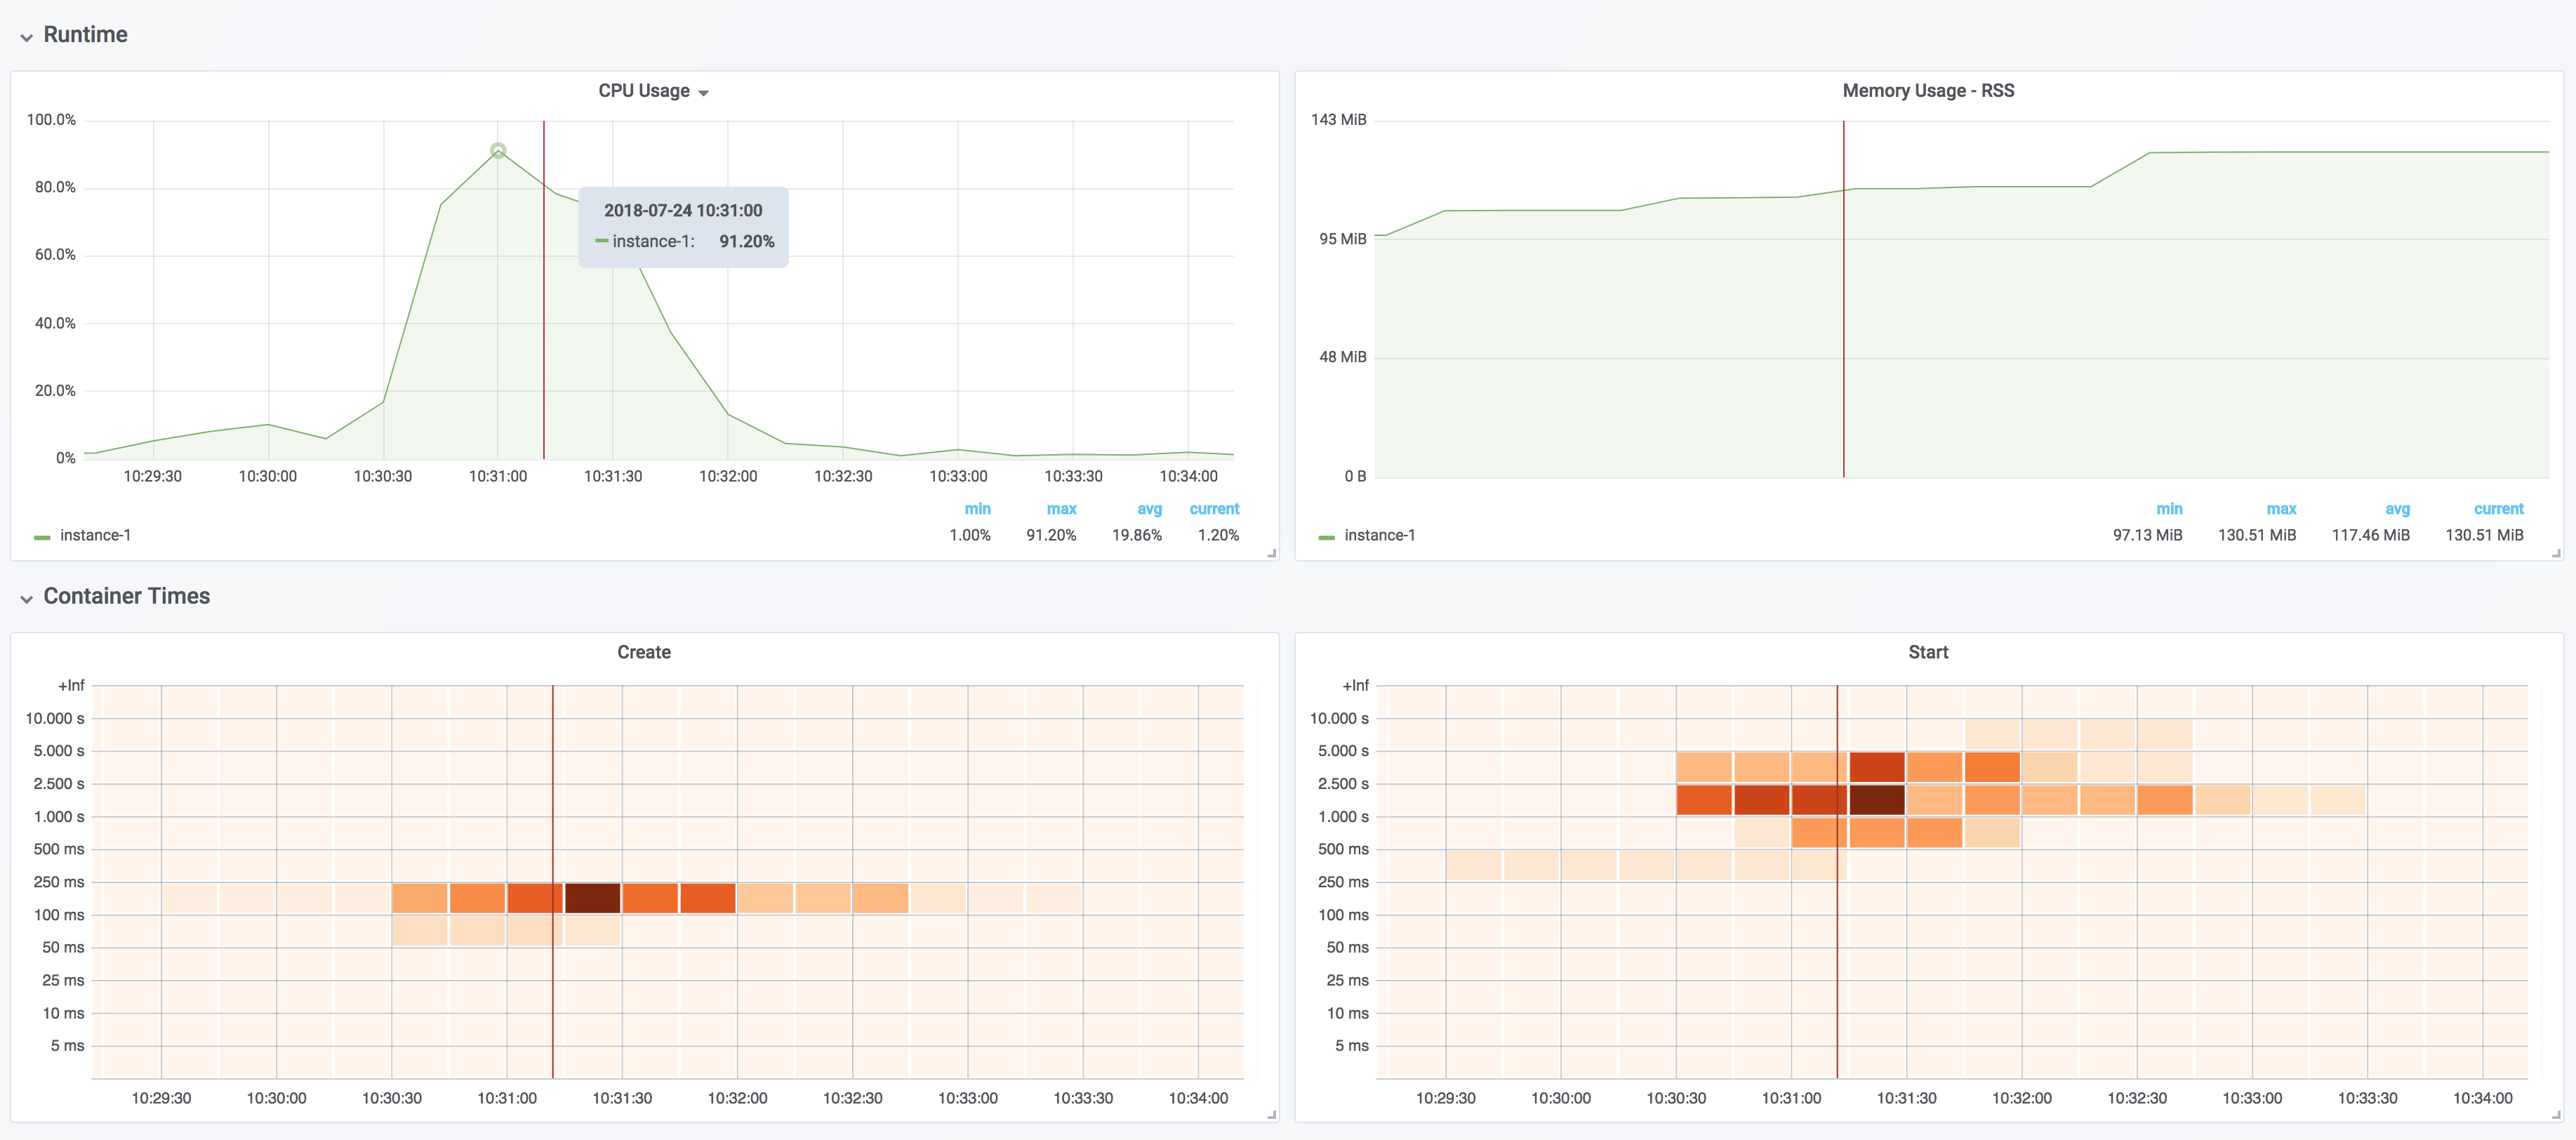
An example of how to make use of [Prometheus](https://prometheus.io/), [Grafana](https://grafana.com/) and [Docker daemon metrics](https://docs.docker.com/config/thirdparty/prometheus/) to graph Docker daemon statistics.
### Usage
```sh
make run # builds grafana and prometheus
# images and initializes all three containers
# that forms the infra (grafana, prometheus and
# node_exporter).
make update-dashboards # updates the list of json files that represent
# the dashboards configured in Grafana.
```
### More
See:
- [Initializing Grafana with preconfigured dashboards](https://ops.tips/blog/initialize-grafana-with-preconfigured-dashboards/).