Ecosyste.ms: Awesome
An open API service indexing awesome lists of open source software.
https://github.com/clinical-meteor/nvd3-statistics-meteor-blaze
D3 statistics demo using Meteor Classic.
https://github.com/clinical-meteor/nvd3-statistics-meteor-blaze
Last synced: about 1 month ago
JSON representation
D3 statistics demo using Meteor Classic.
- Host: GitHub
- URL: https://github.com/clinical-meteor/nvd3-statistics-meteor-blaze
- Owner: clinical-meteor
- Created: 2016-08-28T00:07:49.000Z (over 8 years ago)
- Default Branch: master
- Last Pushed: 2016-11-02T21:11:25.000Z (about 8 years ago)
- Last Synced: 2024-10-29T16:57:46.914Z (2 months ago)
- Language: JavaScript
- Size: 889 KB
- Stars: 1
- Watchers: 2
- Forks: 0
- Open Issues: 1
-
Metadata Files:
- Readme: readme.md
Awesome Lists containing this project
README
## NVD3 Statistics Demo for Meteor
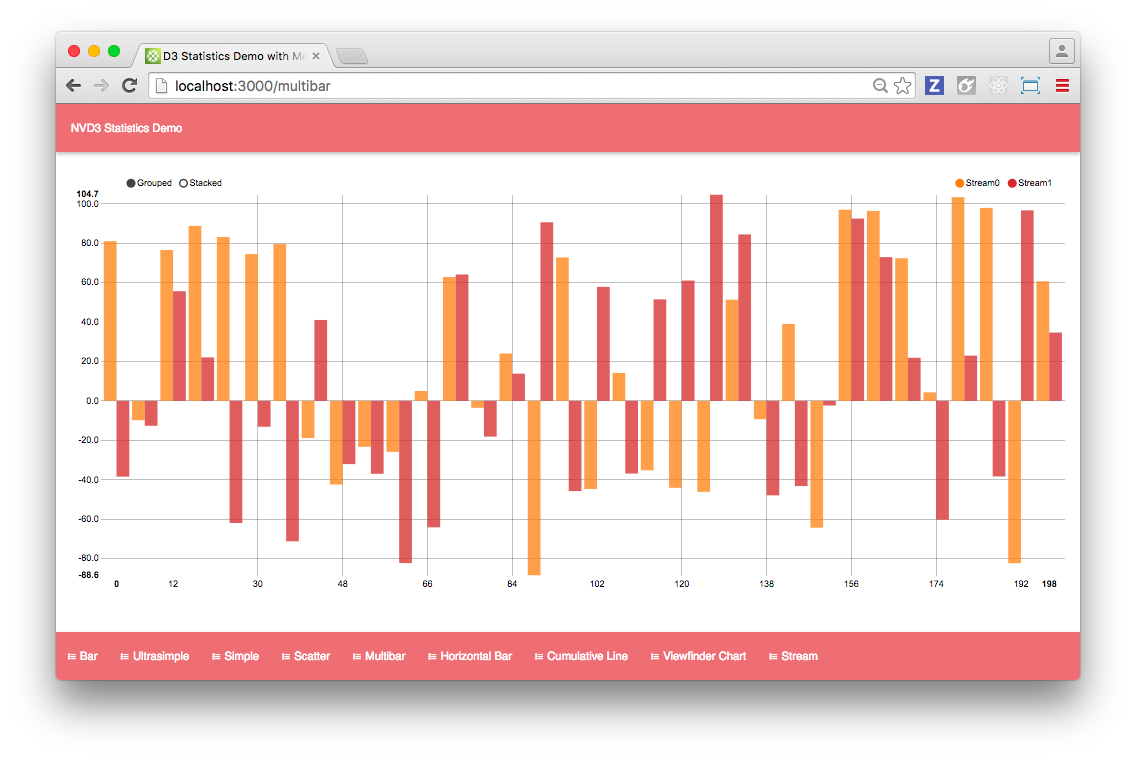
Statistics demo for the Clinical Meteor distro, utilizing Meteor (Blaze, Node, Mongo) and NVD3 graphing library. The graphs are database driven; so if you edit entries in the database, they'll automatically update in the user interface!

=====================================================
#### Installation
```sh
git clone https://github.com/clinical-meteor/nvd3-statistics-meteor-blaze
cd nvd3-statistics-meteor-blaze
meteor
```
=====================================================
#### Connecting to an External Database
```sh
MONGO_URL=mongodb://server:port/database meteor
```
=====================================================
#### Database Schemas
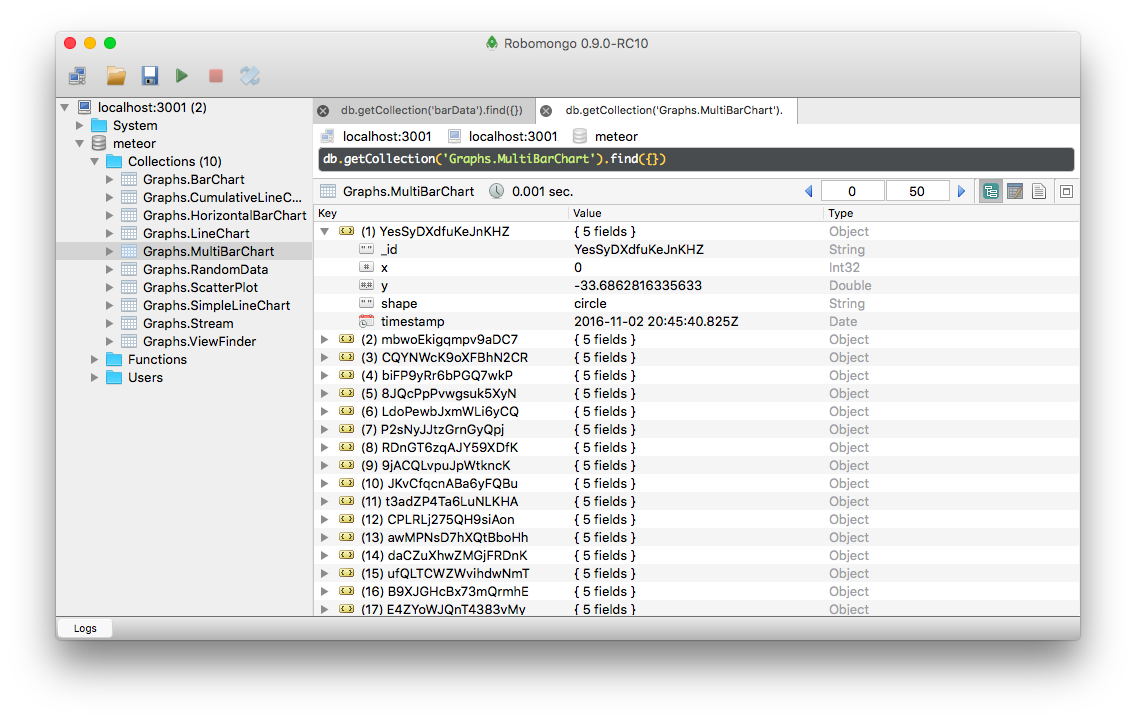
When you startup the app, a number of collections will be initialized in a Mongo database, and publications/subscriptions will be created to send the data to the client.

Most of the graphs simply need a collection of `{x,y}` coordinate pairs to display correctly. Some of them will be looking for additional information, such as shape, series, color, timestamp, etc.
```js
// Graphs.CumulativeLineChart
{
0: {
type: String
},
1: {
type: Double
}
}
// Graphs.HorizontalBarChart
{
x: {
type: Number
},
y: {
type: Number
},
label: {
type: String
},
series: {
type: String
}
}
// Graphs.LineChart
{
x: {
type: Number
},
y: {
type: Number
}
}
// Graphs.MultiBarChart
{
x: {
type: Number
},
y: {
type: Number
},
shape: {
type: String
}
}
// Graphs.RandomData
{
x: {
type: Number
},
y: {
type: Number
},
size: {
type: String
},
shape: {
type: String
},
timestamp: {
type: Date
}
}
// Graphs.ScatterPlot
{
x: {
type: Number
},
y: {
type: Number
},
size: {
type: String
},
shape: {
type: String
}
}
// Graphs.SimpleLineChart
{
x: {
type: Number
},
y: {
type: Number
}
}
// Graphs.Stream
{
0: {
type: String
},
1: {
type: Double
}
}
// Graphs.ViewFinder
{
x: {
type: Number
},
y: {
type: Number
}
}
```
=====================================================
#### Licensing
