https://github.com/clugen/pyclugen
Multidimensional cluster generation in Python
https://github.com/clugen/pyclugen
multidimensional-clusters multidimensional-data python python-library python3-library synthetic-clusters synthetic-data-generator synthetic-dataset-generation
Last synced: 9 months ago
JSON representation
Multidimensional cluster generation in Python
- Host: GitHub
- URL: https://github.com/clugen/pyclugen
- Owner: clugen
- License: mit
- Created: 2020-08-22T19:52:09.000Z (almost 6 years ago)
- Default Branch: main
- Last Pushed: 2025-07-01T19:34:55.000Z (about 1 year ago)
- Last Synced: 2025-07-01T19:40:55.322Z (about 1 year ago)
- Topics: multidimensional-clusters, multidimensional-data, python, python-library, python3-library, synthetic-clusters, synthetic-data-generator, synthetic-dataset-generation
- Language: Python
- Homepage: https://clugen.github.io/pyclugen/
- Size: 21 MB
- Stars: 9
- Watchers: 1
- Forks: 0
- Open Issues: 0
-
Metadata Files:
- Readme: README.md
- License: LICENSE.txt
- Citation: CITATION.cff
Awesome Lists containing this project
- fucking-awesome-machine-learning - pyclugen - Multidimensional cluster generation in Python. (Python / General-Purpose Machine Learning)
- awesome-machine-learning - pyclugen - Multidimensional cluster generation in Python. (Python / General-Purpose Machine Learning)
README
[](https://github.com/clugen/pyclugen/actions/workflows/tests.yml)
[](https://codecov.io/gh/clugen/pyclugen)
[](https://clugen.github.io/pyclugen/)
[](https://pypi.org/project/pyclugen/)

[](https://tldrlegal.com/license/mit-license)
# pyclugen
**pyclugen** is a Python implementation of the *clugen* algorithm for
generating multidimensional clusters with arbitrary distributions. Each cluster
is supported by a line segment, the position, orientation and length of which
guide where the respective points are placed.
See the [documentation](https://clugen.github.io/pyclugen/) and
[examples](https://clugen.github.io/pyclugen/generated/gallery/) for more
details.
## Installation
Install from PyPI:
```sh
pip install --upgrade pip
pip install pyclugen
```
Or directly from GitHub:
```text
pip install --upgrade pip
pip install git+https://github.com/clugen/pyclugen.git#egg=pyclugen
```
## Quick start
```python
from pyclugen import clugen
import matplotlib.pyplot as plt
```
```python
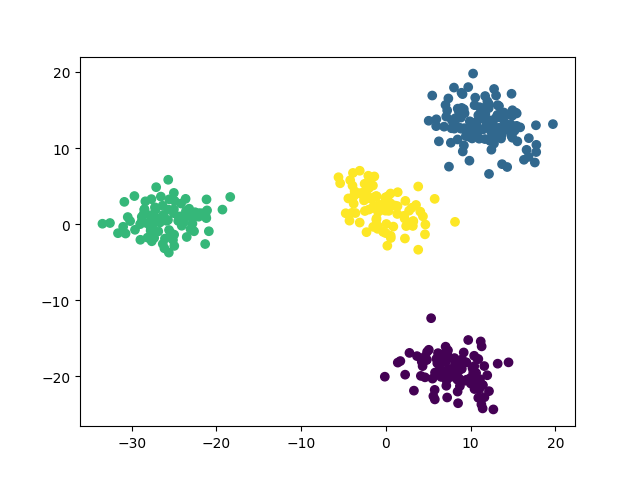
out2 = clugen(2, 4, 400, [1, 0], 0.4, [50, 10], 20, 1, 2)
plt.scatter(out2.points[:, 0], out2.points[:, 1], c=out2.clusters)
plt.show()
```
```python
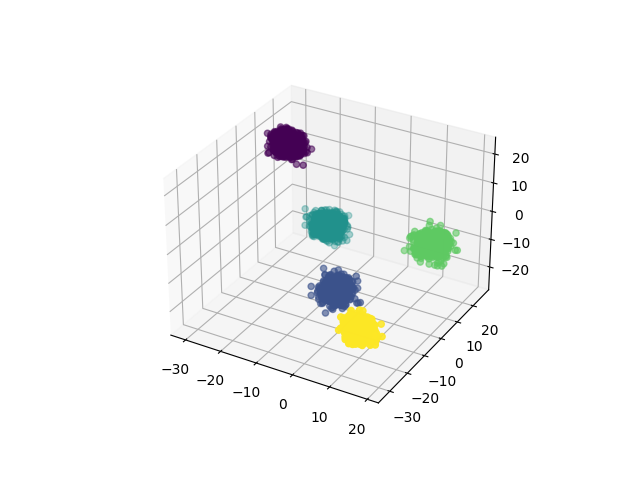
out3 = clugen(3, 5, 10000, [0.5, 0.5, 0.5], 0.2, [10, 10, 10], 10, 1, 2)
fig = plt.figure()
ax = fig.add_subplot(projection="3d")
ax.scatter(out3.points[:, 0], out3.points[:, 1], out3.points[:, 2], c=out3.clusters)
plt.show()
```
## See also
* [CluGen.jl](https://github.com/clugen/CluGen.jl/), a Julia implementation of
the *clugen* algorithm.
* [clugenr](https://github.com/clugen/clugenr/), an R implementation
of the *clugen* algorithm.
* [MOCluGen](https://github.com/clugen/MOCluGen/), a MATLAB/Octave
implementation of the *clugen* algorithm.
## Reference
If you use this software, please cite the following reference:
* Fachada, N. & de Andrade, D. (2023). Generating multidimensional clusters
with support lines. *Knowledge-Based Systems*, 277, 110836.
([arXiv preprint](https://doi.org/10.48550/arXiv.2301.10327))
## License
[MIT License](LICENSE.txt)