https://github.com/cnelias/dcca.jl
Julia module for Detrended Cross-Correlation Analysis.
https://github.com/cnelias/dcca.jl
cross-correlation dcca-coefficient julia time-series-analysis
Last synced: 19 days ago
JSON representation
Julia module for Detrended Cross-Correlation Analysis.
- Host: GitHub
- URL: https://github.com/cnelias/dcca.jl
- Owner: CNelias
- Created: 2018-06-18T15:42:44.000Z (almost 7 years ago)
- Default Branch: master
- Last Pushed: 2022-05-06T10:06:07.000Z (almost 3 years ago)
- Last Synced: 2025-03-28T22:34:42.998Z (about 1 month ago)
- Topics: cross-correlation, dcca-coefficient, julia, time-series-analysis
- Language: Julia
- Homepage:
- Size: 179 KB
- Stars: 8
- Watchers: 1
- Forks: 3
- Open Issues: 0
-
Metadata Files:
- Readme: README.md
Awesome Lists containing this project
README
Detrended Cross-Correlation Analysis
=================================================
A module to perform **DCCA coefficients** analysis. The coefficient ```rho``` describes the **correlation strength** between two **time-series** depending on **time scales**. It lies in [-1, 1], 1 being perfect correlations, and -1 perfect anticorrelations.\
The package provides also functions returning a 95% confidence interval for the null-hypothesis (= "no-correlations").
**Travis**
:--------:
[](https://travis-ci.com/johncwok/DCCA.jl)
The implementation is based on
Zebende G, Et al. *DCCA cross-correlation coefficient differentiation: Theoretical and practical approaches* (2013), and was tested by reproducing the results of _DCCA and DMCA correlations of cryptocurrency markets_ (2020) from Paulo Ferreira, et al.
## Perform a DCCA coefficients computation:
To compute DCCA coefficients, call the ```rhoDCCA``` function like: ```pts, rho = rhoDCCA(timeSeries1, timeSeries2)```. It has the following parameters:
```Julia
rhoDCCA(timeSeries1, timeSeries2; box_start = 3, box_stop = div(length(series1),10), nb_pts = 30, order = 1)
```
**Input arguments**:
* **timeSeries1, timeSeries2** ([Array{Float64,1}](https://docs.julialang.org/en/v1/base/arrays/)): Time series to analyse, need to be of the **same length**.
* **box_start, box_stop** ([Int](https://docs.julialang.org/en/v1/manual/integers-and-floating-point-numbers/)): Start and end point of the analysis. defaults respectively to 3 (the minimal possible time-scale) and 1/10th of the data length (passed this size the variance gets large).
* **nb_pts** ([Int](https://docs.julialang.org/en/v1/manual/integers-and-floating-point-numbers/)): Number of points to carry the analysis onto. mostly relevant for plotting.
* **order** ([Int](https://docs.julialang.org/en/v1/manual/integers-and-floating-point-numbers/)): Order of the polynomial to use for detrending. If not given, defaults to 1 (linear detrending). If `order` is too high, overfitting can happen, impacting the results.
**Returns**:
* **pts** ([Array{Int,1}](https://docs.julialang.org/en/v1/base/arrays/)): List of points (time-scales) where the analysis is carried out.
* **rho** ([Array{Float64,1}](https://docs.julialang.org/en/v1/base/arrays/)): Value of the DCCA coefficient at each points in ```pts```.
## Get the 95% confidence interval
As a rule of thumb : values of ```rho``` in [-0.1,0.1] usually aren't significant.
The confidence intervals provided by this package correspond to the **null-hypothesis** i.e **no correlations**. If ```rho``` gets **outside** of this interval it can be considered **significant**.
To get a fast estimation of the confidence interval, call the ```empirical_CI``` function like: ```pts, ci = empirical_CI(dataLength)```.
For a more accurate estimation, you can call ```bootstrap_CI```: ```pts, ci = bootstrap_CI(timeSeries1, timeSeries2; iterations = 200)```. This operation can be much more demanding (a few minutes). The ```iterations``` argument controls the number of repetitions for the bootstrap procedure, the higher the value, the smoother and cleaner the estimation will be, but it will also take longer.
## Example of simple analysis:
Calling the DCCA function with random white noise
```julia
julia> ts1 = rand(2000)
ts2 = rand(2000)
x, y = rhoDCCA(ts1, ts2)
pts, ci = empirical_CI(length(ts1))
```
Gave the following plot :
```julia
a = scatter(x,y, markersize = 7, xscale = :log, title = "Example of DCCA analysis : \n Correlations between two white noise time series", label = "rho coefficients", xlabel = "window sizes", ylabel = "Correlation strengh")
plot!(a,pts,ci, color = "red", linestyle = :dot, label = "limits of null-hypothesis")
plot!(a,pts,-ci, color = "red", linestyle = :dot, label = "")
display(a)
```
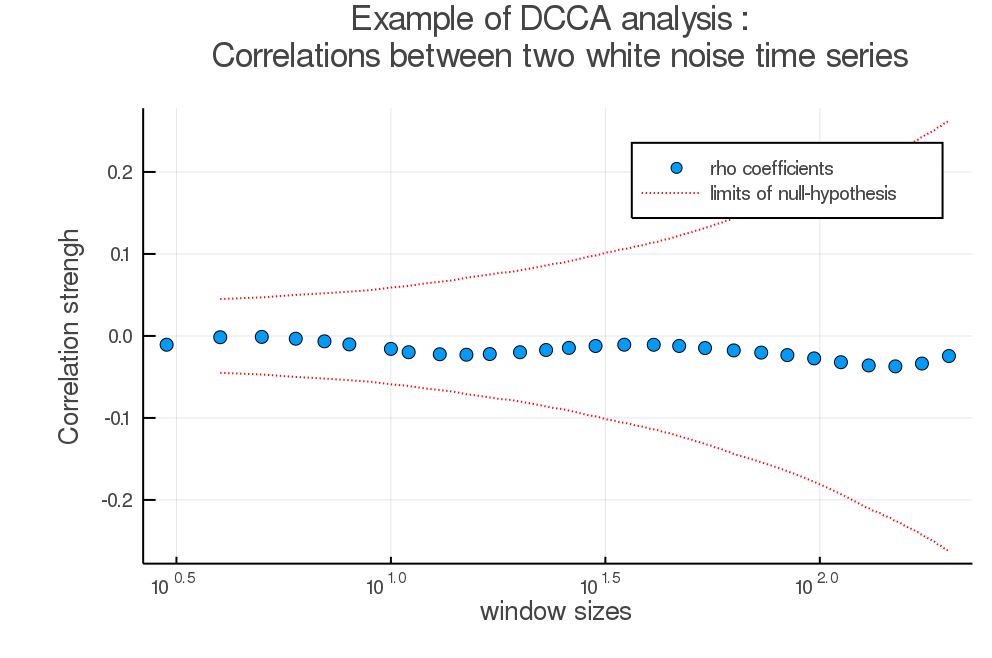
As noted previously, the value here lies in [-0.1,0.1] although we took here 2 series of white uncorrelated noise.
## Installation:
```julia
julia> Using Pkg
Pkg.add("DCCA")
```
## To-do:
- implement spline detrending?