https://github.com/contreau/mcscrape
A web scraping data science project that sought to find correlation between low per capita income and number of McDonald's restaurants across Massachusetts.
https://github.com/contreau/mcscrape
data-science jupyter-notebook python
Last synced: about 2 months ago
JSON representation
A web scraping data science project that sought to find correlation between low per capita income and number of McDonald's restaurants across Massachusetts.
- Host: GitHub
- URL: https://github.com/contreau/mcscrape
- Owner: contreau
- Created: 2022-04-01T16:51:34.000Z (over 4 years ago)
- Default Branch: main
- Last Pushed: 2022-09-11T04:59:25.000Z (almost 4 years ago)
- Last Synced: 2025-07-09T04:04:47.372Z (about 1 year ago)
- Topics: data-science, jupyter-notebook, python
- Language: Jupyter Notebook
- Homepage:
- Size: 429 KB
- Stars: 1
- Watchers: 1
- Forks: 0
- Open Issues: 0
-
Metadata Files:
- Readme: README.md
Awesome Lists containing this project
README
# McScrape
Food deserts – geographical areas with limited access to nutritious food, typically found in lower income areas or neighborhoods – persist throughout much of America. A large presence of fast food restaurants can be indicative of a food desert, and the most common low nutrition fast food restaurant in America is McDonald’s. This project sought to find the connection between low per capita income counties in Massachusetts and the number of McDonald’s in each county. I looked to answer two questions:
• In which Massachusetts counties are there the greatest number of McDonald’s restaurants?
• Is there a correlation between a high number of McDonald’s restaurants and low per capita income by county?
### Tools
• Python, Pandas, NumPy, Seaborn, Matplotlib (all code in a Jupyter notebook)
• Postman API Platform
## Methodology
The primary site of interest for this project was the publicly available [McDonald’s store locator](https://www.mcdonalds.com/us/en-us/restaurant-locator.html). Upon inspecting it, I determined I wouldn’t be able to parse HTML to get the restaurant data I wanted, as restaurant search results are generated dynamically based on a location and distance range the user inputs. With help from the [Postman API Platform](https://www.postman.com/), I made GET requests to the application, choosing one location as a base point and then specifying as big a location range as possible and to collect as many restaurants as possible in the specified range - but it limited us to 250 restaurants at a time, many of which bled over state lines.
This data was returned to us in JSON format. To cover all of Massachusetts, I made GET requests regionally for Eastern, Central, and Western MA. I heavily overshot the true number of restaurants by doing this, but this was the most intuitive approach and allowed us to cut down rather than worry about not scraping enough data. Many restaurants in the initial data collection were in New Hampshire, Connecticut, and New York, so I inspected the JSON data to see how to target the ‘subDivision’ (state) key-value pair with my own code to filter out only the MA restaurants. Postman helpfully generated a bit of Python code to make these specific GET requests from a CoLab notebook, where I could then more easily access and interact with the raw JSON data for each call.
From there, I wrote a Python function to filter out all of the MA restaurants in each region, making for each region a list containing dictionaries for each restaurant in that region. Each dictionary contains street address, city, postal code, and state key-value pairs. After each region was filtered by state, I combined the lists and wrote another function to iterate through to remove duplicates, distilling my final restaurant count and complete list of McDonald’s restaurants (with the mentioned above attributes) to 234. I made this into a DataFrame.
To determine the restaurant count by county, I first created an initial list of all restaurant zip codes by slicing the zip code column of my DataFrame. I then collected the specific zip codes for each county by just looking them up, and then wrote a function taking the restaurant zip codes and county zip codes as parameters, which gave us for each county its restaurant count and its list of zip codes as dictionary key-value pairs. At this point, I have a second DataFrame with restaurant count by county.
For per capita income (PCI) data, I downloaded a .csv file from the U.S. Census Bureau containing the most recent PCI data for each Massachusetts county. After putting that data into its own DataFrame, I converted the data types for the income amounts from objects to integers, and then joined that DataFrame with the previous one to produce my final, compiled DataFrame containing county indices with restaurant count and PCI per county. I calculated a correlation coefficient and produced visualizations of all significant findings, as explained below.
## Results
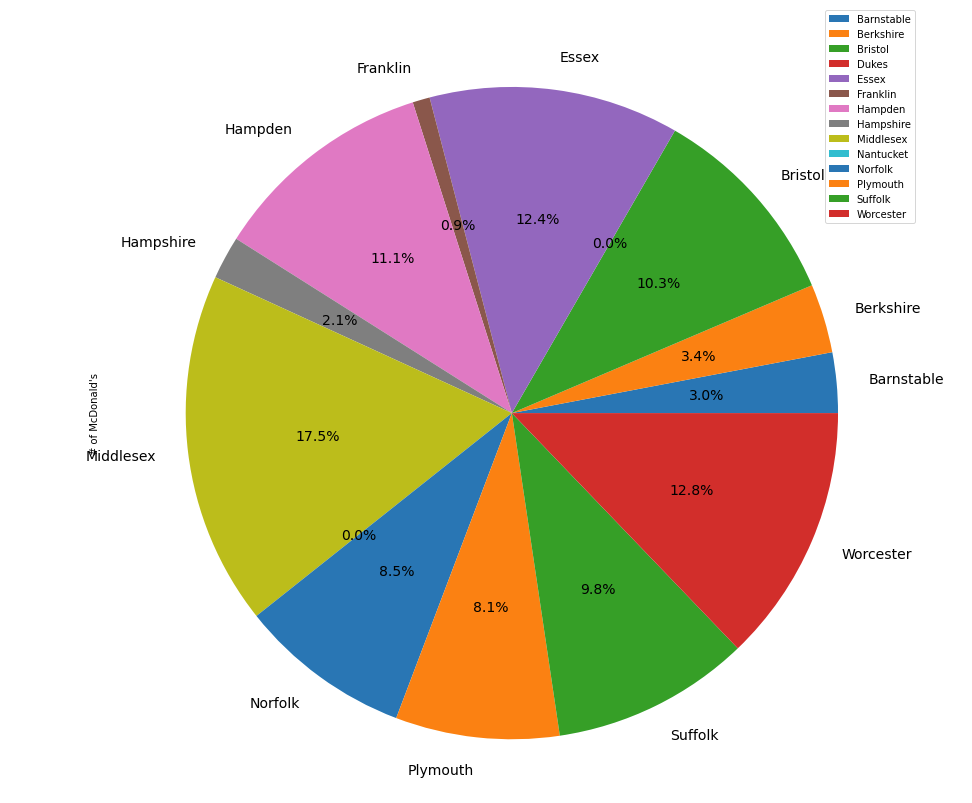
I distilled 234 unique McDonald's locations in Massachusetts. Furthermore, Middlesex County has the most McDonald’s in the state at 41, or 17.5% of all McDonald’s in the state, followed by Worcester with 30 locations, or 12.8% of locations in the state. Nantucket and Dukes Counties have the fewest locations, at zero. The percentage of McDonald’s locations in the state by county is shown in the Pandas pie chart visualization below:
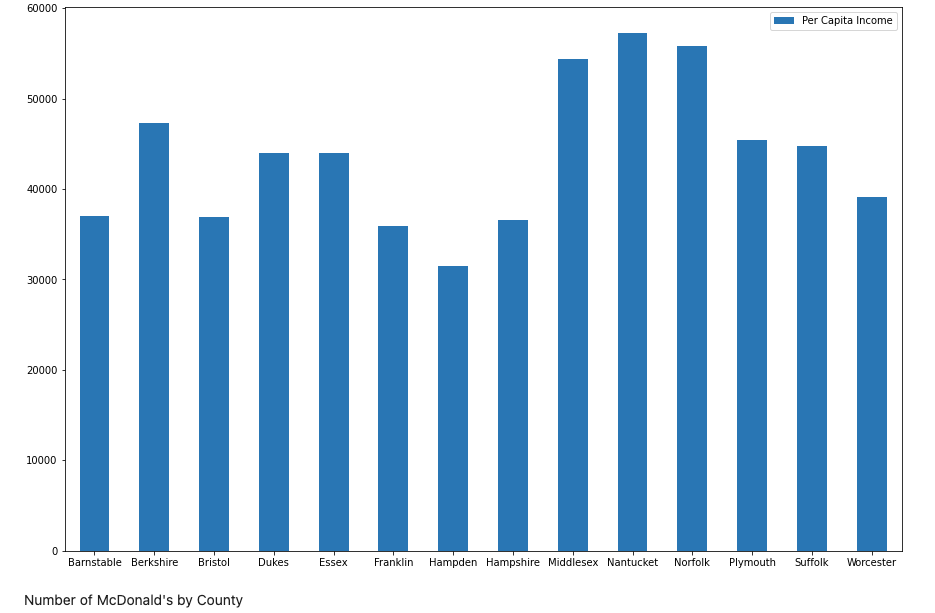
Complete visualization of per capita income data is shown below:
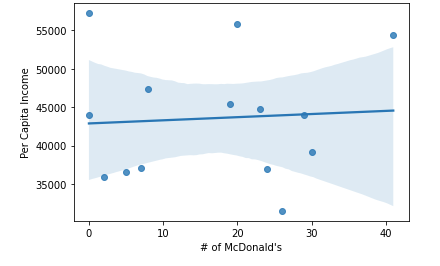
The correlation coefficient for the number of McDonald’s and per capita income was .066, shown below as calculated with Pandas. Below it is a correlation regression plot visualized with the seaborn library:
## Conclusions
I conclude that in Massachusetts there is a weak positive correlation between the amount of McDonald’s restaurants in a given county and its per capita income. This cannot be considered statistically significant. When plotted the points are quite scattered, showing no accurate line of best fit. Both of my research questions were satisfied, most notably my second question – I sought to answer if the lower the per capita income the greater the amount of McDonald’s in a county, however, according to my findings this is not the case.