https://github.com/covdbg/vscode-covdbg
The official covdbg extension for Visual Studio Code
https://github.com/covdbg/vscode-covdbg
coverage coverage-report vscode-extension
Last synced: 2 months ago
JSON representation
The official covdbg extension for Visual Studio Code
- Host: GitHub
- URL: https://github.com/covdbg/vscode-covdbg
- Owner: covdbg
- License: apache-2.0
- Created: 2026-03-18T19:02:06.000Z (3 months ago)
- Default Branch: main
- Last Pushed: 2026-04-08T23:30:19.000Z (2 months ago)
- Last Synced: 2026-04-09T00:17:44.465Z (2 months ago)
- Topics: coverage, coverage-report, vscode-extension
- Language: TypeScript
- Homepage: https://covdbg.com
- Size: 188 KB
- Stars: 1
- Watchers: 0
- Forks: 0
- Open Issues: 1
-
Metadata Files:
- Readme: README.md
- Changelog: CHANGELOG.md
- License: LICENSE
Awesome Lists containing this project
README
# covdbg for VS Code
Native Windows C++ coverage, directly in VS Code.
Run your executables with coverage, inspect covered and uncovered lines in the editor, open a detailed report, and rerun discovered test binaries from the Testing view. The extension bundles the covdbg runtime for a smoother setup on Windows.
[Get started with covdbg](https://covdbg.com/) | [Product docs and guides](https://covdbg.com/docs/)
## AI Features
covdbg can also expose native coverage data to chat-capable tooling in VS Code.
- `covdbg_run` runs one or more real test executables with coverage, produces a merged workspace result when multiple executables are used, reloads that result into the extension, and returns structured status plus next-step guidance.
- If `covdbg.runner.analyzeInputs` is configured, the extension also runs `covdbg analyze` on those binaries and merges the resulting baseline symbol databases into the active workspace result so uncovered-but-never-executed code still shows up.
- `covdbg_explore` is the workspace-environment discovery entry point for LLMs. It reports where discovered test binaries are, where `.covdbg.yaml` is configured or resolved, where coverage databases are located, and which runtime and runner paths are active.
- `covdbg_files` lists currently uncovered files from the active loaded workspace coverage result, sorted to help an LLM choose the next file to inspect.
- `covdbg_code` returns grouped uncovered code segments for a source file, including code snippets, nearby context, file metadata, coverage summary, truncation metadata, and workflow guidance for follow-up actions.
These tools are designed for iterative workflows where an LLM proposes a fix, you rebuild real test binaries, rerun coverage, and then query the updated uncovered regions again.
### AI Workflow Rules
- Pass real built test executable paths to `covdbg_run`. Do not invent a synthetic aggregate executable such as `all_tests` unless that executable actually exists in the workspace.
- Do not pass `.covdb` paths back into the LLM workflow. The extension generates, merges, loads, and switches the active coverage result automatically.
- After coverage is loaded, inspect candidate files with `covdbg_files`, then pass only a source file path to `covdbg_code`. The extension resolves that query against the currently loaded workspace coverage result, including the merged batch result when applicable.
### Example Tool Sequence
Run one or more real test executables and let the extension merge coverage automatically:
```json
{
"tool": "covdbg_run",
"input": {
"executablePaths": [
"build/tests-suite1.exe",
"build/tests-suite2.exe"
]
}
}
```
Ask the extension where covdbg resources are located in the current workspace:
```json
{
"tool": "covdbg_explore",
"input": {
"workspaceRoot": "D:/repo",
"limit": 10
}
}
```
Ask the extension which files are still uncovered in the active merged workspace result:
```json
{
"tool": "covdbg_files",
"input": {
"limit": 10,
"maxCoveragePercent": 80
}
}
```
Inspect a specific source file from that active workspace result:
```json
{
"tool": "covdbg_code",
"input": {
"filePath": "src/widget.cpp"
}
}
```
The intended loop is: build real test executables, run coverage, let the extension load the merged workspace result, inspect uncovered files, fix code, rebuild, and rerun coverage.
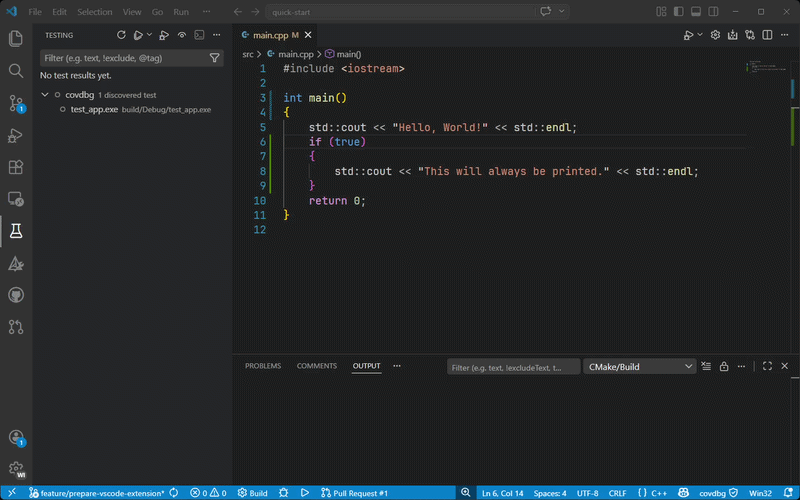
## See Coverage In VS Code
covdbg brings the full coverage workflow into the editor: launch a target, reload results automatically, review inline highlights, and drill into file, folder, and function details without bouncing between separate tools.
### Scope coverage with `.covdbg.yaml`
Choose the test executable from covdbg's discovered binaries, then use `.covdbg.yaml` to decide what should actually count in the report. This config is where you include or exclude files and functions for that run and where you keep third-party code, SDKs, vendored dependencies, and helper-only test code out of your numbers.
```yaml
version: 1
source_root: "."
coverage:
default:
files:
include:
- "**/*.cpp"
- "**/*.h"
exclude:
- "tests/helpers/**"
- "third_party/**"
- "external/**"
- "vendor/**"
- "**/Windows Kits/**"
- "**/VC/Tools/MSVC/**"
functions:
include:
- "*"
exclude:
- "__scrt_*"
- "_RTC_*"
- "__security_*"
```
Use `covdbg: Create .covdbg.yaml` to generate a starter config in the workspace and tailor it to your binaries, test layout, and dependency boundaries.
## Why covdbg
Getting useful coverage for native Windows C++ is usually more work than it should be. covdbg is built to make that workflow practical:
- Use your existing Windows binaries and debug symbols.
- Avoid compiler-specific instrumentation workflows and extra build-system churn.
- Review coverage where you already edit and debug.
- Move from a single run to actionable file and function detail quickly.
- Keep coverage local to your machine and workspace.
## What You Get In The Extension
### Run coverage without leaving the editor
Choose a target executable, start a coverage run from VS Code, and let the extension reload the latest result automatically.
### Inline coverage that stays close to the code
Show covered and uncovered lines with gutter markers, line highlights, or both, so gaps are visible while you work.
### Interactive report for deeper inspection
Open a report with file and folder summaries, per-file statistics, and function-level detail when you want more than a line overlay.
### Testing UI integration
Discover likely test binaries in your workspace and rerun them with coverage from the built-in Testing view.
### AI-assisted coverage workflows
Use the chat tools to ask for uncovered code in a file, apply a fix, rebuild, run the target again with coverage, and inspect the refreshed gaps without leaving VS Code.
### Sidebar home dashboard
Open the covdbg activity bar item to get a live onboarding and status dashboard for the current workspace: license state, runtime resolution, discovered tests, loaded coverage, config health, and the next actions to take.
### Flexible result loading
Point covdbg at an existing coverage result or let it discover results in your workspace automatically.
## Quick Start
1. Install the extension on Windows.
2. Open your C++ workspace in VS Code.
3. Open the covdbg sidebar to verify runtime, license, config, and target status.
4. Add or generate `.covdbg.yaml` so the report includes the right project files and excludes SDK or third-party noise.
5. Run `covdbg: Run Coverage` and choose from the discovered test binaries.
6. Review coverage inline or open `covdbg: Show Coverage Report`.
If you already have a coverage result, use `covdbg: Select .covdb File...` and start browsing immediately.
The covdbg status bar entry is always available after startup. If no `.covdbg.yaml` is present yet, the extension can offer to create one for you.
## Typical Workflows
### Run a native test binary with coverage
Run `covdbg: Run Coverage`, choose a discovered test executable, and optionally use `covdbg.runner.targetArgs` for extra arguments.
### Include uncovered lines from app binaries
Set `covdbg.runner.analyzeInputs` to one or more workspace-relative or absolute binary paths when you want a default baseline for every test target in the workspace.
If different test executables need different baselines, use `covdbg.runner.analyzeInputsByTarget` instead. Each key can be an exact executable path, a basename such as `ui-tests.exe`, or a glob such as `build/**/integration-tests.exe`. The value is the list of binaries to analyze for that test target. Use an empty array to explicitly disable baseline analysis for a matching test executable even when the global default is set.
The extension resolves target-specific rules first and falls back to `covdbg.runner.analyzeInputs` when no rule matches.
```json
{
"covdbg.runner.analyzeInputs": [
"build/app.exe"
],
"covdbg.runner.analyzeInputsByTarget": {
"build/ui-tests.exe": [
"build/app-ui.exe"
],
"build/unit-tests.exe": [],
"**/integration-tests.exe": [
"build/app.exe",
"build/plugin-host.exe"
]
}
}
```
### Rerun discovered tests from the Testing view
Use `covdbg: Refresh Test Binaries` to discover likely test executables and run them with coverage from the Test Explorer.
### Open and inspect an existing result
Use `covdbg: Select .covdb File...` or set `covdbg.covdbPath` to load an existing result for inline review and reporting.
## Commands
| Command | Description |
|---------|-------------|
| `covdbg: Open Menu` | Open the main covdbg action menu. |
| `covdbg: Toggle Coverage Display` | Show or hide inline coverage decorations. |
| `covdbg: Show Coverage Report` | Open the interactive HTML coverage report. |
| `covdbg: Browse Covered Files` | Jump to files that have coverage data. |
| `covdbg: Set Render Mode` | Switch between line, gutter, or combined rendering. |
| `covdbg: Select .covdb File...` | Load a specific coverage result manually. |
| `covdbg: Run Coverage` | Run a discovered test executable with coverage. |
| `covdbg: Create .covdbg.yaml` | Create a starter `.covdbg.yaml` in a workspace folder. |
| `covdbg: Clear Last Run Result` | Clear the last generated run result from the current workflow. |
| `covdbg: Refresh Test Binaries` | Refresh executable discovery for the Testing UI. |
## Key Settings
| Setting | Purpose |
|---------|---------|
| `covdbg.runner.targetArgs` | Arguments passed to the target executable. |
| `covdbg.runner.analyzeInputs` | Default binaries to analyze and merge into the final workspace result as uncovered baseline coverage. |
| `covdbg.runner.analyzeInputsByTarget` | Optional per-test-target analyze rules that override the default baseline for specific executables. |
| `covdbg.runner.workingDirectory` | Working directory for coverage runs. |
| `covdbg.runner.outputPath` | Output path for results generated from VS Code. |
| `covdbg.runner.binaryDiscoveryPattern` | Pattern used to discover test binaries for the Testing UI. |
| `covdbg.covdbPath` | Load a specific existing coverage result. |
| `covdbg.discoveryPattern` | Pattern used to discover coverage results automatically. |
| `covdbg.renderMode` | Choose line, gutter, or both. |
| `covdbg.showExternalFiles` | Include files outside the workspace in results. |
## Learn More
- Product site: [covdbg.com](https://covdbg.com/)
- Documentation: [covdbg.com/docs](https://covdbg.com/docs/)
- Development guide: [DEVELOPMENT.md](https://github.com/covdbg/vscode-covdbg/blob/main/DEVELOPMENT.md)
- Release notes: [CHANGELOG.md](https://github.com/covdbg/vscode-covdbg/blob/main/CHANGELOG.md)