https://github.com/cphyc/matplotlib-label-lines
Label line using matplotlib.
https://github.com/cphyc/matplotlib-label-lines
Last synced: about 1 year ago
JSON representation
Label line using matplotlib.
- Host: GitHub
- URL: https://github.com/cphyc/matplotlib-label-lines
- Owner: cphyc
- License: mit
- Created: 2017-03-13T09:13:08.000Z (over 9 years ago)
- Default Branch: main
- Last Pushed: 2025-05-05T19:28:42.000Z (about 1 year ago)
- Last Synced: 2025-05-05T20:40:26.491Z (about 1 year ago)
- Language: Jupyter Notebook
- Size: 7.31 MB
- Stars: 315
- Watchers: 6
- Forks: 28
- Open Issues: 6
-
Metadata Files:
- Readme: Readme.md
- License: LICENSE
Awesome Lists containing this project
README
# matplotlib-label-lines
[](https://github.com/cphyc/matplotlib-label-lines/actions/workflows/pytest.yml)
[](https://pypi.org/project/matplotlib-label-lines/)
[](https://pypi.org/project/matplotlib-label-lines)
[](https://codecov.io/gh/cphyc/matplotlib-label-lines)
Easily label line(s) using matplotlib.
The code is heavily based on http://stackoverflow.com/questions/16992038/inline-labels-in-matplotlib (original code from NauticalMile).
## Install
Just do:
```bash
pip install matplotlib-label-lines
```
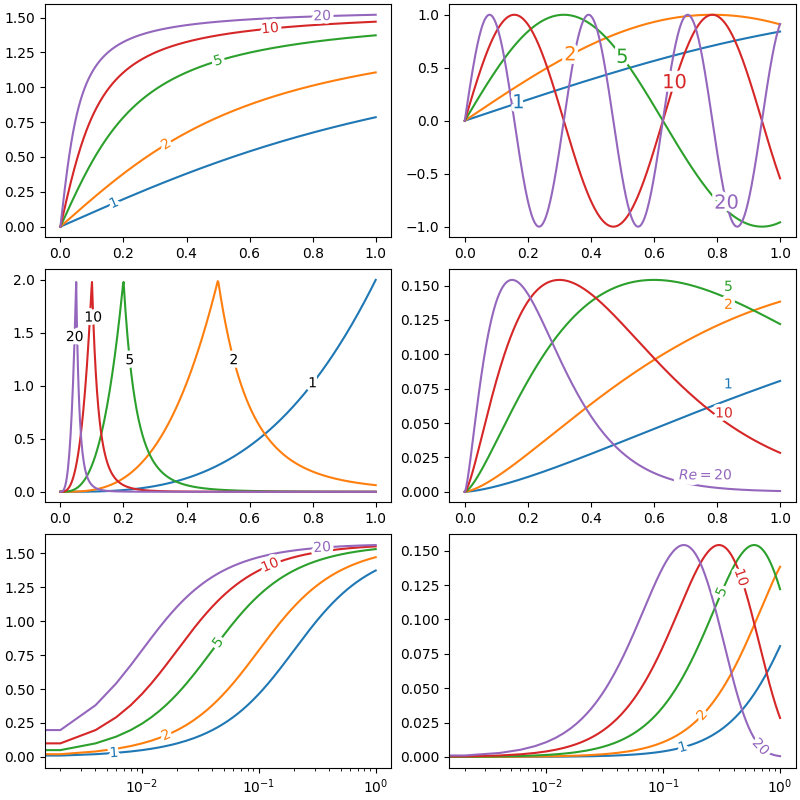
You can try it online on binder [](https://mybinder.org/v2/gh/cphyc/matplotlib-label-lines/master), get some inspiration from [the example](https://github.com/cphyc/matplotlib-label-lines/blob/master/example/matplotlib_label_lines.ipynb) or from the following script:
```python
import numpy as np
from matplotlib import pyplot as plt
from scipy.stats import chi2, loglaplace
from labellines import labelLine, labelLines
X = np.linspace(0, 1, 500)
A = [1, 2, 5, 10, 20]
funcs = [np.arctan, np.sin, loglaplace(4).pdf, chi2(5).pdf]
fig, axes = plt.subplots(ncols=2, nrows=3, constrained_layout=True, figsize=(8, 8))
axes = axes.flatten()
ax = axes[0]
for a in A:
ax.plot(X, np.arctan(a * X), label=str(a))
labelLines(ax.get_lines(), zorder=2.5)
ax = axes[1]
for a in A:
ax.plot(X, np.sin(a * X), label=str(a))
labelLines(ax.get_lines(), align=False, fontsize=14)
ax = axes[2]
for a in A:
ax.plot(X, loglaplace(4).pdf(a * X), label=str(a))
xvals = [0.8, 0.55, 0.22, 0.104, 0.045]
labelLines(ax.get_lines(), align=False, xvals=xvals, color="k")
ax = axes[3]
for a in A:
ax.plot(X, chi2(5).pdf(a * X), label=str(a))
lines = ax.get_lines()
l1 = lines[-1]
labelLine(
l1,
0.85,
label=r"$Re=${}".format(l1.get_label()),
align=False,
yoffset=0.01,
ha="right",
backgroundcolor="none",
)
labelLines(lines[:-1], xvals=0.85, yoffsets=0.01, align=False,
ha="right", backgroundcolor="none")
# labelLines also supports log-scaled x-axes
ax = axes[4]
for a in A:
ax.semilogx(X, np.arctan(5 * a * X), label=str(a))
labelLines(ax.get_lines(), zorder=2.5)
ax = axes[5]
for a in A:
ax.semilogx(X, chi2(5).pdf(a * X), label=str(a))
labelLines(ax.get_lines(), xvals=(0.1, 1), zorder=2.5)
fig.show()
```
# Citing
If you're using this package for research purposes, consider citing the [Zenodo entry (https://zenodo.org/record/7428071)](https://zenodo.org/record/7428071).