https://github.com/cpu/promguard
Prometheus scraping over WireGuard: Example Terraform/Ansible for fully authenticated/encrypted stat scraping
https://github.com/cpu/promguard
ansible metrics prometheus site-to-site terraform vpn wireguard
Last synced: over 1 year ago
JSON representation
Prometheus scraping over WireGuard: Example Terraform/Ansible for fully authenticated/encrypted stat scraping
- Host: GitHub
- URL: https://github.com/cpu/promguard
- Owner: cpu
- Archived: true
- Created: 2018-01-29T00:39:37.000Z (over 8 years ago)
- Default Branch: master
- Last Pushed: 2018-05-02T07:28:43.000Z (about 8 years ago)
- Last Synced: 2025-02-15T22:24:17.182Z (over 1 year ago)
- Topics: ansible, metrics, prometheus, site-to-site, terraform, vpn, wireguard
- Language: HCL
- Homepage:
- Size: 145 KB
- Stars: 27
- Watchers: 7
- Forks: 4
- Open Issues: 0
-
Metadata Files:
- Readme: README.md
Awesome Lists containing this project
README
# PromGuard - Authenticated/Encrypted Prometheus stat scraping over WireGuard
1. [Summary](https://github.com/cpu/PromGuard#summary)
1. [Prerequisites](https://github.com/cpu/PromGuard#prerequisites)
1. [Initial Setup](https://github.com/cpu/PromGuard#initial-setup)
1. [Usage](https://github.com/cpu/PromGuard#usage)
1. [Background](https://github.com/cpu/PromGuard#background)
1. [Implementation](https://github.com/cpu/PromGuard#implementation)
1. [Conclusion](https://github.com/cpu/PromGuard#conclusion)
1. [Example run](https://github.com/cpu/PromGuard#example-run)
## Summary
[Prometheus](https://prometheus.io/) doesn't support authentication/encryption
out of box. Scraping metrics over the capital I internet without is a no-go.
Putting mutually authenticated TLS in front is a hassle.
[WireGuard](http://wireguard.com/) is a next-generation VPN technology likely to
be part of the mainline Linux kernel Soon(TM). It is: simple, fast, effective.
Can we configure Prometheus to scrape stats over WireGuard? Of course. This is
a repository showing an example of this approach using
[Terraform](https://www.terraform.io/) and [Ansible](http://ansible.com/) so
you can easily try it yourself with as little as _one command*_.
`*` - _Not counting installing Terraform & Ansible, and configuring
a DigitalOcean API token! Some limitations apply, batteries not included, offer
not valid in Quebec._
## Demo Prerequisites
1. [Install Ansible](http://docs.ansible.com/ansible/latest/intro_installation.html)
1. [Install Terraform](https://www.terraform.io/intro/getting-started/install.html)
1. [Get a DigitalOcean API key](https://cloud.digitalocean.com/settings/api/tokens)
1. Clone this repo and `cd` into it.
## Initial Setup
1. Create `terraform.tfvars` in the root of the project directory
1. Inside of `terraform.tfvars` put:
```
do_token = "YOUR_DIGITAL_OCEAN_API_KEY_HERE"
do_ssh_key_file = "PATH_TO_YOUR_SSH_PUBLIC_KEY_HERE"
do_ssh_key_name = "A_NAME_TO_ADD_YOUR_SSH_PUBLIC_KEY_UNDER_IDK_PICK_ONE"
```
1. Run `terraform init` to get required plugins
## Demo Usage
1. Run `./run.sh`
1. Follow the instructions at completion to access Prometheus interface on the
monitoring host.
## Background
### Prometheus
[Prometheus](https://prometheus.io/) is "an open-source systems monitoring and
alerting toolkit originally built at SoundCloud". It provides a slick
multi-dimensional time series metrics system exposing a powerful query language.
[LWN](https://lwn.net) recently published a [great introduction to monitoring
with Prometheus](https://lwn.net/Articles/744410/). Much like the author of the
article I've recently transitioned my own systems from [Munin
monitoring](http://munin-monitoring.org/) to Prometheus with great success.
Prometheus is simple and easy to understand. At its core metrics from individual
services/machines are exposed via HTTP at a `/metrics` URL path. These endpoints
are often made available by dedicated programs Prometheus calls "exporters".
Periodically (every 15s by default) the Prometheus server scrapes configured
metrics endpoints ("targets" in Prometheus parlance), collecting the data into
the time series database.
Prometheus makes available a first-party
[`node_exporter`](https://github.com/prometheus/node_exporter) that exposes
typical system stats (disk space, CPU usage, network interface stats, etc) via
a `/metrics` endpoint. This repostiory/example only configures this one exporter
but [others are
available](https://github.com/prometheus/docs/blob/master/content/docs/instrumenting/exporters.md)
and this approach generalizes to them as well.
### Prometheus Authentication/Authorization/Encryption
[Prometheus' own documentation](https://prometheus.io/docs/operating/security/#authentication-authorisation-encryption)
is clear and up-front about the fact that "Prometheus and its components do not
provide any server-side authentication, authorisation or encryption". Alone,
the `node_exporter` has no ability to encrypt the metrics data it provides to a
prometheus scraper, and no way to authenticate that the thing requesting metrics
data is the prometheus scraper you expect. If your Prometheus server is in
Toronto and your nodes are spread out around the world this poses a significant
obstacle to overcome.
The official recommendation is to deploy mutually authenticated TLS with [client
certificates](https://en.wikipedia.org/wiki/Transport_Layer_Security#Client-authenticated_TLS_handshake),
using a reverse proxy. I'm certainly [not adverse to
TLS](https://letsencrypt.org/) but building your own internal PKI, deploying
a dedicated reverse proxy to each host next to the exporter, and configuring
the reverse proxy instances, the exporter instances, and Prometheus for
client authentication is certainly not a walk in the park.
Avoiding the hassle has driven folks to creative (but cumbersome) [SSH based
solutions](https://miek.nl/2016/february/24/monitoring-with-ssh-and-prometheus/)
and, more creatively, [tor hidden services](https://ef.gy/secure-prometheus-ssh-hidden-service).
What if there was.... :sparkles: _A better way_ :sparkles:
### WireGuard
[WireGuard](https://www.wireguard.com/) rules. It's an "extremely
simple yet fast and modern VPN that utilizes state-of-the-art cryptography". The
[white paper](https://www.wireguard.com/papers/wireguard.pdf), originally
published at [NDSS
2017](https://www.ndss-symposium.org/ndss2017/ndss-2017-programme/wireguard-next-generation-kernel-network-tunnel/)
goes into exquisite detail on the protocol and the small, easy to audit, and
performant kernel mode implementation
The tl;dr is that WireGuard lets us create fast, encrypted, authenticated
links between servers. Its implementation is perfectly suited to writing
firewall rules and we can easily work with the standard network interface it
creates. No PKI or certificates required. There's not a single byte of ASN.1 in
sight. It's enough to bring you to tears.
### WireGuard meets Prometheus
If each target machine and Prometheus server has a WireGuard keypair
& interface, then we can configure the target exporters to bind only to the
WireGuard interface. We can also write firewall rules that restrict traffic to
the exporter such that it must arrive over the WireGuard interface and from
the Prometheus server's WireGuard peer IP. The end result is a system that only
allows fully encrypted, fully authenticated access to the exporter stats from
the minimum number of hosts. It also fails closed! If something goes wrong with
the WireGuard configuration the exporter will not be internet accessible - rad!
No extra services, or complex configuration.
### Implementation
Initially I was going to write this as a blog post, but talk is cheap! Running
code is much better. Using Terraform and Ansible makes this a reproducable
demonstration of the idea.
#### Terraform
The Terraform config in
[`promguard.tf`](https://github.com/cpu/PromGuard/blob/master/promguard.tf)
has three main responsibilities:
1. Creating 1 monitor droplet and 3 to-be-monitored node droplets
1. Generating an Ansible inventory
1. Assigning WireGuard IPs to each droplet
There isn't anything especially fancy about item 1. The [`monitor`
droplet](https://github.com/cpu/PromGuard/blob/af52c13d83367f0f049cbb29b5dc73c91270ad93/promguard.tf#L153:L171)
and the `${var.node_count}` individual [`node`
droplets](https://github.com/cpu/PromGuard/blob/af52c13d83367f0f049cbb29b5dc73c91270ad93/promguard.tf#L173:L194)
both use a `remote-exec` provisioner. This ensures the droplets have SSH
available before continuing and also bootstraps the droplets with Python so that
Ansible playbooks can be run.
The [Ansible
inventory](http://docs.ansible.com/ansible/latest/intro_inventory.html) is
generated in three parts. First, for [each to-be-monitored
node](https://github.com/cpu/PromGuard/blob/af52c13d83367f0f049cbb29b5dc73c91270ad93/templates/hostname.tpl),
a inventory line is
[templated](https://github.com/cpu/PromGuard/blob/af52c13d83367f0f049cbb29b5dc73c91270ad93/templates/hostname.tpl). The end result is a line of the form: ` ansible_host= wireguard_ip=`. An inventory line [for the monitor
node](https://github.com/cpu/PromGuard/blob/af52c13d83367f0f049cbb29b5dc73c91270ad93/promguard.tf#L98:L109) is generated the same way. Lastly another [template](https://github.com/cpu/PromGuard/blob/af52c13d83367f0f049cbb29b5dc73c91270ad93/templates/inventory.tpl) is used to [stitch together the node and monitor inventory lines](https://github.com/cpu/PromGuard/blob/af52c13d83367f0f049cbb29b5dc73c91270ad93/promguard.tf#L111:L119) into one Ansible inventory.
When generating the inventory line each server is given a WireGuard IP in the
`10.0.0.0` RFC1918 reserved network.
To make life easy [the monitor is always the first
address](https://github.com/cpu/PromGuard/blob/af52c13d83367f0f049cbb29b5dc73c91270ad93/promguard.tf#L105:L107),
`10.0.0.1`. The nodes are [assigned sequential
addresses](https://github.com/cpu/PromGuard/blob/af52c13d83367f0f049cbb29b5dc73c91270ad93/promguard.tf#L90:PL94)
starting at `10.0.0.2`.
#### Ansible
There are four main Ansible playbooks at work:
1. The [UFW
playbook](https://github.com/cpu/PromGuard/tree/367f334819b6ba4c6a323e3bbec76b934f93b7c7/playbooks/roles/ufw/tasks)
1. The [WireGuard
playbook](https://github.com/cpu/PromGuard/tree/367f334819b6ba4c6a323e3bbec76b934f93b7c7/playbooks/roles/wireguard)
1. The [Node Exporter playbook](https://github.com/cpu/PromGuard/tree/367f334819b6ba4c6a323e3bbec76b934f93b7c7/playbooks/roles/node_exporter)
1. The [Prometheus server
playbook](https://github.com/cpu/PromGuard/tree/367f334819b6ba4c6a323e3bbec76b934f93b7c7/playbooks/roles/prometheus-servera)
The UFW playbook is very straight-forward. It [installs
UFW](https://github.com/cpu/PromGuard/blob/901e88d145f8dc971822546a130f685bb5035ce7/playbooks/roles/ufw/tasks/main.yml#L3:L5), allows [inbound TCP on port 22](https://github.com/cpu/PromGuard/blob/901e88d145f8dc971822546a130f685bb5035ce7/playbooks/roles/ufw/tasks/main.yml#L7:L12) for SSH, and [enables UFW at boot](https://github.com/cpu/PromGuard/blob/901e88d145f8dc971822546a130f685bb5035ce7/playbooks/roles/ufw/tasks/main.yml#L14:L18) with a default deny inbound policy.
The WireGuard playbook [installs `wireguard-dkms` and
`wireguard-tools`](https://github.com/cpu/PromGuard/blob/901e88d145f8dc971822546a130f685bb5035ce7/playbooks/roles/wireguard/tasks/main.yml#L3:L17)
after setting up the Ubuntu PPA. Each server [generates its own WireGuard
private
key](https://github.com/cpu/PromGuard/blob/901e88d145f8dc971822546a130f685bb5035ce7/playbooks/roles/wireguard/tasks/main.yml#L27:L30).
The public key is [derived from the private key](https://github.com/cpu/PromGuard/blob/901e88d145f8dc971822546a130f685bb5035ce7/playbooks/roles/wireguard/tasks/main.yml#L37:L40) and registered as an Ansible fact [for
that
host](https://github.com/cpu/PromGuard/blob/901e88d145f8dc971822546a130f685bb5035ce7/playbooks/roles/wireguard/tasks/main.yml#L42:L44). This makes it easy to refer to a server's WireGuard public key from templates and tasks. Each private key is only known by the server it belongs to and the host running the Ansible playbooks.
Beyond installing WireGuard and computing keys the WireGuard playbook also
writes a [WireGuard config
file](https://github.com/cpu/PromGuard/blob/901e88d145f8dc971822546a130f685bb5035ce7/playbooks/roles/wireguard/tasks/main.yml#L46:L52), and a [network interface config
file](https://github.com/cpu/PromGuard/blob/901e88d145f8dc971822546a130f685bb5035ce7/playbooks/roles/wireguard/tasks/main.yml#L54:L60).
The WireGuard config file (`/etc/wireguard/wg0.conf`) for each host is written from a template that [declares an `[Interface]`](https://github.com/cpu/PromGuard/blob/901e88d145f8dc971822546a130f685bb5035ce7/playbooks/roles/wireguard/templates/wg0.conf.j2#L4:L6) and the required `[Peer]` entries. The `[Peer]` config differs based on whether the host is a monitor, needing [one `[Peer]` for every server](https://github.com/cpu/PromGuard/blob/901e88d145f8dc971822546a130f685bb5035ce7/playbooks/roles/wireguard/templates/wg0.conf.j2#L19:L23), or if it is a monitored server needing only [one `[Peer]` for the monitor](https://github.com/cpu/PromGuard/blob/901e88d145f8dc971822546a130f685bb5035ce7/playbooks/roles/wireguard/templates/wg0.conf.j2#L10:L14). In both cases the `PublicKey` and `AllowedIPs` for each peer are populated using Ansible facts and the inventory.
The network interface config file (`/etc/network/interfaces.d/60-wireguard.cfg.j2`) for each host is written from a template that [configures a `wg0` network `iface`](https://github.com/cpu/PromGuard/blob/901e88d145f8dc971822546a130f685bb5035ce7/playbooks/roles/wireguard/templates/60-wireguard.cfg.j2#L6:L11). The `address` is populated based on the server's `wireguard_ip` assigned in the Ansible inventory. The `pre-up` statements configure the interface as a WireGuard type interface that should use the `/etc/wireguard/wg0.conf` file the WireGuard role creates.
This gives us a `wg0` interface on each server, configured with the right
IP/keypair, and ready with peer configuration based on the server's role.
#### Node Exporter
The `node_exporter` role is pretty simple. The [majority of the
tasks](https://github.com/cpu/PromGuard/blob/901e88d145f8dc971822546a130f685bb5035ce7/playbooks/roles/node_exporter/tasks/main.yml#L3:L46)
are for setting up a dedicated user, downloading the exporter code, unpacking
it, and making sure it runs on start with a systemd unit.
Notably [the systemd unit
template](https://github.com/cpu/PromGuard/blob/901e88d145f8dc971822546a130f685bb5035ce7/playbooks/roles/node_exporter/templates/node_exporter.service.j2)
makes sure the `ExecStart` line [passes
`--web.listen-address`](https://github.com/cpu/PromGuard/blob/901e88d145f8dc971822546a130f685bb5035ce7/playbooks/roles/node_exporter/templates/node_exporter.service.j2#L11)
to restrict the `node_exporter` to listening on the `wireguard_ip` (e.g. on
`wg0`). By default it will listen on `127.0.0.1` and we only want it to be
accessible over WireGuard instead.
The `node_exporter` role also [adds a new firewall
rule](https://github.com/cpu/PromGuard/blob/901e88d145f8dc971822546a130f685bb5035ce7/playbooks/roles/node_exporter/tasks/main.yml#L48:L58)
for all of the to-be-monitored servers. This rule allows TCP traffic to the
`node_exporter` port destined to the `wireguard_ip` from the [monitor's
`wireguard_ip`](https://github.com/cpu/PromGuard/blob/901e88d145f8dc971822546a130f685bb5035ce7/playbooks/roles/node_exporter/tasks/main.yml#L50).
The end result is that every to-be-monitored server has a `node_exporter` that
can only be accessed over WireGuard, and only by the monitor server. The monitor
server isn't able to access any other ports/services and the metrics data will
always be encrypted while it travels between the server and the monitor.
#### Prometheus
Like the `node_exporter` role the [bulk of the
tasks](https://github.com/cpu/PromGuard/blob/901e88d145f8dc971822546a130f685bb5035ce7/playbooks/roles/prometheus-server/tasks/main.yml)
in the Prometheus role are for adding a dedicated user, downloading Prometheus,
installing it, and making sure it has a systemd unit.
The main point of interest is the
[`prometheus.yml.j2`](https://github.com/cpu/PromGuard/blob/901e88d145f8dc971822546a130f685bb5035ce7/playbooks/roles/prometheus-server/templates/prometheus.yml.j2)
template that is used to write the Prometheus server yaml config file on the
monitor server.
For every server in the inventory a [target scrape job is
written](https://github.com/cpu/PromGuard/blob/901e88d145f8dc971822546a130f685bb5035ce7/playbooks/roles/prometheus-server/templates/prometheus.yml.j2#L10:L12). The `targets` IP is the `wireguard_ip` of each server, ensuring the stat collection is done over WireGuard.
The end result is that Prometheus is configured to scrape stats for each server,
over the monitor server's WireGuard link to each target server. The target
servers `node_exporter` is configured to listen on the WireGuard interface and
the firewall has a rule in place to allow the monitor to access the
`node_exporter`.
## Conclusion
Phew! That's a lot of text. Thanks for sticking it out. I hope this was a useful
example/resource.
While this Terraform/Ansible code is just a demo, and specific to
Prometheus/Node Exporter the idea and much of the code is transferrable to other
scenarios where you need to offer a service to a trusted set of hosts in an
encrypted/authenticated setting or want to use Terraform and Ansible together.
Feel free to fork & adapt. Definitely let me know if you use this as a starting
point for another fun WireGuard project :-)
## Example Run
* An example `./run.sh` invocation recorded with `asciinema`. The IP addresses
referred to elsewhere in this README match up with this recording.
[](https://asciinema.org/a/RUGQCKxe8UAPPAMXtfRXrW33F)
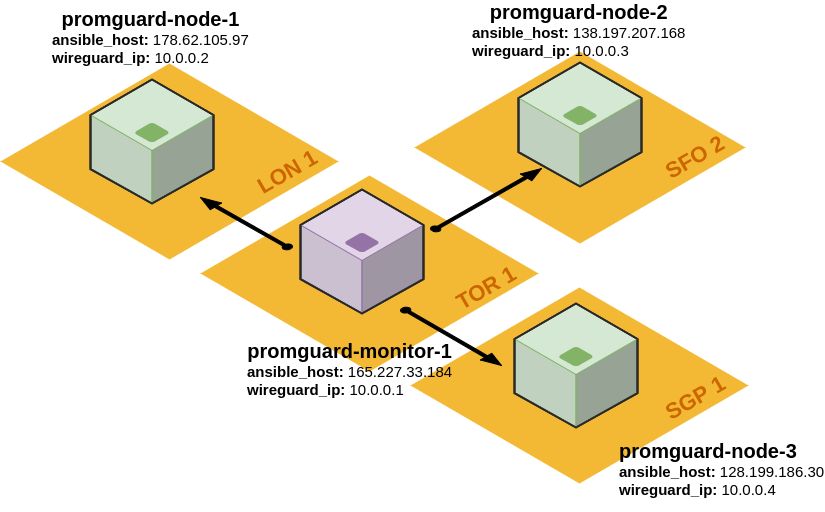
* A small diagram of the resulting infrastructure. One monitor node
(`promguard-monitor-1`) located in Toronto is configured with a WireGuard
tunnel to three nodes to be monitored (`promguard-node-1` in London,
`promguard-node-2` in San Francisco, and `promguard-node-3` in Singapore):
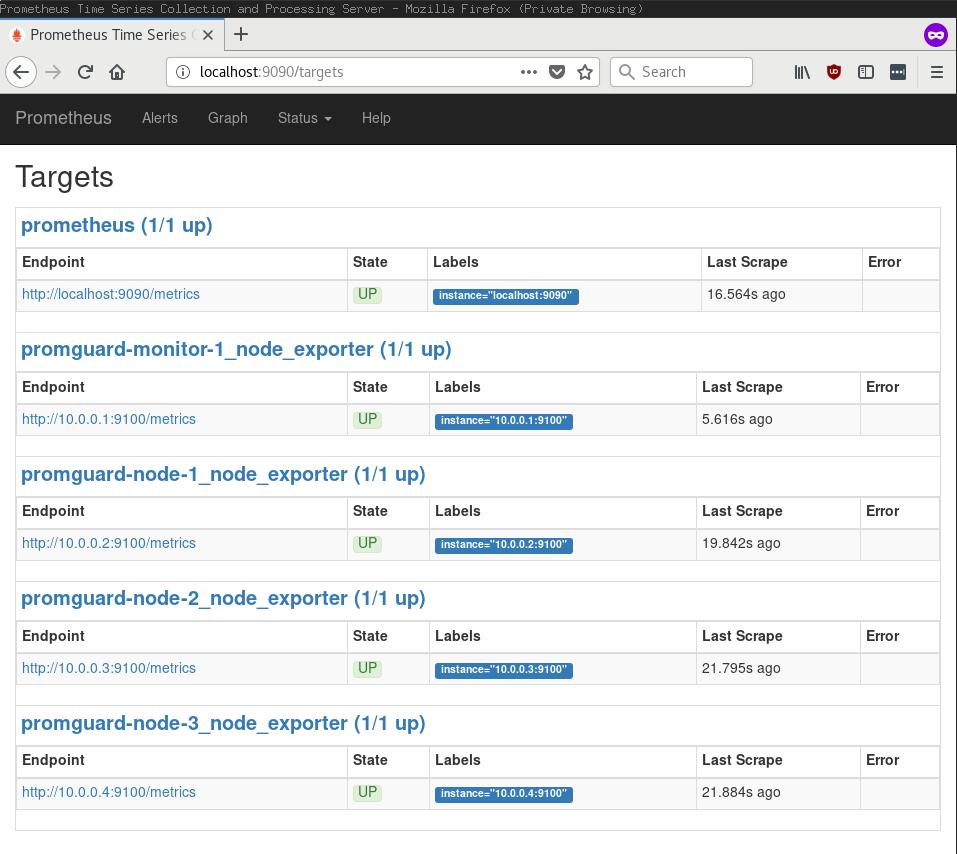
* Here's what the Prometheus targets interface looks like accessed over a SSH
port forward to the monitor host. Each target is specified by a WireGuard
address (`10.0.0.x`):
* The monitor host's (`promguard-monitor-1`) firewall is very simple. Nothing
but SSH and WireGuard here! Strictly speaking this node doesn't even need to
expose WireGuard since it only connects outbound to the monitored nodes.
```
root@promguard-monitor-1:~# ufw status
Status: active
To Action From
-- ------ ----
22/tcp ALLOW Anywhere # OpenSSH
51820/udp ALLOW Anywhere # WireGuard
22/tcp (v6) ALLOW Anywhere (v6) # OpenSSH
51820/udp (v6) ALLOW Anywhere (v6) # WireGuard
```
* Here's what the monitor host's (`promguard-monitor-1`) `wg0` interface status
looks like. It has one peer configured for each of the nodes (`10.0.0.2`,
`10.0.0.3`, and `10.0.0.4`):
```
root@promguard-monitor-1:~# wg
interface: wg0
public key: TxMVo4TkXvp+Av44qL1TiW1E0m6qhdM48E/L8AxdYj4=
private key: (hidden)
listening port: 51820
peer: uJIL7F6e/02Z4byfX2Tl+WRrAu7SXLt6FpP3WBum3U8=
endpoint: 178.62.105.97:51820
allowed ips: 10.0.0.2/32
latest handshake: 1 minute, 47 seconds ago
transfer: 240.56 KiB received, 21.58 KiB sent
peer: oJ0y/SGhq4ebIT1m2Ago4/W4/opkeY9WzKLrxFyxlWw=
endpoint: 128.199.186.30:51820
allowed ips: 10.0.0.4/32
latest handshake: 1 minute, 48 seconds ago
transfer: 242.62 KiB received, 21.58 KiB sent
peer: MOCzYMLelX8uo2WaU/y/xSBRUUphPPoMNl8FymHOGlU=
endpoint: 138.197.207.168:51820
allowed ips: 10.0.0.3/32
latest handshake: 1 minute, 49 seconds ago
transfer: 241.71 KiB received, 21.58 KiB sent
```
* Here's what an example node's (`promguard-node-3`) firewall looks like. It
only allows access to the `node_exporter` port (`9100`) over the WireGuard
interface, and only for the monitor node's source IP (`10.0.0.1`):
```
root@promguard-node-3:~# ufw status
Status: active
To Action From
-- ------ ----
22/tcp ALLOW Anywhere # OpenSSH
51820/udp ALLOW Anywhere # WireGuard
10.0.0.4 9100/tcp ALLOW 10.0.0.1 # promguard-monitor-1 WireGuard node-exporter scraper
22/tcp (v6) ALLOW Anywhere (v6) # OpenSSH
51820/udp (v6) ALLOW Anywhere (v6) # WireGuard
```
* An example node's (`promguard-node-3` again) `wg0` interface shows only one
peer, the monitor host:
```
root@promguard-node-3:~# wg
interface: wg0
public key: oJ0y/SGhq4ebIT1m2Ago4/W4/opkeY9WzKLrxFyxlWw=
private key: (hidden)
listening port: 51820
peer: TxMVo4TkXvp+Av44qL1TiW1E0m6qhdM48E/L8AxdYj4=
endpoint: 165.227.33.184:51820
allowed ips: 10.0.0.1/32
latest handshake: 31 seconds ago
transfer: 25.50 KiB received, 285.54 KiB sent
```