https://github.com/csinva/data-viz-utils
Functions for easily making publication-quality figures with matplotlib.
https://github.com/csinva/data-viz-utils
big-data data-analysis data-science data-visualization eda legend matplotlib python python3 scatterplot time-series
Last synced: about 1 year ago
JSON representation
Functions for easily making publication-quality figures with matplotlib.
- Host: GitHub
- URL: https://github.com/csinva/data-viz-utils
- Owner: csinva
- License: mit
- Created: 2020-01-04T13:16:43.000Z (over 6 years ago)
- Default Branch: master
- Last Pushed: 2024-01-20T01:23:55.000Z (over 2 years ago)
- Last Synced: 2025-05-02T08:51:13.528Z (about 1 year ago)
- Topics: big-data, data-analysis, data-science, data-visualization, eda, legend, matplotlib, python, python3, scatterplot, time-series
- Language: Jupyter Notebook
- Homepage: https://csinva.io/data-viz-utils/
- Size: 9.88 MB
- Stars: 19
- Watchers: 2
- Forks: 3
- Open Issues: 0
-
Metadata Files:
- Readme: readme.md
- License: LICENSE
Awesome Lists containing this project
README
Data-viz utils 📈
Functions for data visualization in matplotlib


Can be installed using `pip install dvu` and then imported with `import dvu`.
You can also just copy the relatively short source code for the functions (easily viewable [here](https://csinva.io/data-viz-utils/docs/dvu.html)).
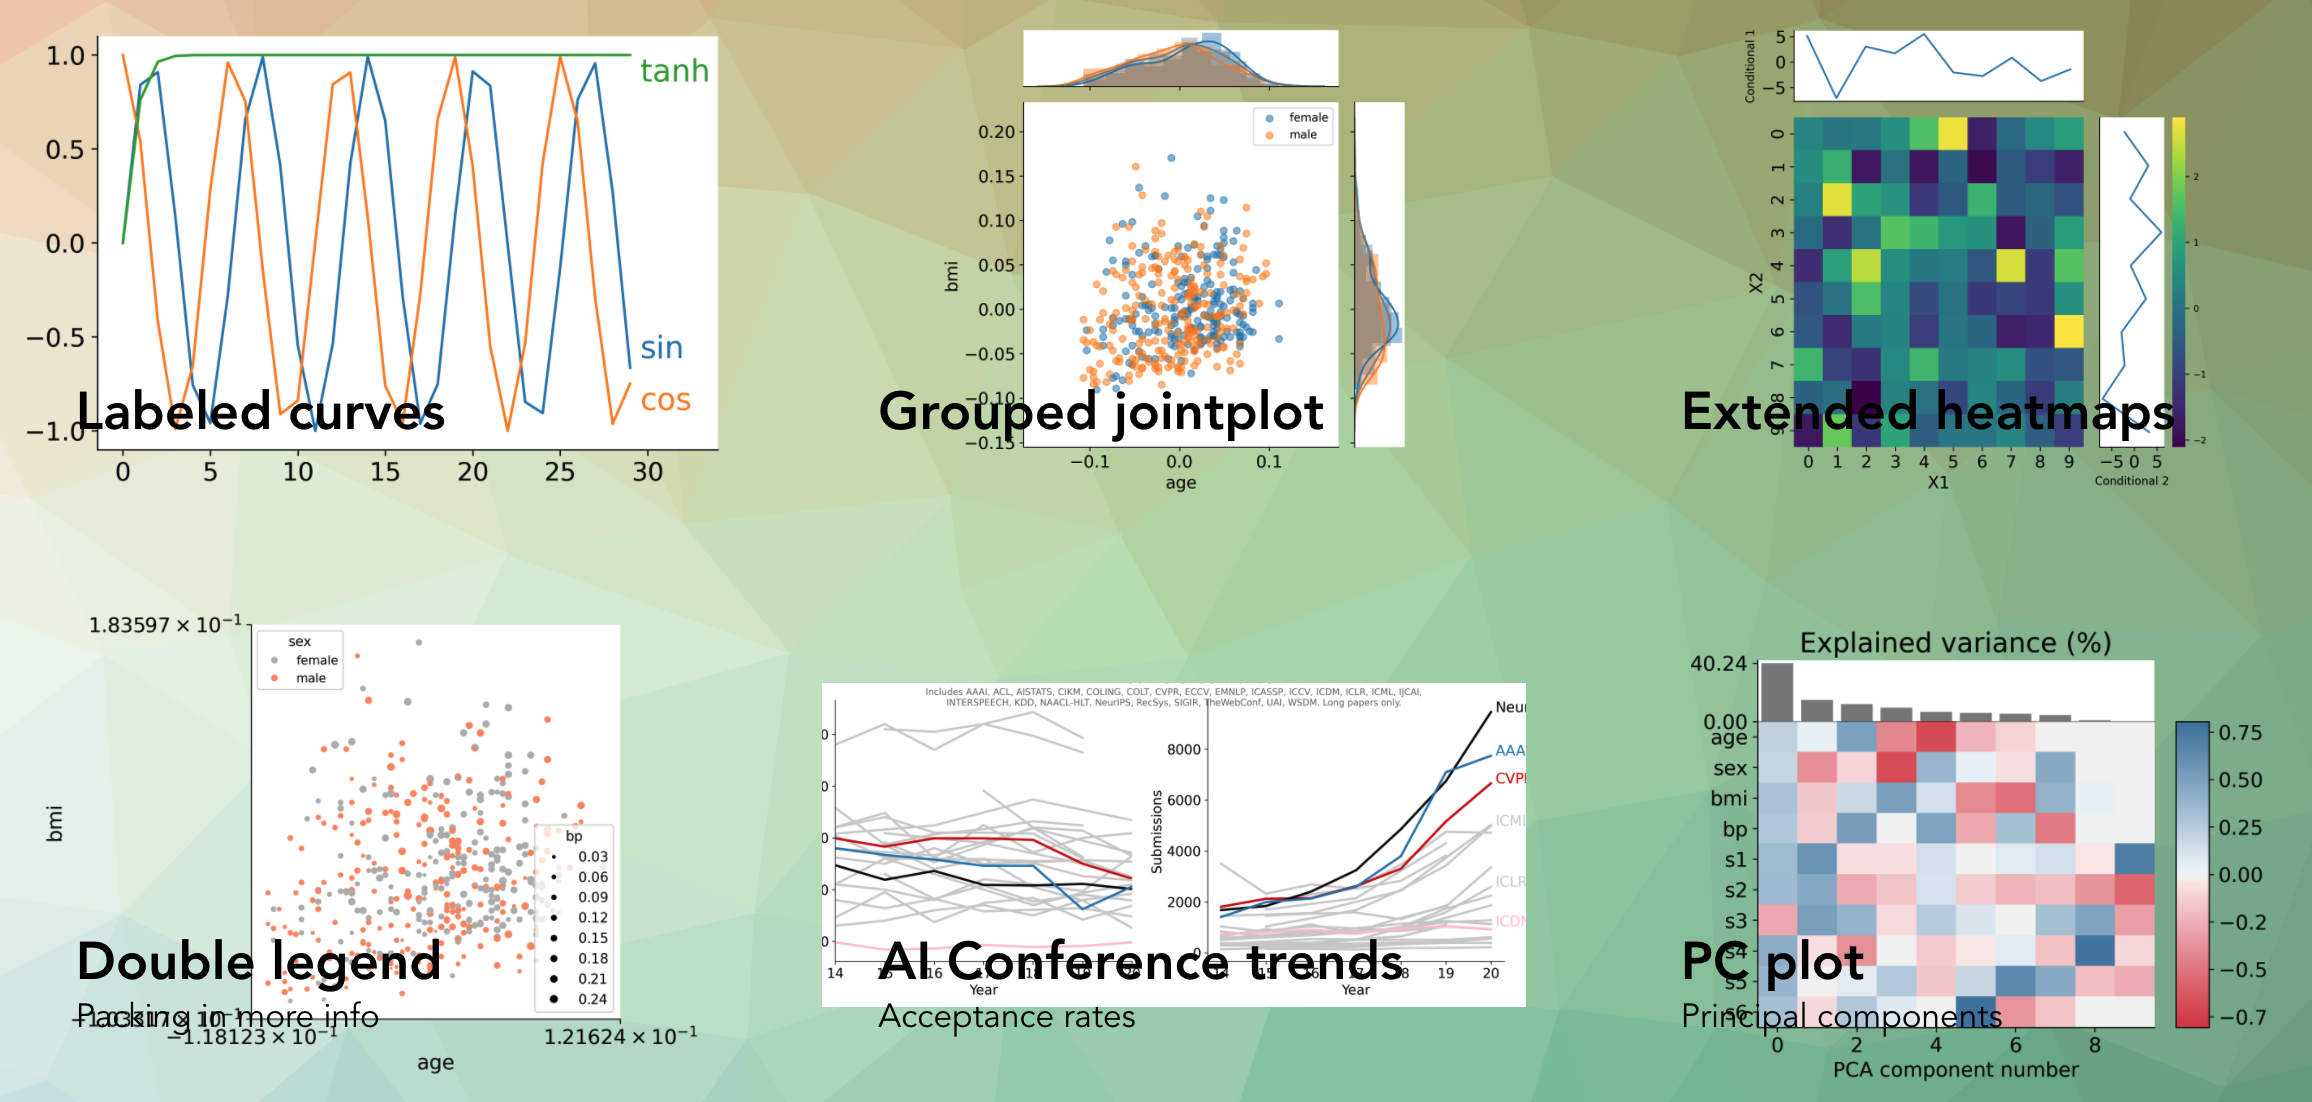
Helps create a bunch of different plots such as these:
One particularly useful function is `dvu.line_legend()` which replaces a typical matplotlib legend with labels for each line:
| Using `plt.legend()` | Using `dvu.line_legend()` |
| --------------------------------------------------- | ---------------------------------------------- |
|  |  |
Another one is `dvu.invert_plot()` which can be called after generating a plot to invert everything besides the line colors
| Original plot | After `dvu.invert_plot()` |
| ---------------------------------------------- | --------------------------------------------------- |
|  |  |
# Reference
- for updates, star the repo or follow [@csinva_](https://twitter.com/csinva_)
- super-related and wonderful [matplotlib-label-lines](https://github.com/cphyc/matplotlib-label-lines) project
- [PR](https://t.co/lTe19vdETE?amp=1) for implementing line-labeling into matplotlib
- feel free to use openly!
- built with jekyll + github pages
- theme from [here](https://github.com/inded/Jekyll_modern-blog)
- based off of this [article from Codrops](http://tympanus.net/codrops/?p=24222)