https://github.com/dandarawy/unity3d-globe
Unity3D Implementation of Chrome Experiment WebGL Globe
https://github.com/dandarawy/unity3d-globe
earth globe unity unity3d webgl-globe
Last synced: 11 months ago
JSON representation
Unity3D Implementation of Chrome Experiment WebGL Globe
- Host: GitHub
- URL: https://github.com/dandarawy/unity3d-globe
- Owner: Dandarawy
- License: mit
- Created: 2017-04-13T22:41:40.000Z (over 9 years ago)
- Default Branch: master
- Last Pushed: 2019-12-06T04:38:44.000Z (over 6 years ago)
- Last Synced: 2025-04-08T04:51:18.500Z (over 1 year ago)
- Topics: earth, globe, unity, unity3d, webgl-globe
- Language: C#
- Homepage: https://dandarawy.github.io/Unity3D-Globe/
- Size: 31.8 MB
- Stars: 179
- Watchers: 15
- Forks: 65
- Open Issues: 1
-
Metadata Files:
- Readme: README.md
- License: LICENSE
Awesome Lists containing this project
README
# Unity3D-Globe
Unity3D Implementation for Chrome Experiment WebGL Globe
Try a [Live Demo](https://dandarawy.github.io/Unity3D-Globe/)
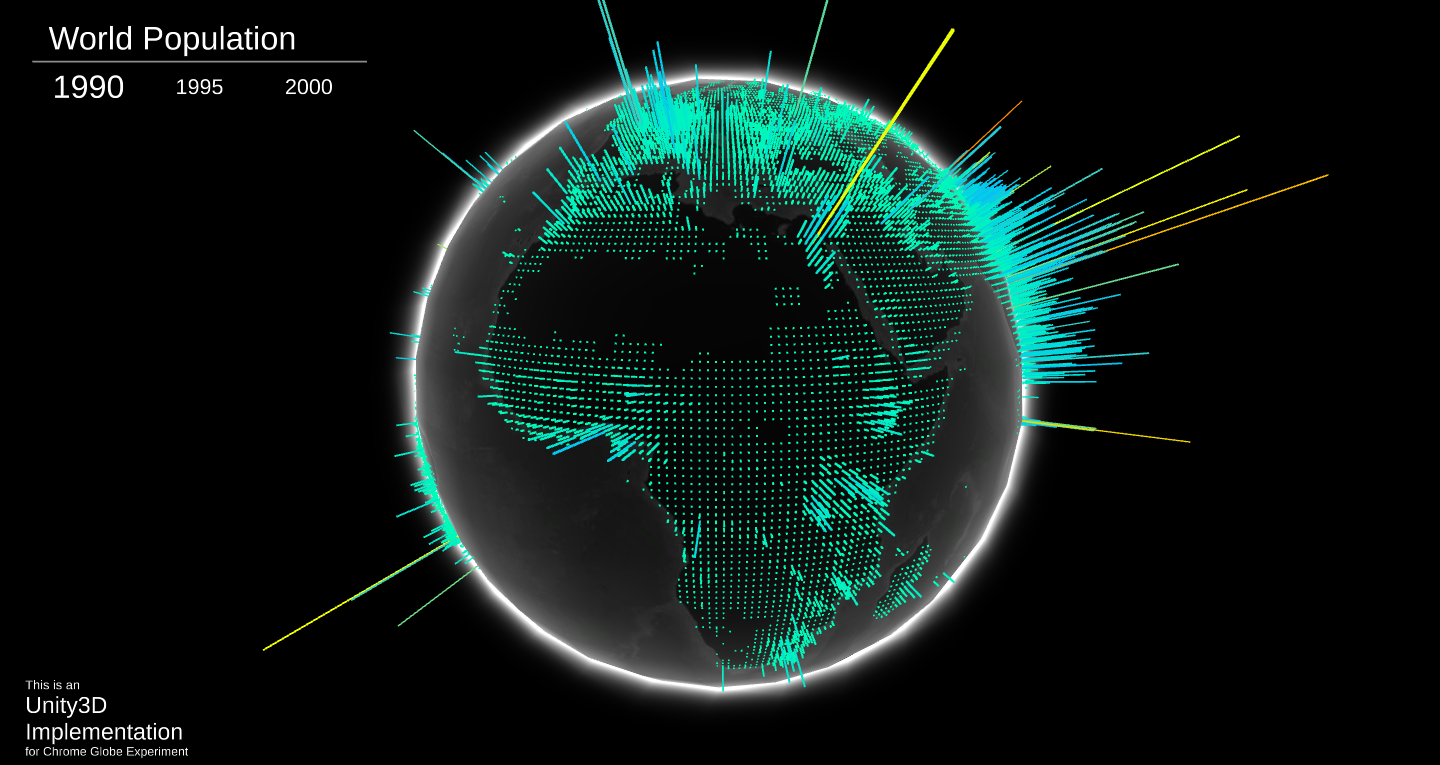
**Unity3D-Globe** is a complete project in which you can use to add your own data and create your globe.
# Change Data Source
The default `DataLoader` loads a `JSON` file from Resources folder, the loader expect `JSON` in the following format:
```javascript
{
"AllData": [
{
"Year": "1990",
"Data": latitude, longitude, magnitude, latitude, longitude, magnitude, ...]
},
{
"Year": "2000",
"Data": latitude, longitude, magnitude, latitude, longitude, magnitude, ...]
}
]
}
```
You can change the structure of the `JSON` file or even the data source as required and implement your own `DataLoader`.
# Visualize Your Data
* To visualize your data you'll need to have a GameObject with `DataVisualizer` component attached to it
* `DataVisualizer` needs a reference to the following elements:
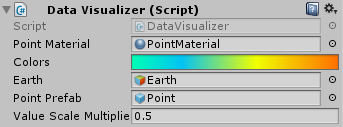
1. PointMaterial: this is a material used for the points mesh, this material should be able to use the vertex color data to set the final color of the vertex, there is a material created for this purpose under the materials folder which use a custom shader written for this purpose
2. Colors: a gradient to be used to assign each data point a color according to its value
3. Earth: the earth object in the scene.
4. Point Prefab: a prefab to the point which will be placed for each data value
* After loading the data wrap it in array of `SeriesData`, the `SeriesData` is just a class that has a name and `float` array, the `float` array represent the series data in the following order [latitude, longitude, magnitude, latitude, longitude, magnitude, ...]
* Call the `CreateMeshes` function from your `DataVisualizer` and send it the series array that you have just created
* To switch the shown series just call `ActivateSeries` function on visualizer and send it the index of the series that you need to show.