https://github.com/danielfleischer/git-commits-lines-graph
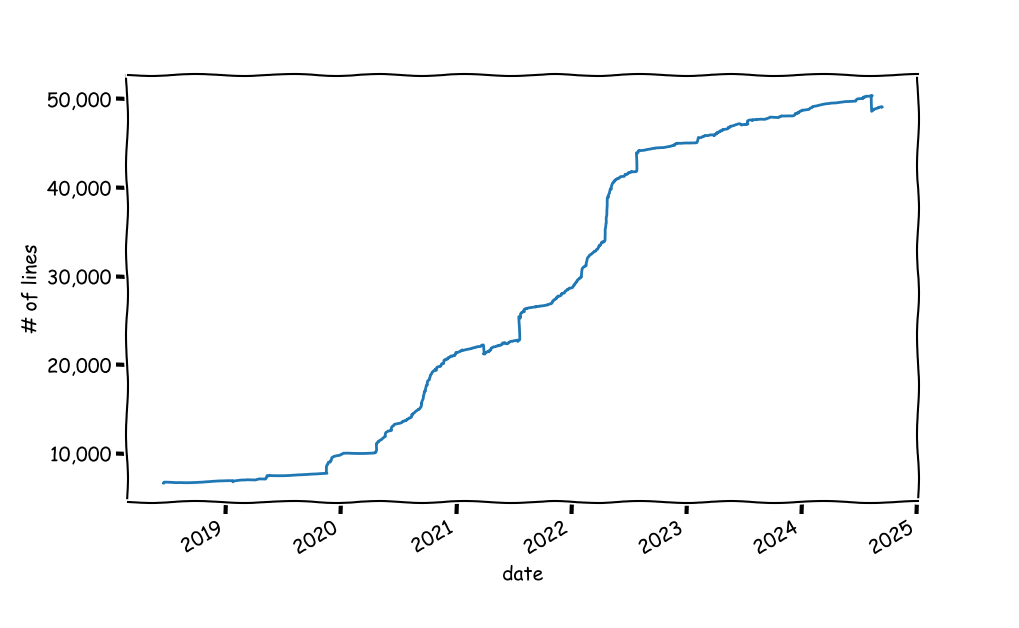
Plot project lines of code as a function of time.
https://github.com/danielfleischer/git-commits-lines-graph
git lines-of-code plot
Last synced: over 1 year ago
JSON representation
Plot project lines of code as a function of time.
- Host: GitHub
- URL: https://github.com/danielfleischer/git-commits-lines-graph
- Owner: danielfleischer
- Created: 2021-03-23T12:44:00.000Z (over 5 years ago)
- Default Branch: master
- Last Pushed: 2024-09-19T16:33:47.000Z (almost 2 years ago)
- Last Synced: 2025-04-04T17:52:36.534Z (over 1 year ago)
- Topics: git, lines-of-code, plot
- Language: Python
- Homepage:
- Size: 168 KB
- Stars: 8
- Watchers: 2
- Forks: 0
- Open Issues: 0
-
Metadata Files:
- Readme: README.md
Awesome Lists containing this project
README
# Git Commit Lines Graph
[](https://pypi.org/project/git-lines-graph/)
A small python script to visualize the number of lines in a project, as a function of time.
**Install:** `python3 -m pip install git-lines-graph`
**Usage:** `git-lines-graph [-b BRANCH] GIT-DIR`
Call with a git project directory. You can also specify a branch to scan; other wise the branch currently checked in is used.
**Dependencies:**
- `GitPython` to interact with `git`.
- `matplotlib` for plotting.
- `pandas` for data manipulation.
----
### How Does It Work
The code goes over all commits messages and looks for the number of lines added/removed and keeps an updated count. **Caveat**: the lines reported in git commit messages are only a proxy for the true number of lines of code. It could be way off in projects in which there are data artifacts such as big data files. One solution is to loop over all commits, checkout the commit and do a `wc` over all files that are considered to be code files. But that's slower and could be dangerous in dirty projects.