https://github.com/danielmartensson/gnu-octave-logger
Basic data acquisition system with Arduino UNO and GNU Octave
https://github.com/danielmartensson/gnu-octave-logger
arduino data-aquisition gnu-octave octave-gui
Last synced: 2 months ago
JSON representation
Basic data acquisition system with Arduino UNO and GNU Octave
- Host: GitHub
- URL: https://github.com/danielmartensson/gnu-octave-logger
- Owner: DanielMartensson
- License: mit
- Created: 2023-01-12T00:50:16.000Z (over 2 years ago)
- Default Branch: main
- Last Pushed: 2024-01-09T15:27:49.000Z (over 1 year ago)
- Last Synced: 2025-04-06T15:26:14.116Z (3 months ago)
- Topics: arduino, data-aquisition, gnu-octave, octave-gui
- Language: MATLAB
- Homepage:
- Size: 350 KB
- Stars: 4
- Watchers: 1
- Forks: 1
- Open Issues: 0
-
Metadata Files:
- Readme: ReadMe.md
- License: LICENSE
Awesome Lists containing this project
README
# GNU Octave Logger
This is a basic data acquisition system with Arduino UNO and GNU Octave.
This software is developed with [guiEditor](https://gitlab.com/labinformatica/guieditor).
# Features
- Arduino UNO support
- One analog input measurement
- One analog output measurement
- Real time measurement logging to `.csv` file
- Connection check
- Calibration
# Dependencies
Make sure you have installed these packages before you running this software.
- `instrument-control`
- `arduino`
- `Arduino IDE`
Two of these packages can be installed from the `command window` of GNU Octave with the following commands:
`pkg install -forge instrument-control`
`pkg install -forge arduino`
# How to run the software
1. Install GNU Octave.
2. Download this repository and extract it.
3. Run the `GNU_Octave_Logger.m` file from the `command window`.
# Picture
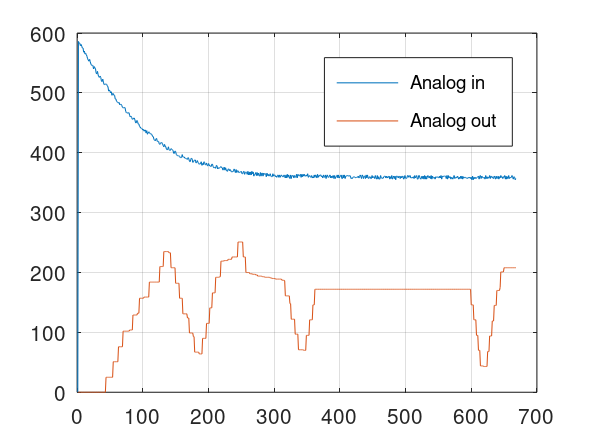
Processing measurements

Result
```matlab
>> x = dlmread('Measure.csv');
>> plot(x(:, 3)) % Analog in column
>> hold on
>> plot(x(:, 4)) % Analog out column
>> legend('Analog in', 'Analog out')
>> grid on
```
