https://github.com/danzigerrr/project_mn_macd
https://github.com/danzigerrr/project_mn_macd
Last synced: 12 months ago
JSON representation
- Host: GitHub
- URL: https://github.com/danzigerrr/project_mn_macd
- Owner: Danzigerrr
- Created: 2022-03-11T07:33:32.000Z (over 4 years ago)
- Default Branch: master
- Last Pushed: 2022-10-04T08:05:30.000Z (over 3 years ago)
- Last Synced: 2025-03-16T06:16:54.744Z (over 1 year ago)
- Language: Python
- Size: 14.3 MB
- Stars: 0
- Watchers: 1
- Forks: 0
- Open Issues: 0
-
Metadata Files:
- Readme: README.md
Awesome Lists containing this project
README
# MACD value indicator - trend-following momentum indicator
Author: Krzysztof Nazar
## 1. Introduction
**The MACD (Moving Average Convergence Divergence) indicator is a trend dynamics indicator created in the 70s by Gerald Appel. The MACD indicator is based on two lines: the Moving Average Convergence Divergence line (MACD) and the signal line (SIGNAL). The lines allow you to analyze the profitability of selling or buying a given share**
## 2. Theoretical background
To determine the value of the MACD indicator, the so-called exponential moving average. The following formula is used to calculate the rolling exponential for N periods:
$$ {EMA}_N=\frac{p_0+\left(1-\alpha\right)p_1+\ldots+\left(1-\alpha\right)^Np_N}{\left(1-\alpha\right)_.+\ldots+\left(1-\alpha\right)^N} $$
where:
α = 2/(N-1)
N --> number of periods
p_i --> value *i* days before
The MACD indicator is based on two lines. The first is the MACD line, determined as the difference between the two Exponential Moving Average (EMA). The MACD w can be calculated by the formula:
$$ MACD={EMA_{12}}-\ {EMA_{26}} $$
The second line is the signal line defined as the 9-day EMA value calculated from the MACD value.
Thanks to these two lines, you can judge whether it is worth buying or selling stocks. If the MACD line breaks the signal line from the bottom - it's worth buying. On the other hand, if the MACD line breaks the signal lines from the top - it's worth selling. Usually, the MACD and SIGNAL lines tend to run very close to each other and therefore often cross each other, so the appropriate buy and sell signals are also generated.
## 3. The goal of the project
The goal of the project was to implement the MACD indicator along with the utility evaluation. I performed the task using Python. I used the pandas and matplotlib libraries. The input data is a 1000-length vector saved in a CSV file. All files were downloaded from [website] (https://eatradingacademy.com/software/forex-historical-data/) providing historical stock data, and then saved in the "data" folder. The data vector contains information about the closing price for each day. The data shows the value of shares over the past few years.
The EMA value is calculated using the *CalcEMA* function:
```python
def calcEMA(N, ind, data, colName):
if (ind - N) < 0:
return 0
alfa = 2 / (N + 1) # const
num = 0 # numerator
den = 0 # denominator
for i in range(ind, ind - N, -1):
num += data.loc[i, colName] * pow(1 - alfa, i)
den += pow(1 - alfa, i)
return (num / den)
```
The values of the MACD indicator and the SIGNAL line for individual days are calculated on the basis of the *CalcMACD* and *calcSignal* functions, respectively:
```python
def calcMACD(data):
data['MACD'] = 0 # initialize new column
N1 = 12 # period 1
N2 = 26 # period 2
for i in range(CSV_ROW_COUNT):
if (i - N2) > 0:
data.loc[i:i, 'MACD'] = calcEMA(N1, i, data, 'Close') - calcEMA(N2, i, data, 'Close')
```
```python
def calcSignal(data):
data['SIGNAL'] = 0
for i in range(CSV_ROW_COUNT):
data.loc[i:i, 'SIGNAL'] = calcEMA(9, i, data, 'MACD')
```
## 4. Data analysis
From my observations, the MACD indicator is sensitive to sudden changes in trends. If there is a rapid fluctuation in price, this is shown as high peaks in the chart showing the value of the indicator. I noticed that in the analyzed charts, the sharp change in the value of shares occurs due to a pandemic that has adversely affected the state of the global market.
The charts showing the MACD and SIGNAL lines show that both lines cross relatively frequently. It can be assumed that by taking advantage of any opportunity to buy or sell stocks, the entrepreneur would get rich frequently, but would gain relatively small amounts of money.
Unfortunately, it is not certain that such an entrepreneur would always get rich. In real life, investing in the stock market is not as easy as it may seem. Considering only the MACD indicator, you can make investment mistakes. By ignoring other economic tools, you can misinterpret the current stock market situation.
In order to make sure that the buy or sell signal is correct, I assumed that the buy signal should be above the 0 level. This is because the previous 12 days EMA is known to be greater than the previous 26 days. This situation indicates an upward trend in the value of shares. This heralds an increasing value of shares in the near future.
Moreover, in the mechanism I use to buy shares, the value of the shares must be less than the value of the share for which we recently sold the shares. In the case of sales, the opposite is true. I assume that thanks to this approach, the chance of profit is maximized.
In order to avoid hasty decisions made overnight, it is worth waiting with the final decision to buy or sell. A buffer period can be entered to make sure that the signal is correct. For example, in the case of a buy signal, you should consider whether the indicator line has been above the signal line for at least a few days - only after a few days will the final buy signal be generated. An analogous mechanism can be introduced in the case of a sell signal. Thanks to this, the entrepreneur is sure that the situation is stable and the earning potential becomes more certain.
In the program, I introduced functions that analyze the current state of the value of shares and the mechanism of selling and buying shares. At the beginning of the investment, the user has capital of 1,000 currency units and does not own any shares. Investing is done automatically on the basis of the MACD indicator value analysis according to the rules presented above.
The database has 15 different csv files. Each of them contains information about the value of a different share. The files are analyzed individually. For each of them, 4 charts are created showing changes in individual values in the analyzed time period. The charts were created using the functions below.
Function for saving charts showing the * Close "stock values and the difference between the MACD and SIGNAL lines.
```python
def saveGraph(data, ylab, tit, col, ind):
plt.plot(pd.DatetimeIndex(data.loc[0:CSV_ROW_COUNT, 'Time']), data.loc[0:CSV_ROW_COUNT, ylab], label=ylab,
color=col, linewidth=0.7)
plt.legend(loc="upper left")
plt.xlabel('Time')
plt.ylabel(ylab)
title = tit + '_' + str(ind)
savename = 'wykresy/' + title + '.png'
plt.title(title)
plt.tick_params(axis='both', which='major', labelsize=8)
plt.savefig(savename, dpi=200)
plt.close()
```
A function for saving charts showing the values of the MACD and SIGNAL lines. The * withCross * variable is responsible for whether vertical lines are drawn indicating the intersection of two lines.
```python
def saveGraphMS(data, ind, withCross=False):
dateTime = pd.DatetimeIndex(data.loc[0:CSV_ROW_COUNT, 'Time'])
plt.plot(dateTime, data.loc[0:CSV_ROW_COUNT, 'MACD'], label='MACD',
color='orange', linewidth=0.7)
plt.plot(dateTime, data.loc[0:CSV_ROW_COUNT, 'SIGNAL'], label='SIGNAL',
color='cyan', linewidth=0.7)
title = 'MACD AND SIGNAL ' + str(ind)
if withCross:
calcCrossXDays(data, 3)
title = 'MACD_and_SIGNAL_with_bars_' + str(ind)
savename = 'wykresy/' + title + '.png'
plt.title(title)
plt.legend(loc="upper left")
plt.xlabel('Time')
plt.ylabel('Value')
plt.tick_params(axis='both', which='major', labelsize=8)
plt.savefig(savename, dpi=200)
plt.close()
```
Below is an example of each of the graphs.
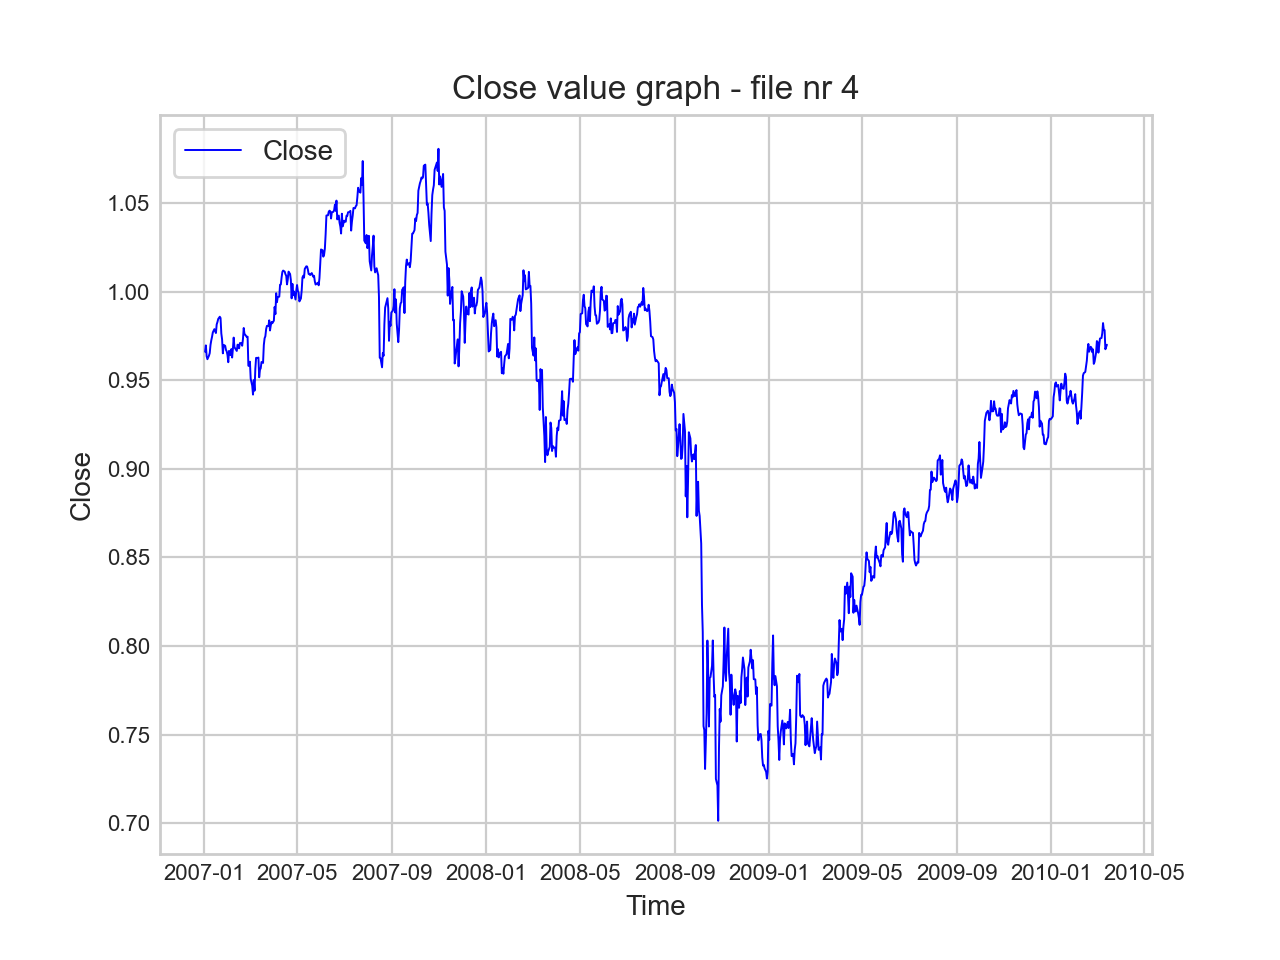
* Picture 1. Graph showing changes in the value of a share. *
$$ $$
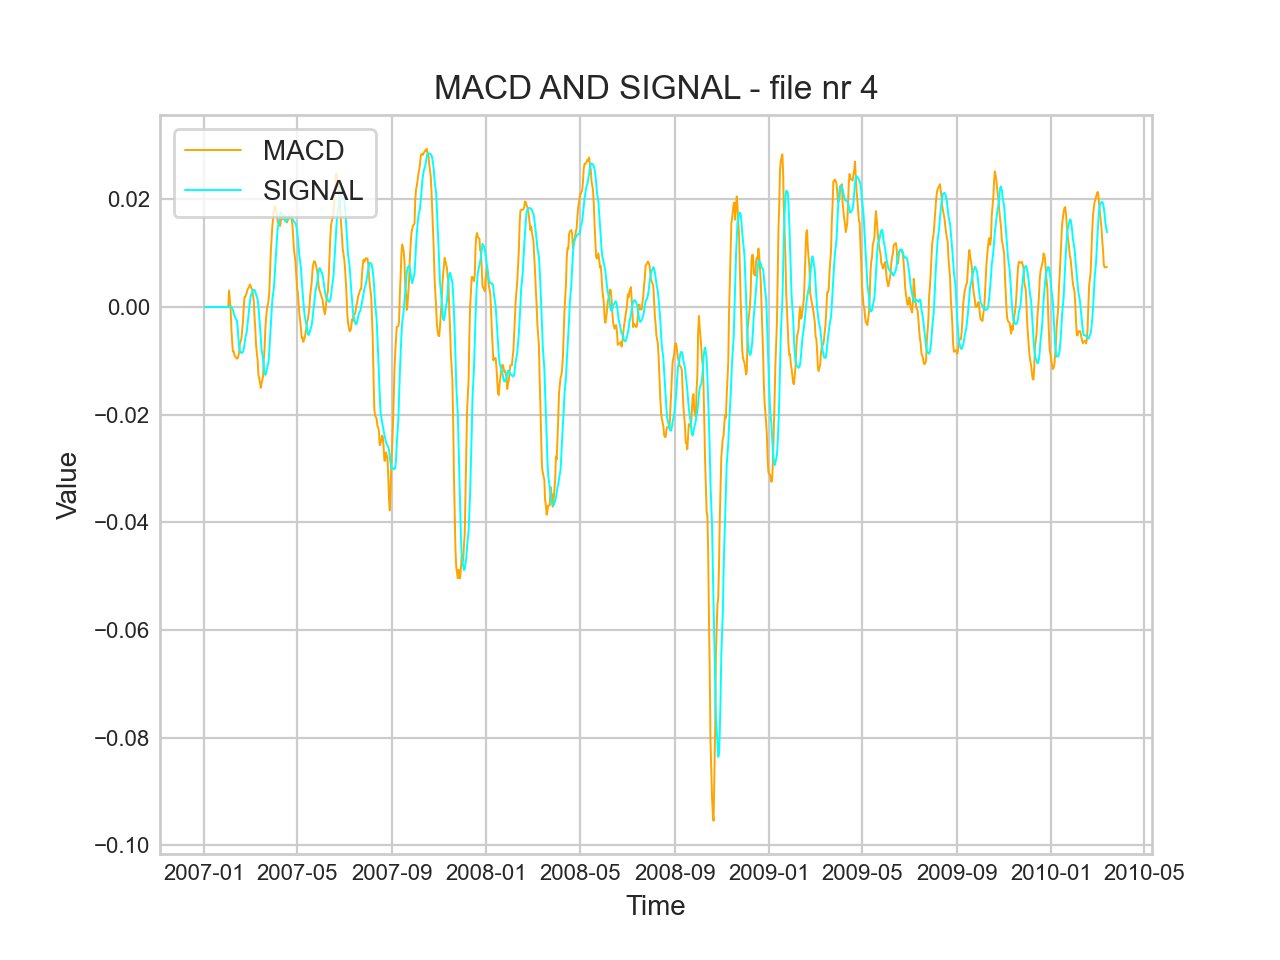
* Picture 2. Chart showing changes in the value of the MACD indicator and the SIGNAL value. *
$$ $$
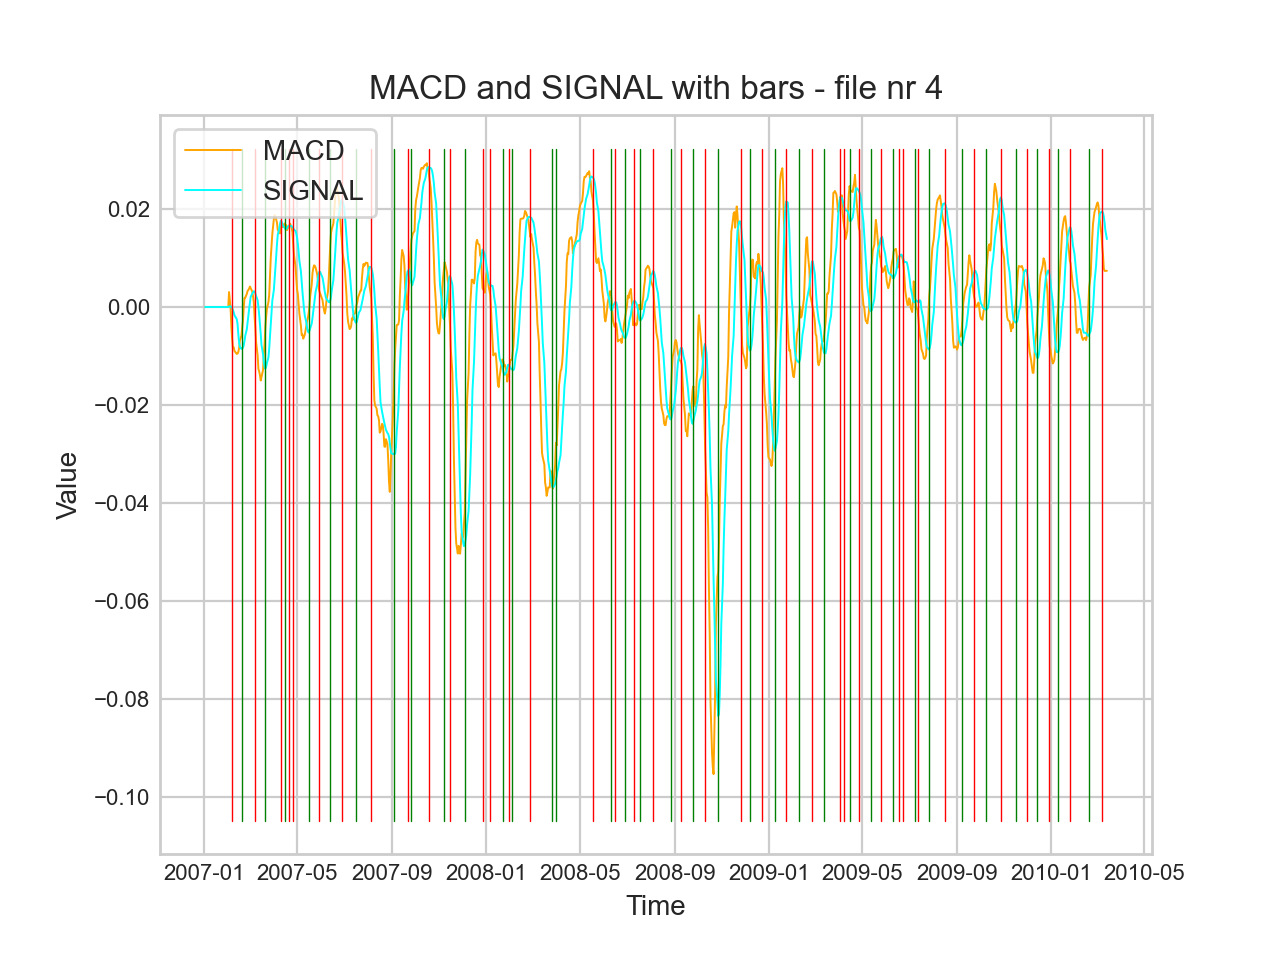
* Picture 3. Chart showing changes in the value of MACD and SIGNAL values with marked places of significant intersections. *
$$ $$
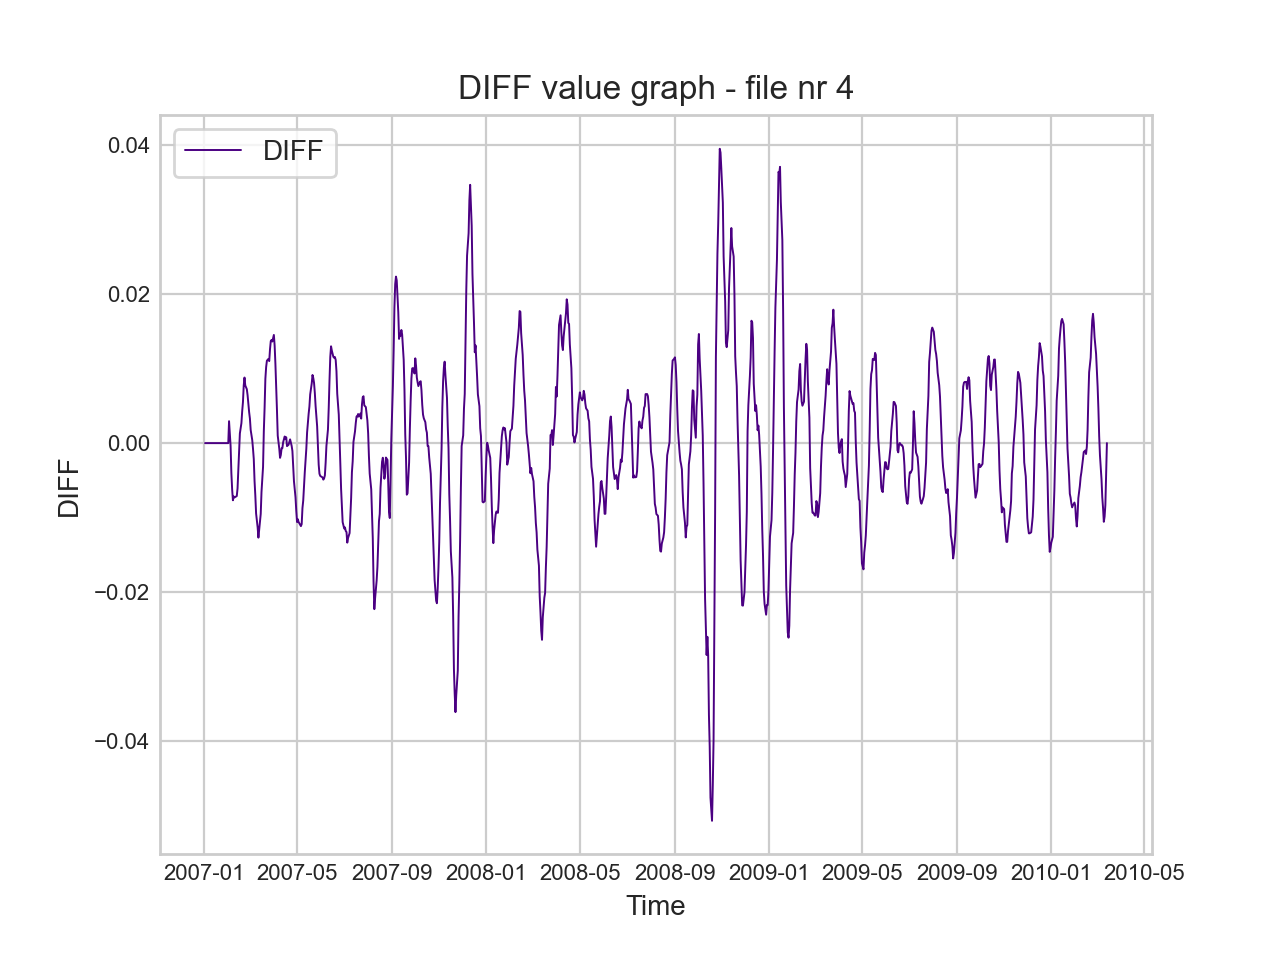
* Picture 4.Graph showing changes in the value of the difference between the MACD value and the SIGNAL value. *
$$ $$
While browsing through the sample charts posted on the Internet, I noticed that the MACD indicator chart usually includes a histogram showing the difference between the current value of the MACD and SIGNAL lines. These differences are presented in the last graph (Picture 4).
In order to find the best buffer period, I created the * calcBestBufor * function iterating over all available data files. This part of the code is used to determine the best buffer period length for specific data. The maximum buffer period is 7 days. The * calcBestBufor * function uses the * calcBuySellXDays * function to calculate the profit after a given period of time. This function takes a * days * parameter indicating how many days the MACD and SINGAL lines cannot intersect before a buy or sell occurs.
```python
def calcBuySellXdays(data, amount, money, days):
count3Days = 0
MACDIsUpper = True
crossHappened = False
if (data['SIGNAL'].loc[data.index[0]] - data['MACD'].loc[data.index[0]]) > 0:
MACDIsUpper = False
last_value = data['Close'].loc[data.index[0]]
for i in range(0, CSV_ROW_COUNT - 1):
temp_value = 0
s = data['SIGNAL'].loc[data.index[i]]
m = data['MACD'].loc[data.index[i]]
temp_value += m
curr_val = data['Close'].loc[data.index[i]]
temp_MACDIsUpper = True
if (s - m) > 0:
temp_MACDIsUpper = False
if temp_MACDIsUpper != MACDIsUpper:
MACDIsUpper = temp_MACDIsUpper
count3Days = 0 # Cross happened, so zero the days counter
crossHappened = True
if crossHappened:
count3Days += 1
# there must be change of state
if count3Days >= days and crossHappened: # then draw vertical line
if MACDIsUpper == True and m > 0:
amount, money, last_value = buy(amount, money, curr_val, last_value)
elif MACDIsUpper == False and m < 0:
amount, money, last_value = sell(amount, money, curr_val, last_value)
# save the new state and value
crossHappened = False
# on the last day sell everything to maximise the amount of money(profit)
if i == CSV_ROW_COUNT - 1 and amount != 0:
money += round(amount * curr_val, 2)
amount = 0
return amount, money
```
```python
def calcBestBufor(data):
bestMoney = 0
bestBufor = 0
for i in range(7):
amount, money = 0, 1000
amount, money = calcBuySellXdays(data, amount, money, i)
if amount != 0: # check on the last day
money += round(amount * data['Close'].loc[data.index[CSV_ROW_COUNT - 1]], 2)
if bestMoney < money:
bestMoney = money
bestBufor = i
return bestMoney, bestBufor
```
To make the final result more reliable, I calculate the arithmetic mean of all obtained partial results.
The entire function is closed in a loop iterating through each document, which allows to determine the MACD coefficient values for the analyzed data set. The values are taken from CSV files located in the "data" folder, and the charts are saved in the "charts" folder.
```python
from functionsMACD import *
sumBestBufor = 0
sumMoney = 0
for ind in range(CSV_COUNT):
filename = 'dane/dane_' + str(ind) + '.csv'
colnames=['Time','Open','High','Low','Close','Volume']
data = pd.read_csv(filename, names=colnames, nrows=CSV_ROW_COUNT) # import data
calcMACD(data)
calcSignal(data)
calcDiff(data)
SaveAllGraphs(data,ind)
bestMoney, bestBufor = calcBestBufor(data)
print(ind, '\t', bestBufor, '\t', bestMoney)
sumBestBufor += bestBufor
sumMoney += bestMoney
#print final average results
print(sumBestBufor/CSV_COUNT)
print(sumMoney / CSV_COUNT)
```
## 5. Results and conclusion
When analyzing the length of an ideal buffer period between 0 and 7 days, the mean of the best buffer period length is 3, (3). So, on average, the best financial result is obtained with a period of between 3 and 4 days. Detailed results are presented in the table below.
| Id of *.csv file | The length in days of the best buffer period | The final condition of the wallet |
|:---:|:---:|:---:|
| 0 | 5 | 15768.22 |
| 1 | 2 | 762.23 |
| 2 | 6 | 1027.27 |
| 3 | 5 | 1201.45 |
| 4 | 0 | 1197.83 |
| 5 | 6 | 1225.79 |
| 6 | 3 | 4600.0 |
| 7 | 3 | 3285.57 |
| 8 | 6 | 1197.41 |
| 9 | 5 | 1205.14 |
| 10 | 3 | 1017.66 |
| 11 | 0 | 1231.01 |
| 12 | 0 | 1197.83 |
| 13 | 3 | 1181.92 |
| 14 | 3 | 1328.57 |
* Table 1. The most cost effective buffer period for the analyzed examples. *
The average profit, based on the analyzed data, is approximately 1,500 currency units. The results obtained during the analysis of the first two files significantly differ from the data obtained on the basis of other files. It is worth noting that the buy and sell mechanism I use does not always generate financial profit. For example, in a document with id 1, the ending value of the portfolio was lower than it was at the beginning. This is because the share's value has gradually declined over time, so it was difficult to make a profit from it. Moreover, apart from the MACD factor, no other economic factors were taken into account that could significantly affect the value of the shares or inform about the unprofitability of investing in these shares.
In fourteen other cases, an increase was achieved, the highest (more than 15-fold) increase in capital was obtained for the data contained in the file with id equal to 0. This indicates a high potential of using the MACD indicator in practice. The indicator is certainly useful in technical analysis and its user can infer a lot from it. However, in order to obtain the best financial results, you should remember about other tools for analyzing the current stock market situation.
It is worth noting that as the length of the buffer period increases, the number of buy and sell signals generated decreases. This is due to the fact that the state when the MACD line is above or below the SIGNAL line usually lasts only a dozen or so days. For a value of, for example, 30 days, there may be a situation where the entrepreneur will not buy any shares during the period of 3 years, because the lines will not cross each other for the entire month. It is too long. On this basis, I believe that the analyzed interval of the study of the best buffer period length was selected appropriately.
The MACD indicator works well in the long run. It is sensitive to rapid changes in stock value trends. If the value of a stock has recently fluctuated sharply and the MACD values are rising, you can expect a change in the trend of the value of the stock. It is worth emphasizing once again that in order to obtain the best financial results, the entrepreneur must use other sources of information and indicators to have a broader perspective on the prevailing situation on the stock exchange.
## Future improvements
The results of this project could be used as an input to AI tools, such as Neural Network, in order to make decisions with higher probability of success.