https://github.com/datalayer/grafana-dashboards
Ξ Grafana Dashboards definitions for the Datalayer services.
https://github.com/datalayer/grafana-dashboards
dashboards datalayer grafana observability
Last synced: 4 months ago
JSON representation
Ξ Grafana Dashboards definitions for the Datalayer services.
- Host: GitHub
- URL: https://github.com/datalayer/grafana-dashboards
- Owner: datalayer
- License: other
- Created: 2024-09-02T07:50:20.000Z (almost 2 years ago)
- Default Branch: main
- Last Pushed: 2025-01-28T09:21:54.000Z (over 1 year ago)
- Last Synced: 2025-06-29T03:43:18.083Z (12 months ago)
- Topics: dashboards, datalayer, grafana, observability
- Homepage: https://datalayer.tech
- Size: 62.5 KB
- Stars: 4
- Watchers: 1
- Forks: 1
- Open Issues: 1
-
Metadata Files:
- Readme: README.md
- License: LICENSE
Awesome Lists containing this project
README
[](https://datalayer.io)
# Ξ Datalayer Grafana Dashboards
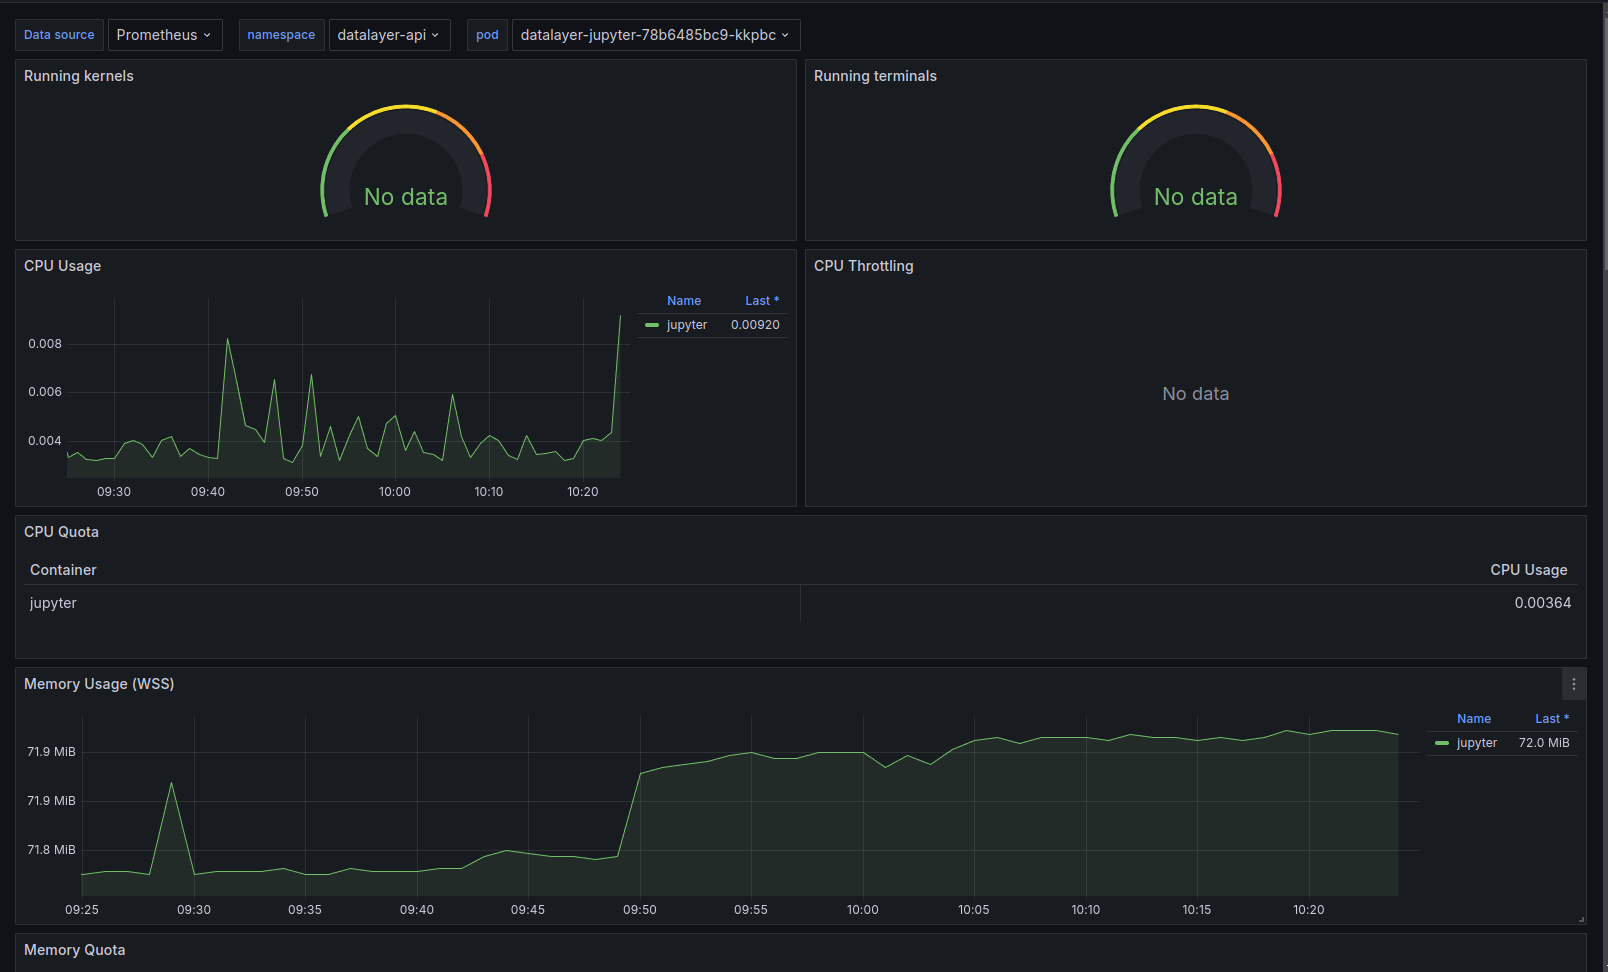
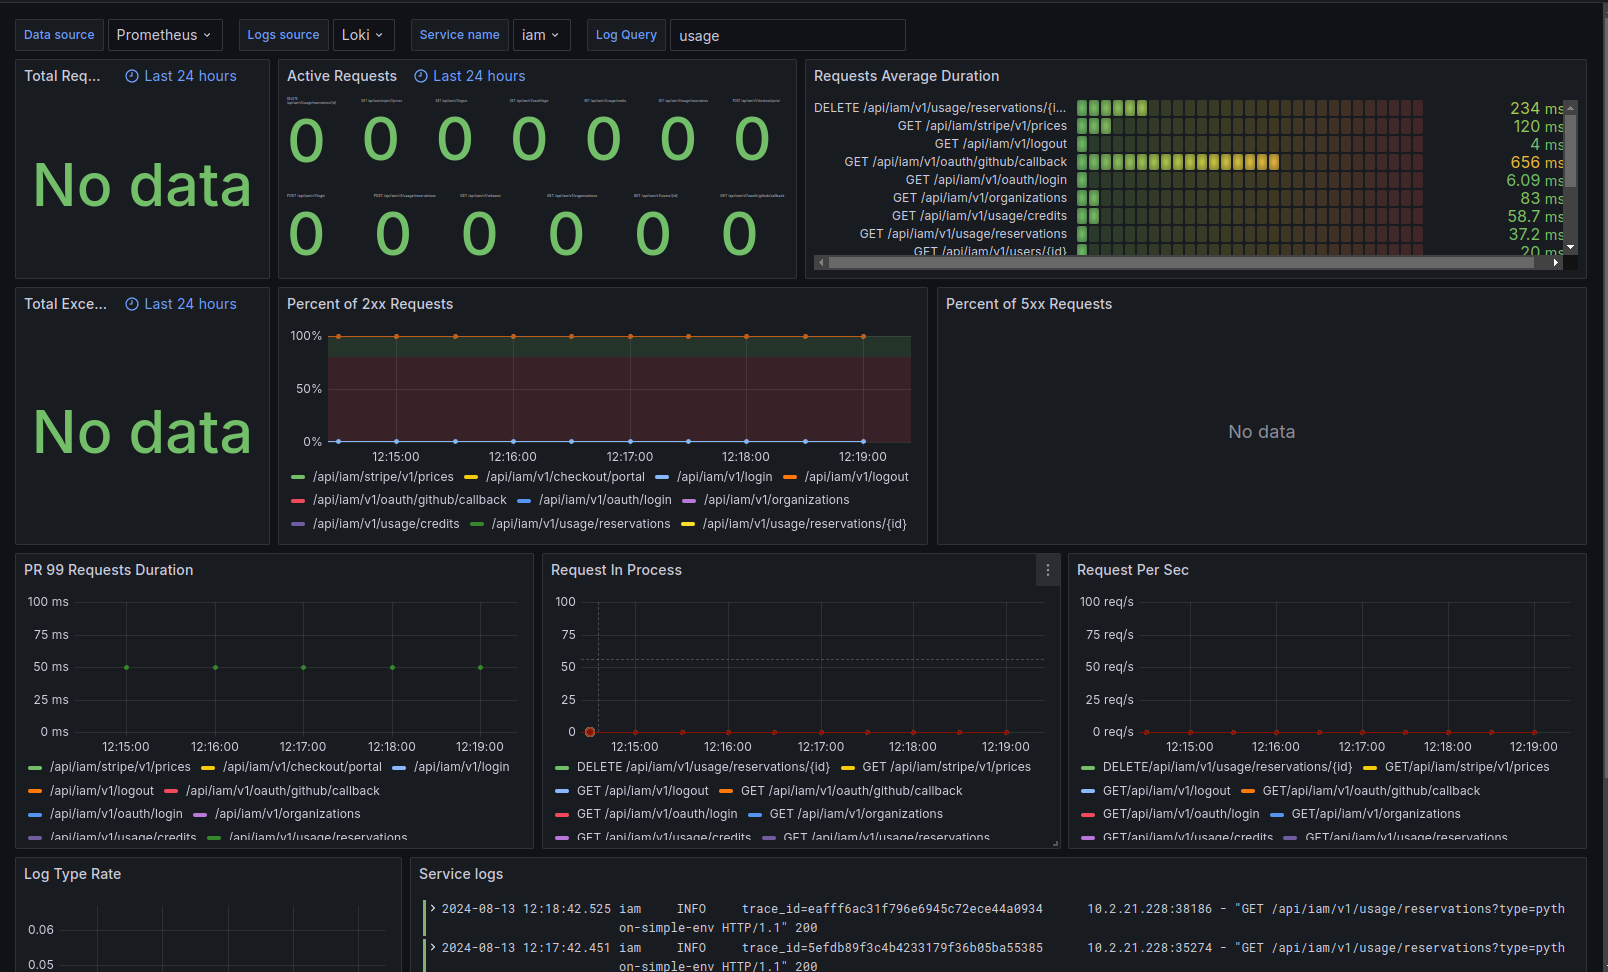
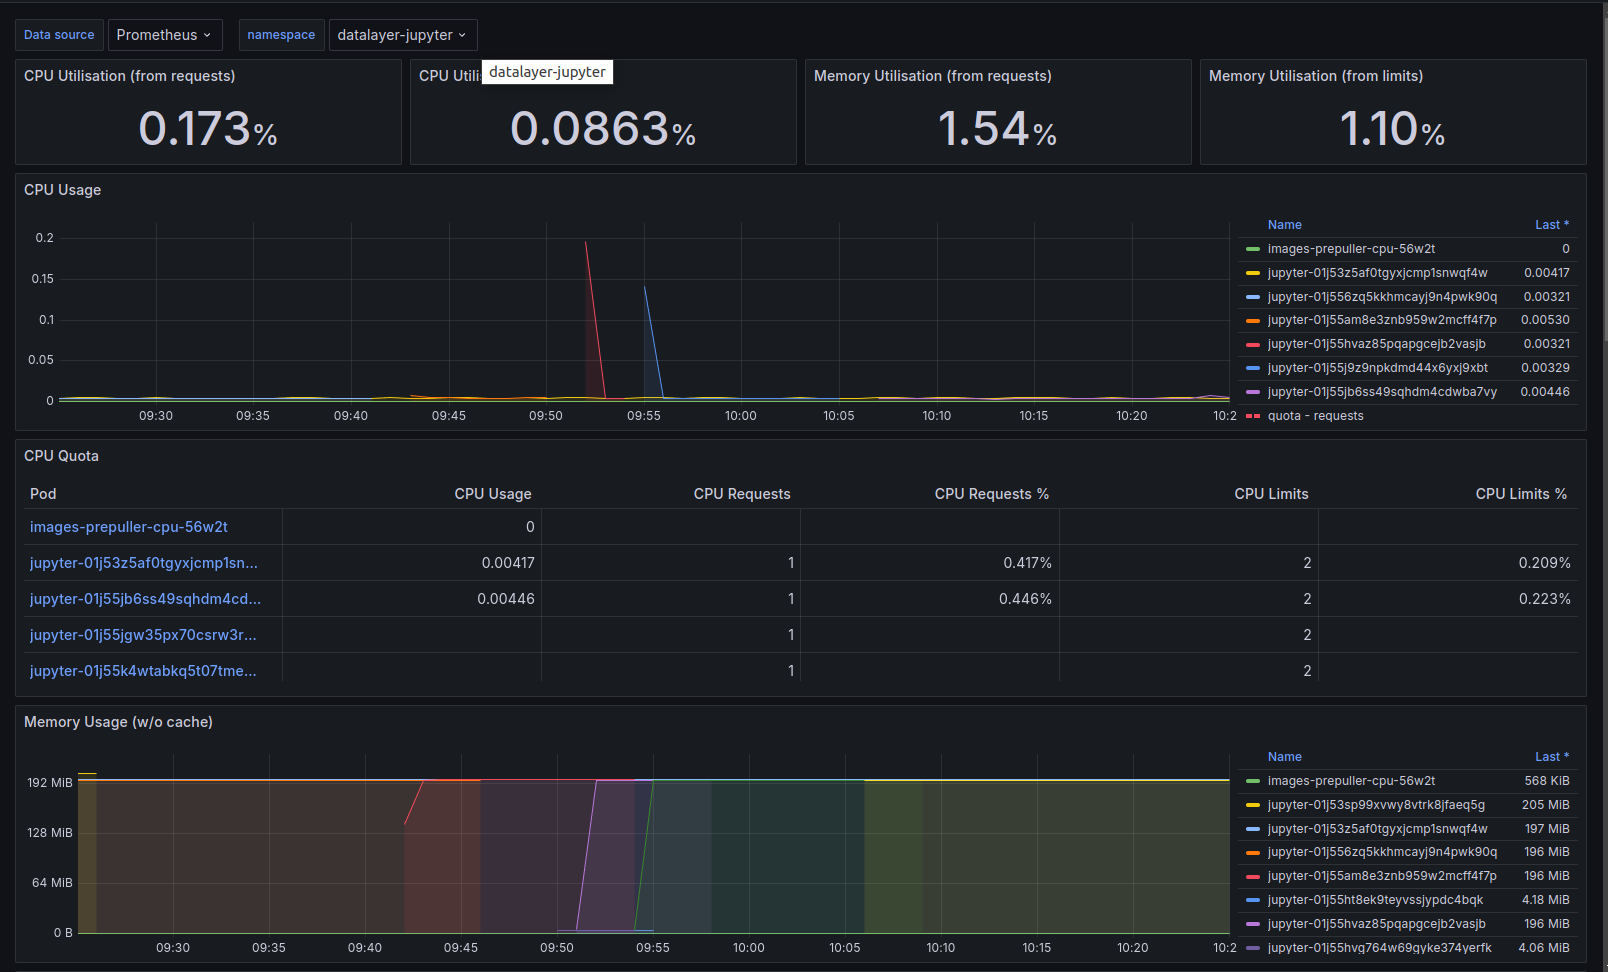
This repository contains the dashboard definitions for the Datalayer Observer service. Read more on [Datalayer Tech](https://datalayer.tech/docs/build/kubernetes/services/system/observer). We are using the following tools to create the dashboards:
- `OpenTelemetry Collector`:
- As deployment to proxy metrics and traces from Datalayer services to Prometheus and Tempo.
- As daemonset to parse pod log files and send them to Loki.
- `Prometheus`: To gather metrics.
- `Tempo`: To gather traces.
- `Loki`: To gather logs.
- `AlertManager`: To manage alerts.
- `Grafana`: To visualize and analyze the telemetry.
### Services
### Overall View
### Detailed View