https://github.com/datamade/look-at-cook
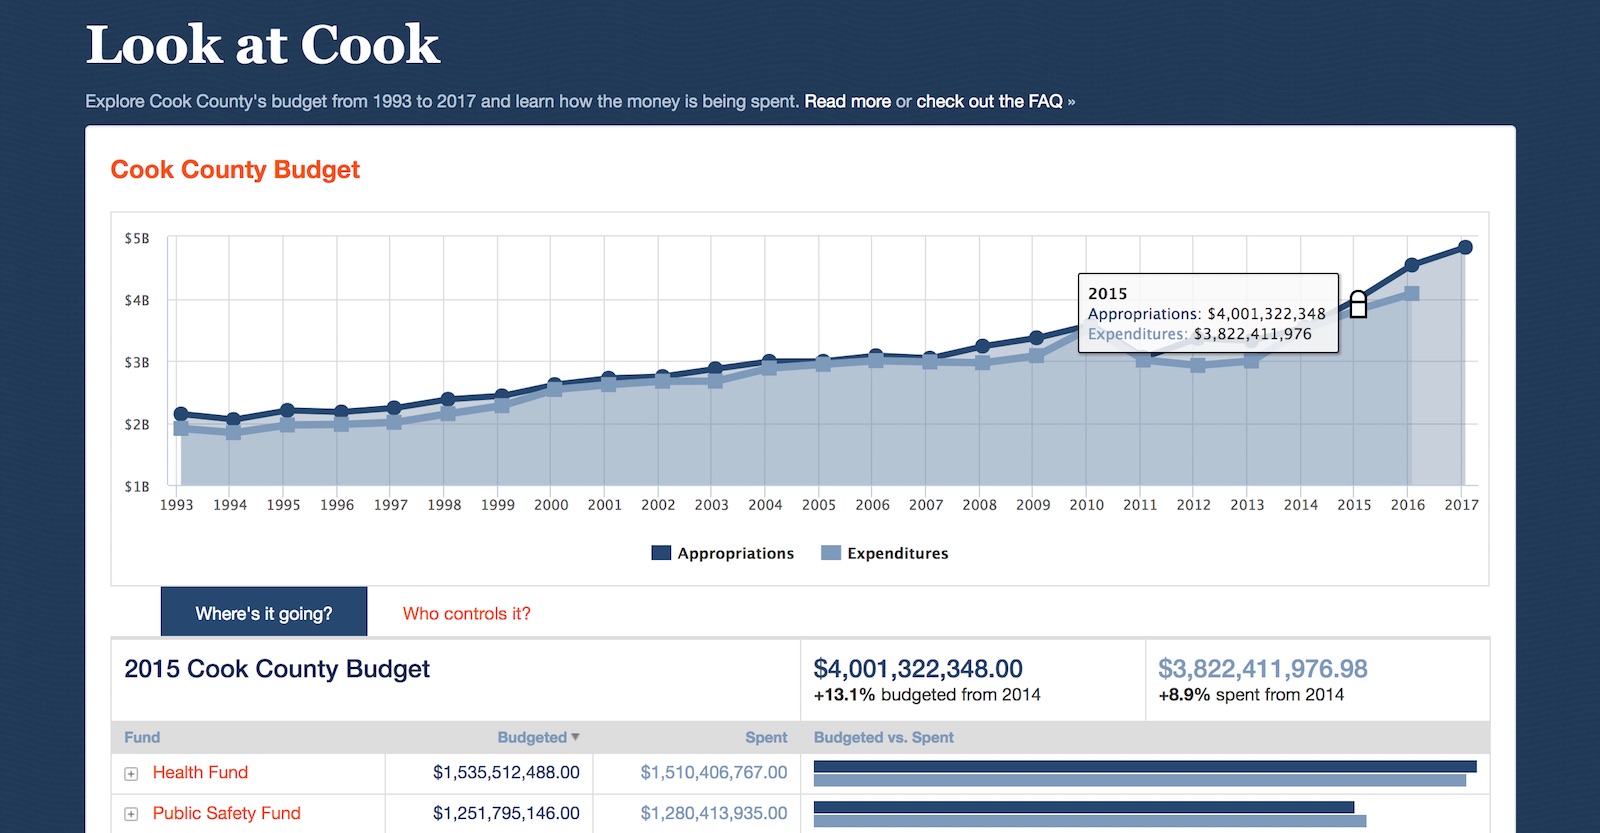
Explore Cook County's budget from 1993 to 2017 and learn how the money is being spent.
https://github.com/datamade/look-at-cook
Last synced: about 1 year ago
JSON representation
Explore Cook County's budget from 1993 to 2017 and learn how the money is being spent.
- Host: GitHub
- URL: https://github.com/datamade/look-at-cook
- Owner: datamade
- License: other
- Created: 2011-10-15T18:36:54.000Z (over 14 years ago)
- Default Branch: main
- Last Pushed: 2023-06-06T20:40:23.000Z (about 3 years ago)
- Last Synced: 2025-03-24T16:37:28.446Z (over 1 year ago)
- Language: JavaScript
- Homepage: http://lookatcook.org
- Size: 3.2 MB
- Stars: 36
- Watchers: 6
- Forks: 36
- Open Issues: 1
-
Metadata Files:
- Readme: README.md
- License: LICENSE.md
Awesome Lists containing this project
README
[Look at Cook](http://lookatcook.org)
=====================================
A budget transparency visualization for Cook County, IL (Chicago's county) displaying all county departments broken down by fund and control officer from 1993 to 2017. Originally done as a collaboration with Cook County Commissioner John Fritchey.
## Press
- [O'reilly Radar](http://radar.oreilly.com/2011/09/look-at-cook-gov-data-visualization.html)
- [govfresh](http://govfresh.com/2011/09/beautiful-budgets-look-at-cook/)
- [Civic Commons](http://civiccommons.org/2011/11/look-at-cook-open-sourced/)
- [Metafilter Projects](http://projects.metafilter.com/3241/Look-at-Cook-A-Budget-Visualization-for-Cook-County-IL)
#### Dependencies
- [jQuery](http://jquery.com)
- [D3](http://d3js.org) (for CSV manipulation)
- [Backbone](http://backbonejs.org/) (javascript MVC framework)
- [Highcharts](http://www.highcharts.com/) (charting library)
- [Datatables](http://datatables.net) (sortable HTML tables)
## How to Re-Deploy
This code can be customized to visualize another data set.
####Data Prepatation
The budget data can be in various forms (csv, google doc, google fusion table), but must adhere to a fixed format in order for the app to process it properly. Budget column headers include: Fund ID, Fund, Results Area, Department ID, Department, Short Title, Link to Website, Department Description, and Control Officer. Values for appropriations and expenditures must be broken down into a separate column for each year.
See examples of prepped data:
- [New Orleans](https://docs.google.com/spreadsheet/ccc?key=0AswuyKhD7LxVdGlERGdEckpaRDc4Q1RCN0tjZ2tMMGc&usp=sharing_eil#gid=0)
- [Macoupin County](https://github.com/datamade/macoupin-budget/blob/master/data/macoupin-budget_1997-2014.csv)
- [A blank template to populate](https://docs.google.com/spreadsheets/d/1I6xZe8syHTiLguZ56l6J1KW0nAJVrUilvq0eP-BpE2A/edit?usp=sharing)
####Configuration
1. Once the data is prepared, set dataSource in js/app.js to link up to your data.
*If your budget data is in CSV form:*
Drop the csv file in the data folder, and set dataSource to the file path.
*If your data is in a google doc:*
You will first need to publish the google doc to the web as a CSV. Then, set dataSource to the URL provided.


2. Next, set the following configuration variables at the top of js/app.js:
- startYear
- endYear
- activeYear
- municipalityName
## Errors / bugs
If something is not behaving intuitively, it is a bug, and should be [reported as an issue](https://github.com/datamade/look-at-cook/issues)
You can also email info@datamade.us.
## Note on patches/pull requests
* Fork the project.
* Make your feature addition or bug fix.
* Commit and send me a pull request. Bonus points for topic branches.
Copyright
---------
Copyright © 2019 DataMade (datamade.us), Derek Eder, Nick Rougeux and Open City. Released under the MIT License.
See LICENSE for details https://raw.githubusercontent.com/datamade/look-at-cook/master/LICENSE.md