https://github.com/datarohit/stockastic-revamped
Stockastic is a stock monitoring platform that provides investment insights with secure user authentication. Users can track their favorite stocks and visualize performance through interactive Plotly graphs.
https://github.com/datarohit/stockastic-revamped
celery daisyui django mailpit minio nginx postgresql redis tailwindcss
Last synced: 3 months ago
JSON representation
Stockastic is a stock monitoring platform that provides investment insights with secure user authentication. Users can track their favorite stocks and visualize performance through interactive Plotly graphs.
- Host: GitHub
- URL: https://github.com/datarohit/stockastic-revamped
- Owner: DataRohit
- Created: 2025-01-01T06:06:32.000Z (over 1 year ago)
- Default Branch: master
- Last Pushed: 2025-01-10T11:26:23.000Z (over 1 year ago)
- Last Synced: 2025-01-10T12:29:29.361Z (over 1 year ago)
- Language: CSS
- Size: 941 KB
- Stars: 1
- Watchers: 1
- Forks: 0
- Open Issues: 0
-
Metadata Files:
- Readme: readme.md
Awesome Lists containing this project
README
# Stockastic Revamped 📈
A comprehensive stock monitoring platform providing real-time investment insights with secure authentication. Track your favorite stocks and visualize performance through interactive Plotly graphs with advanced technical analysis capabilities.
## ✨ Features
- **Real-time Data Streaming**: Utilizing WebSockets for live market updates
- **Comprehensive Market Coverage**:
- Indices tracking
- Top gainers and losers
- BSE and NSE equity stocks
- **Interactive Visualization**: Plotly-powered charts for detailed market analysis
- **Smart Stock Management**:
- Bookmark/unbookmark stocks and indices to track favorites
- Advanced playground mode for technical analysis
- **Dual Exchange Support**: Toggle between BSE and NSE for equity stocks
- **Multiple Index Categories**: Various index options sourced from NSE Python and BSE website
- **Modern UI/UX**: Responsive and intuitive interface styled with Tailwind CSS and DaisyUI components
## 🎮 Technical Analysis Playground
- **Historical Data Analysis**:
- Customizable time periods (1d, 5d, 1mo, 3mo, 6mo, 1y, 2y, 5y, max)
- Flexible intervals (1m, 2m, 5m, 15m, 30m, 60m, 90m, 1h, 1d, 5d, 1wk, 1mo, 3mo)
- **40+ Technical Indicators** including:
- Moving Averages (SMA, EMA, WMA)
- Oscillators (RSI, MACD, Stochastic)
- Volatility Indicators (Bollinger Bands, ATR)
- Volume Indicators (OBV, Volume Profile)
- Trend Indicators (ADX, Parabolic SAR)
- **Interactive Visualization**:
- Overlay multiple indicators
- Dynamic chart updates
- Customizable indicator parameters
## 📊 Data Visualization
- Interactive Plotly charts for each index/equity stock
- Detailed view combining charts with comprehensive stock information
- Real-time data updates through WebSocket connections
- Technical analysis visualization in playground mode
## 🛠️ Technology Stack
### Core
- Django 4.2.17
- Python 3.13.1
- WebSockets (websockets 14.1)
- Plotly 5.24.1
- Redis 5.2.1
### Frontend
- Tailwind CSS 3.4.1
- DaisyUI 4.7.2
- HTML5/CSS3
- JavaScript
### Infrastructure
- PostgreSQL (Database)
- MinIO (Storage)
- Nginx (Web Server)
### Data Sources
- NSE Python (2.94)
- yfinance (0.2.51)
## 📝 Requirements
A comprehensive list of Python dependencies is maintained in `requirements.txt`. Key packages include:
- Django and related packages (django-cors-headers, django-redis, etc.)
- Data processing tools (pandas, numpy)
- Visualization libraries (plotly)
- Technical analysis libraries (ta)
- WebSocket support
- Database connectors
- Development and testing utilities
## 🤝 Contributing
1. Fork the repository
2. Create your feature branch (`git checkout -b feature/AmazingFeature`)
3. Commit your changes (`git commit -m 'Add some AmazingFeature'`)
4. Push to the branch (`git push origin feature/AmazingFeature`)
5. Open a Pull Request
## 📄 License
This project is licensed under the MIT License - see the `license` file for details.
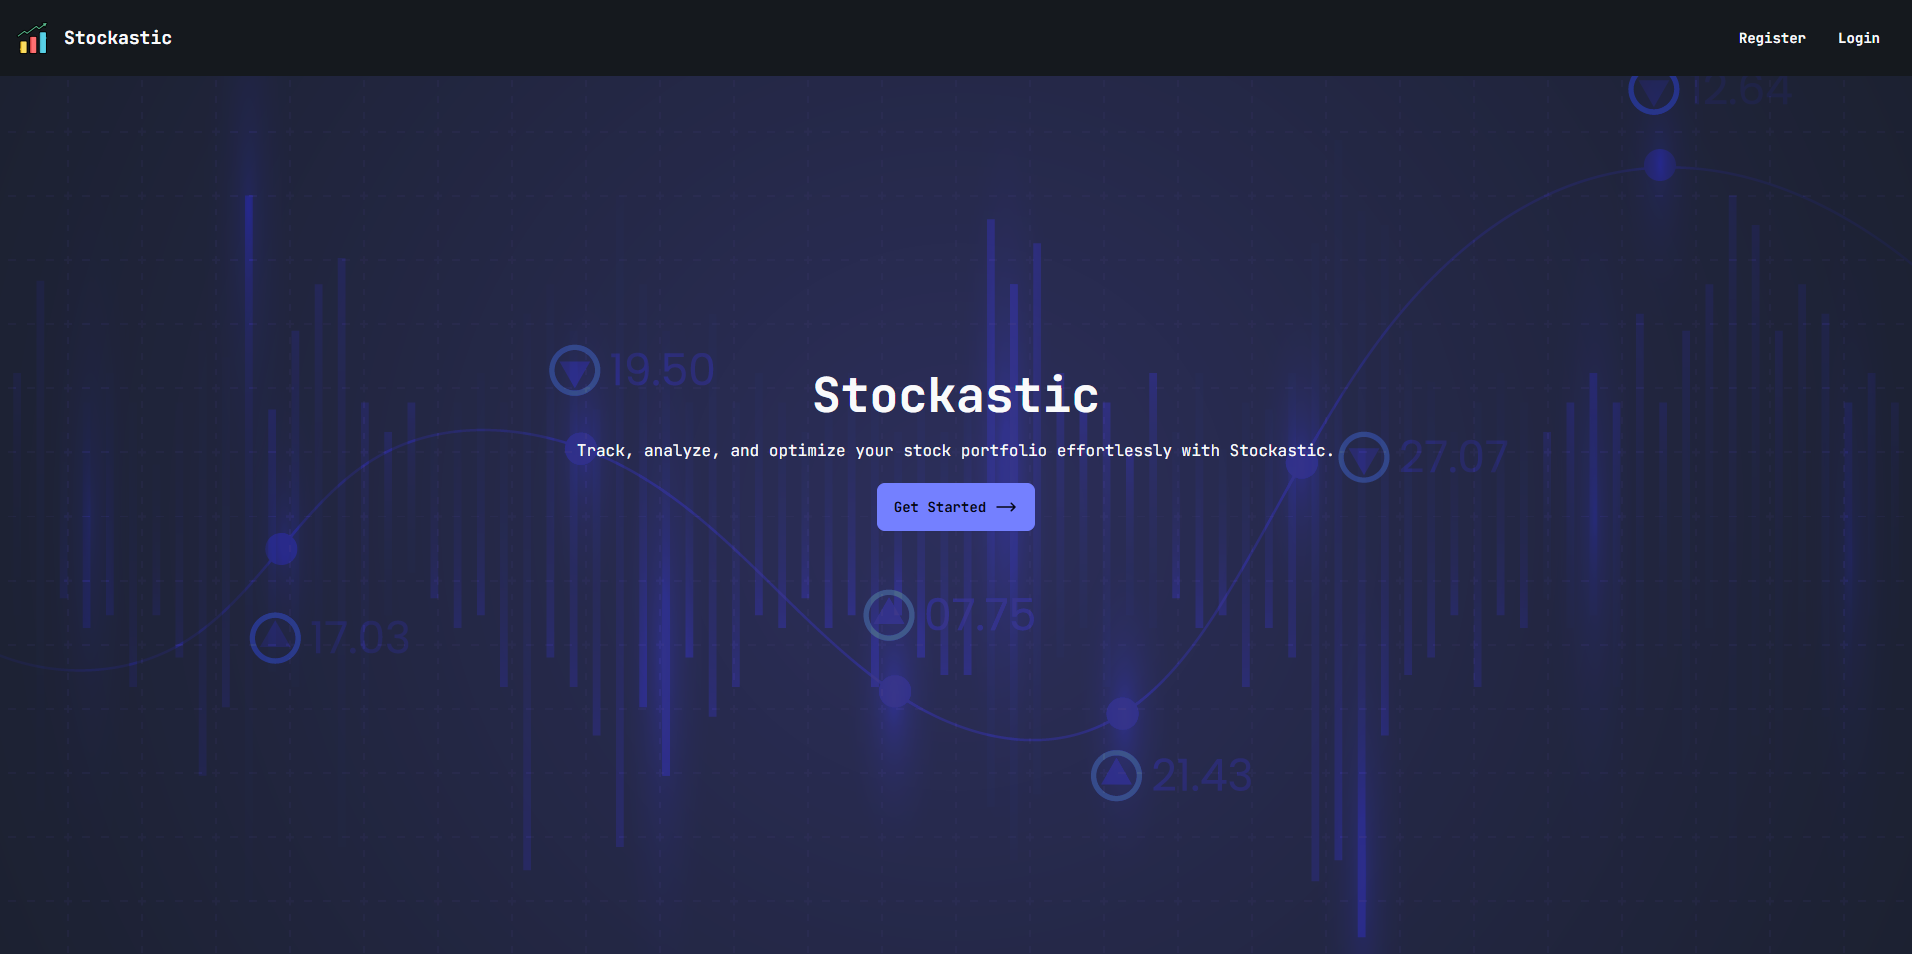
## 🖥️ Project Demo
#### Home / Landing Page
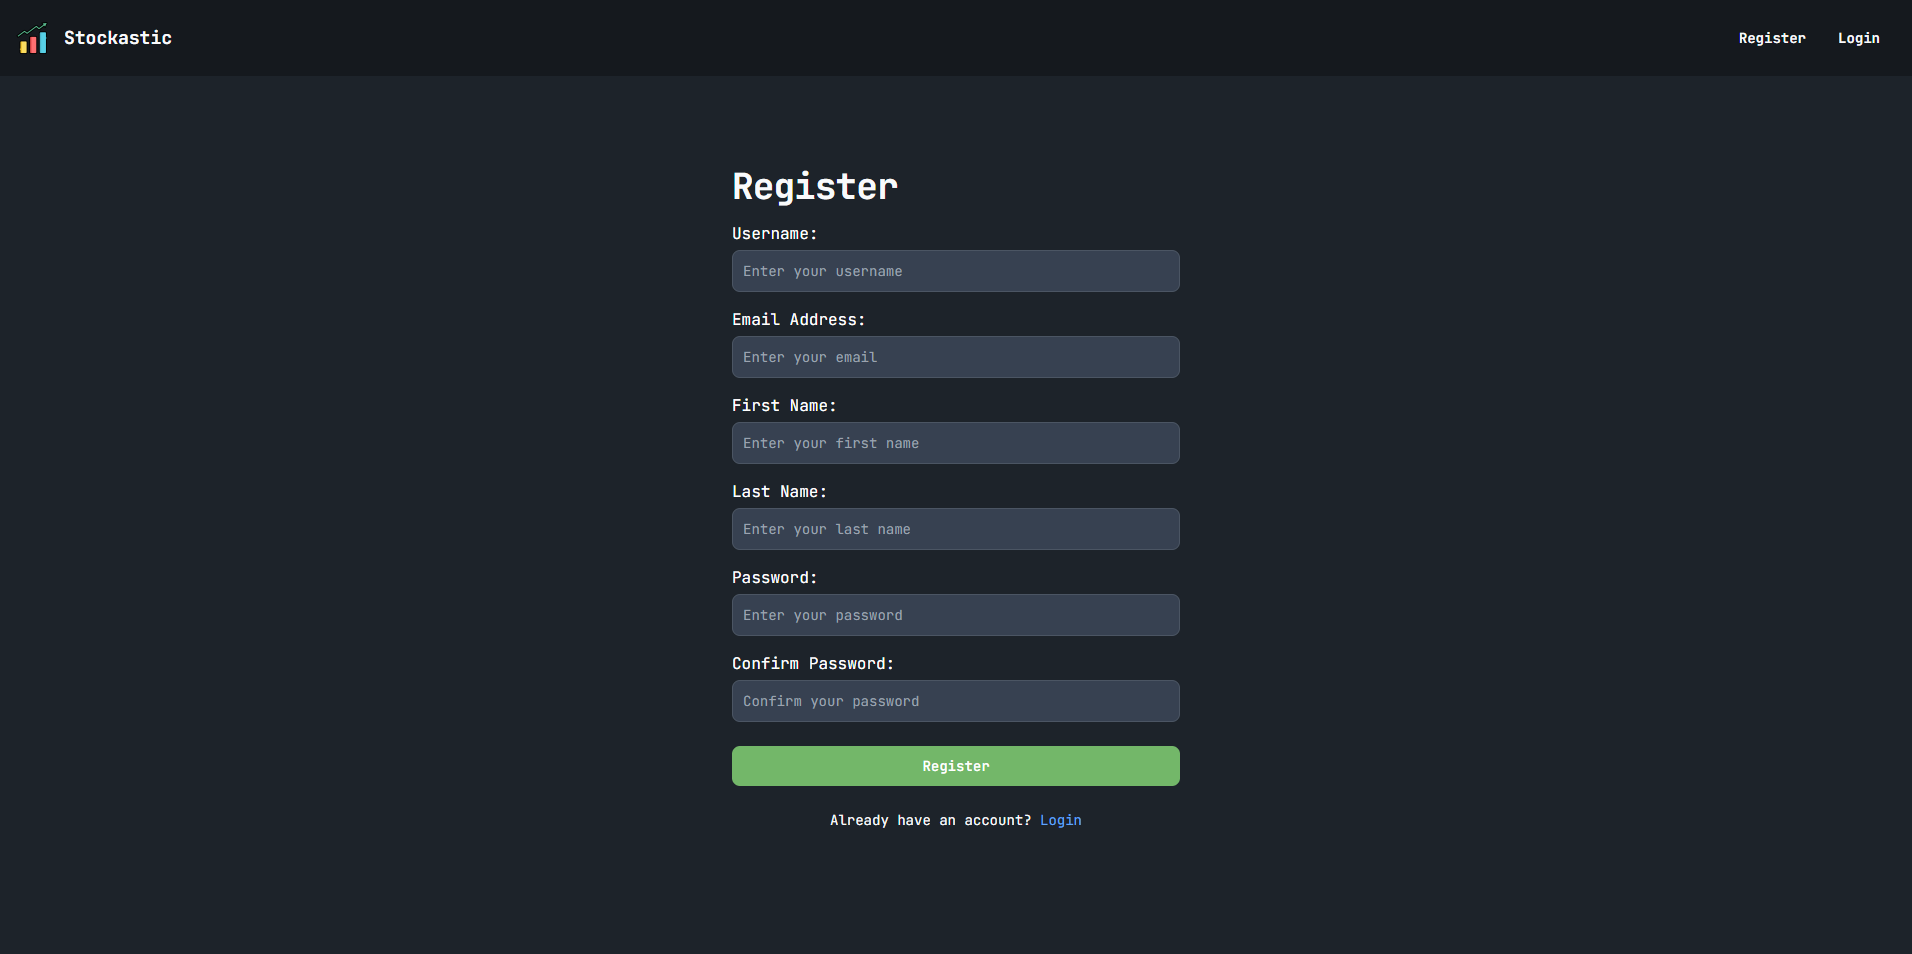
#### User Registration Page
#### User Login Page
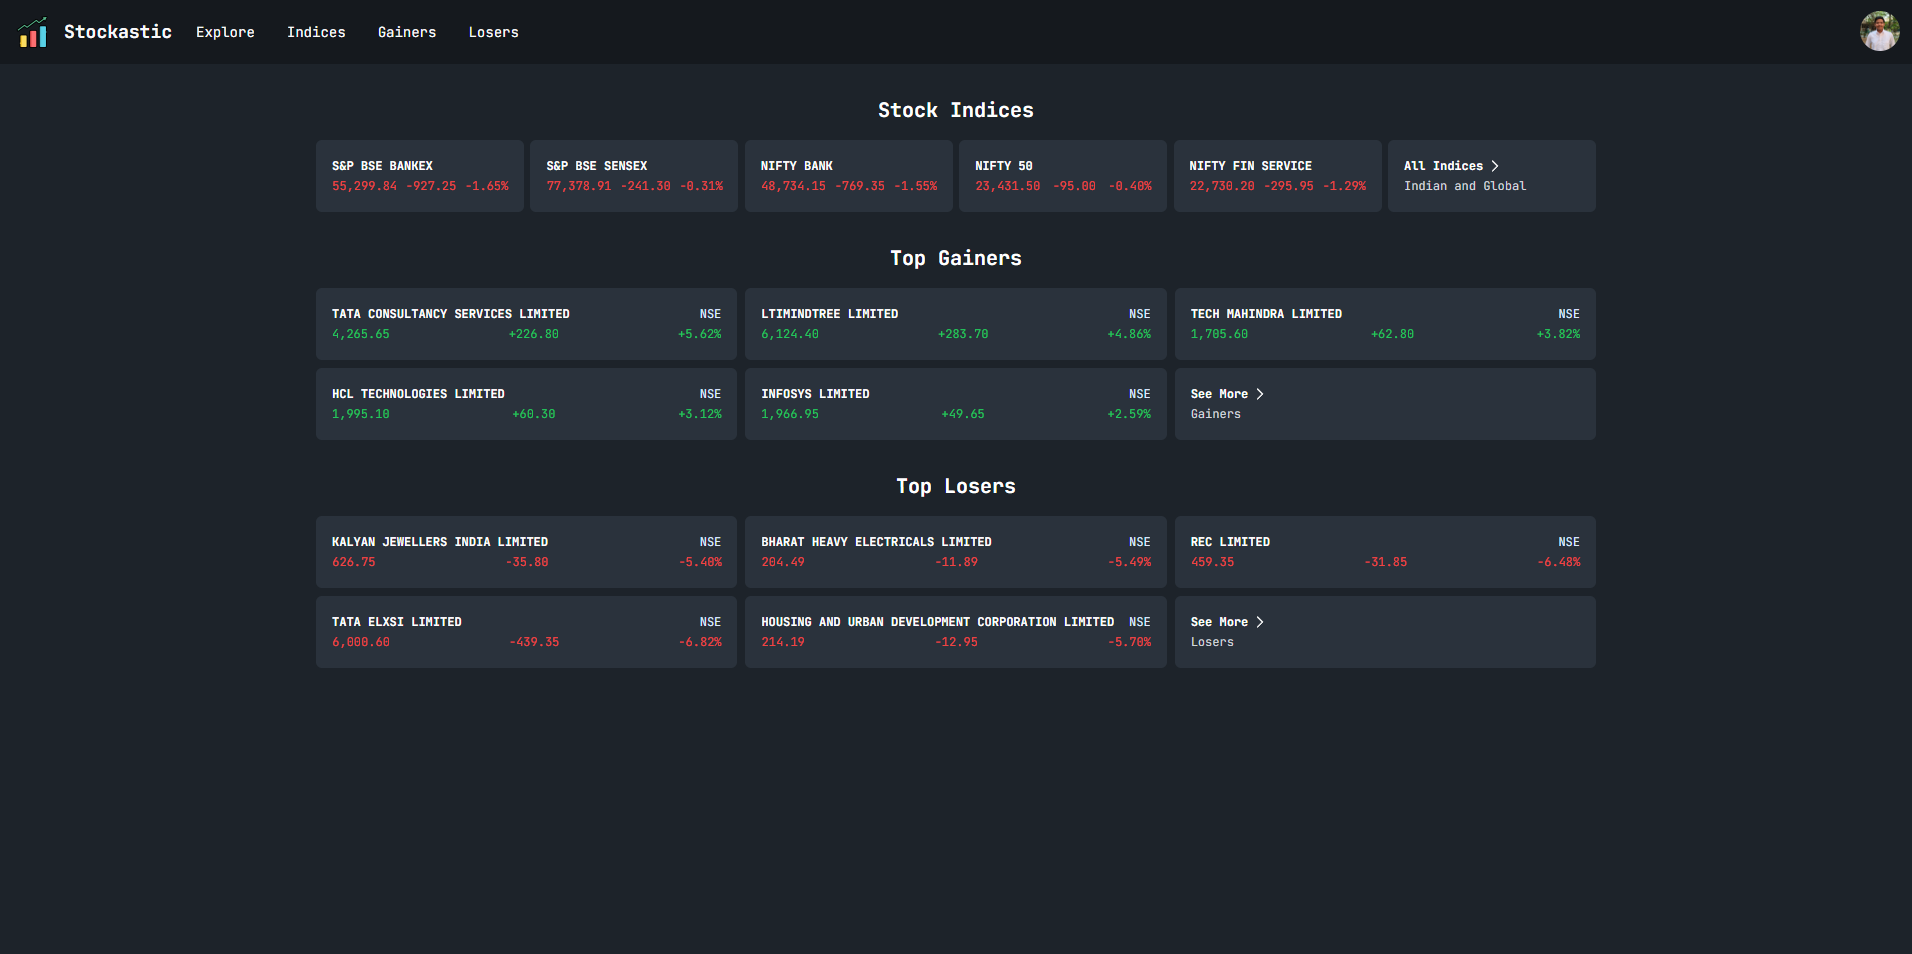
#### Explore Page
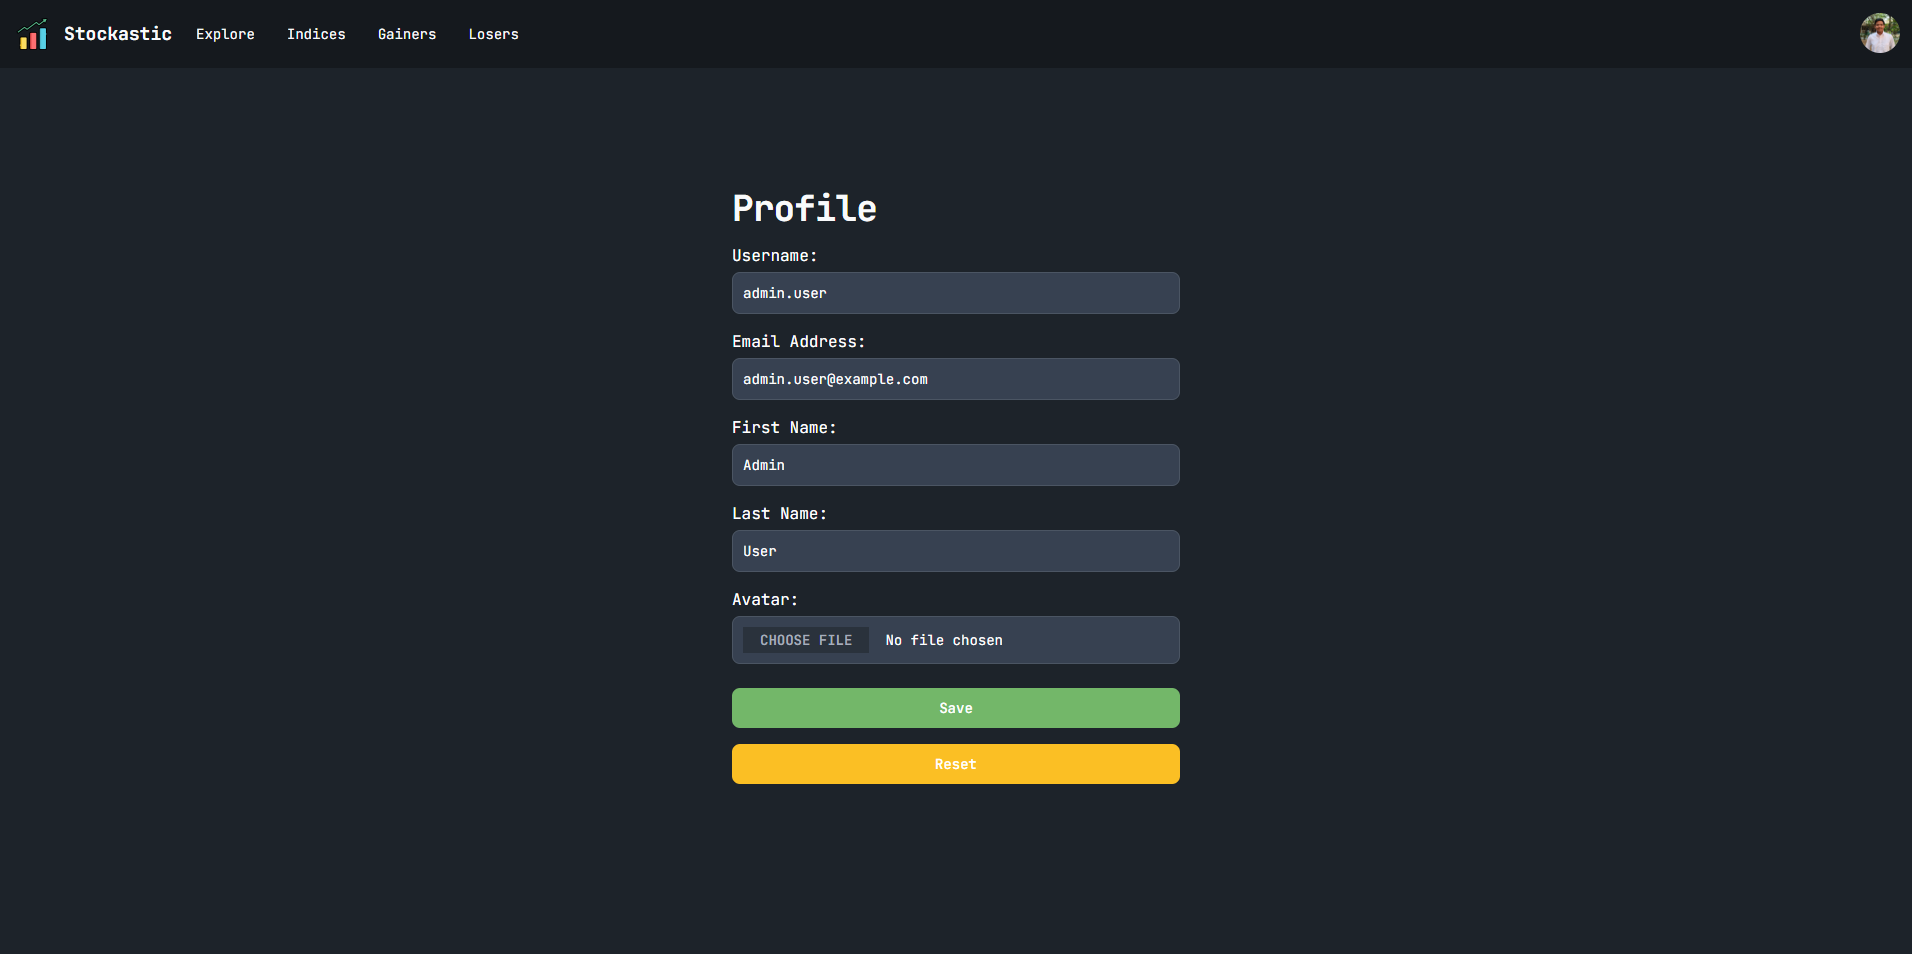
#### User Profile Update Page
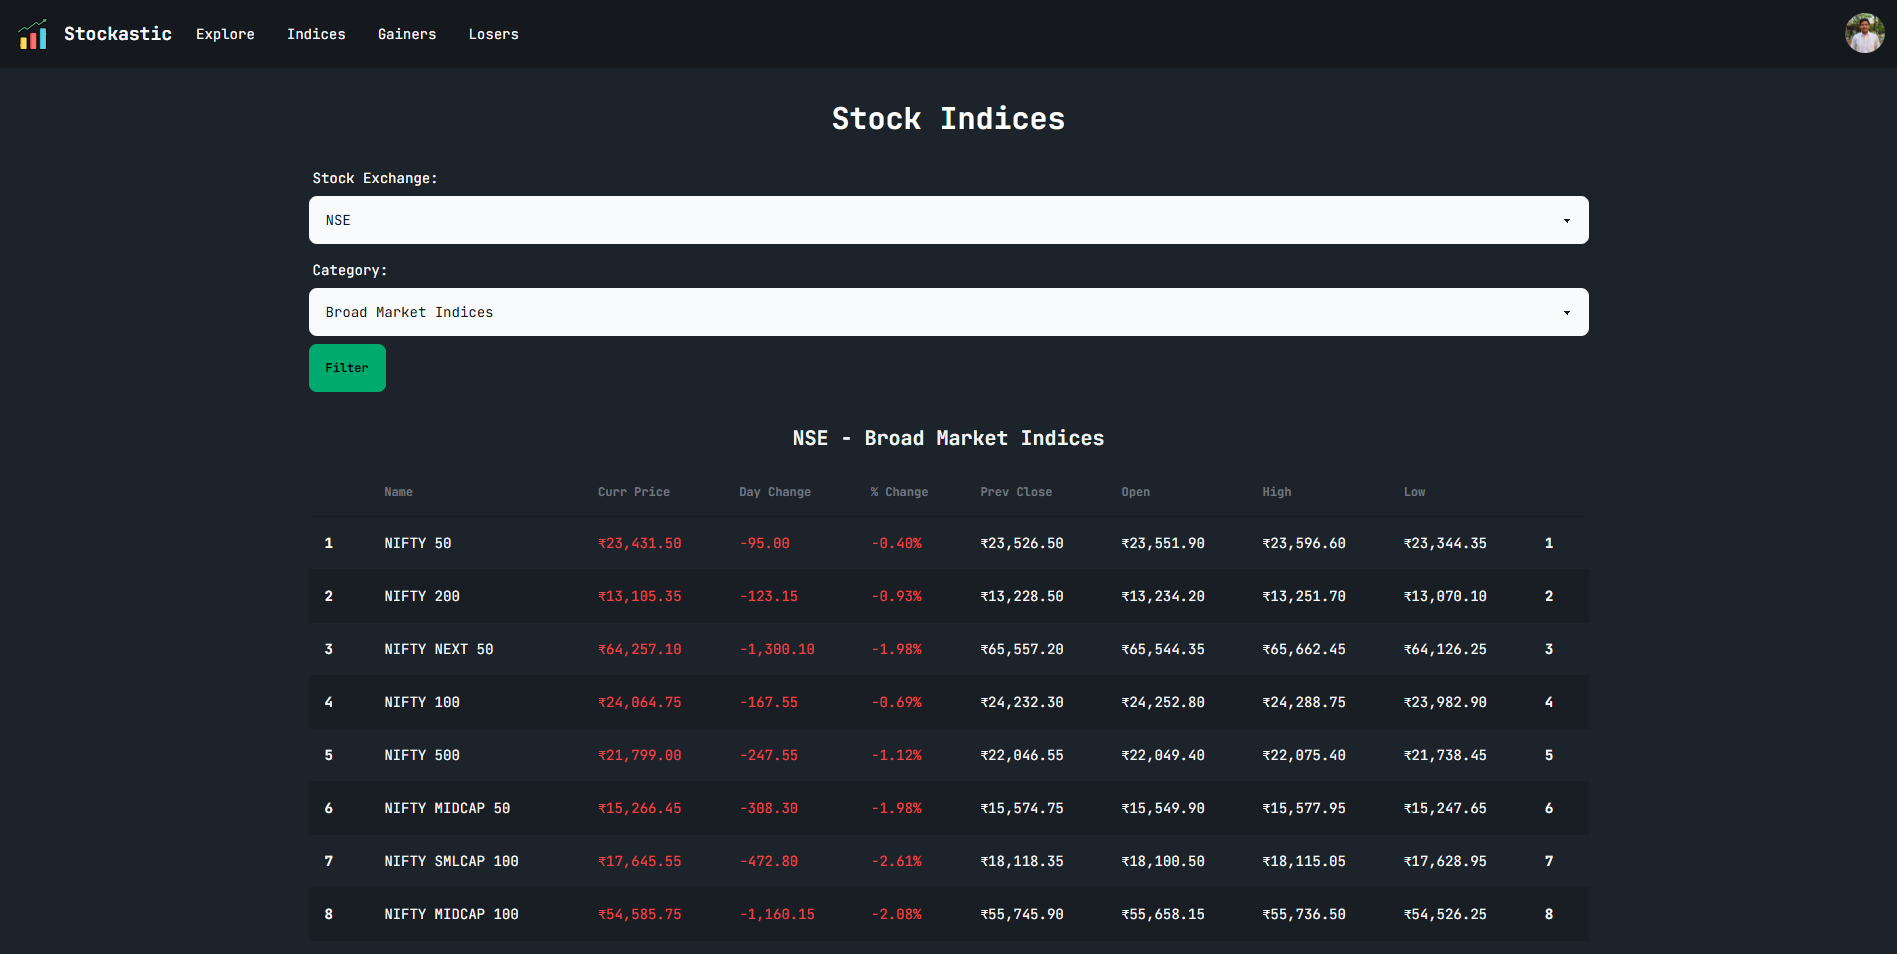
#### Indices List Page
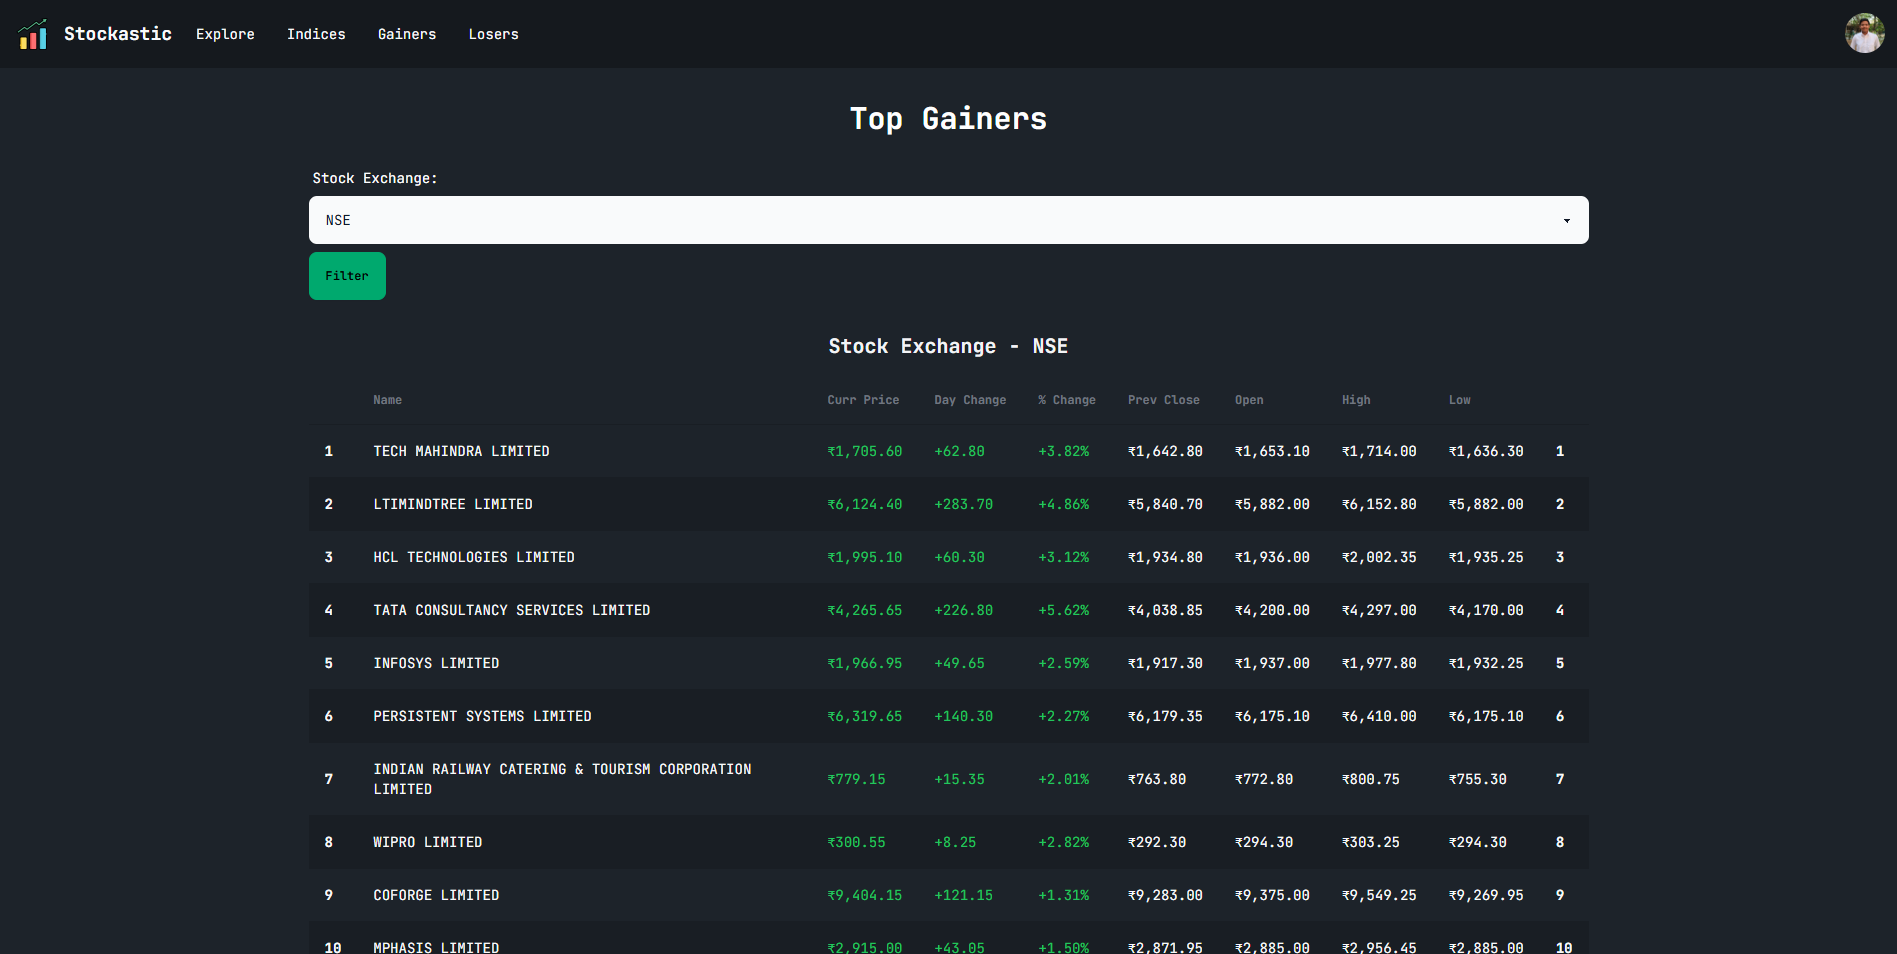
#### Top Gainers Page
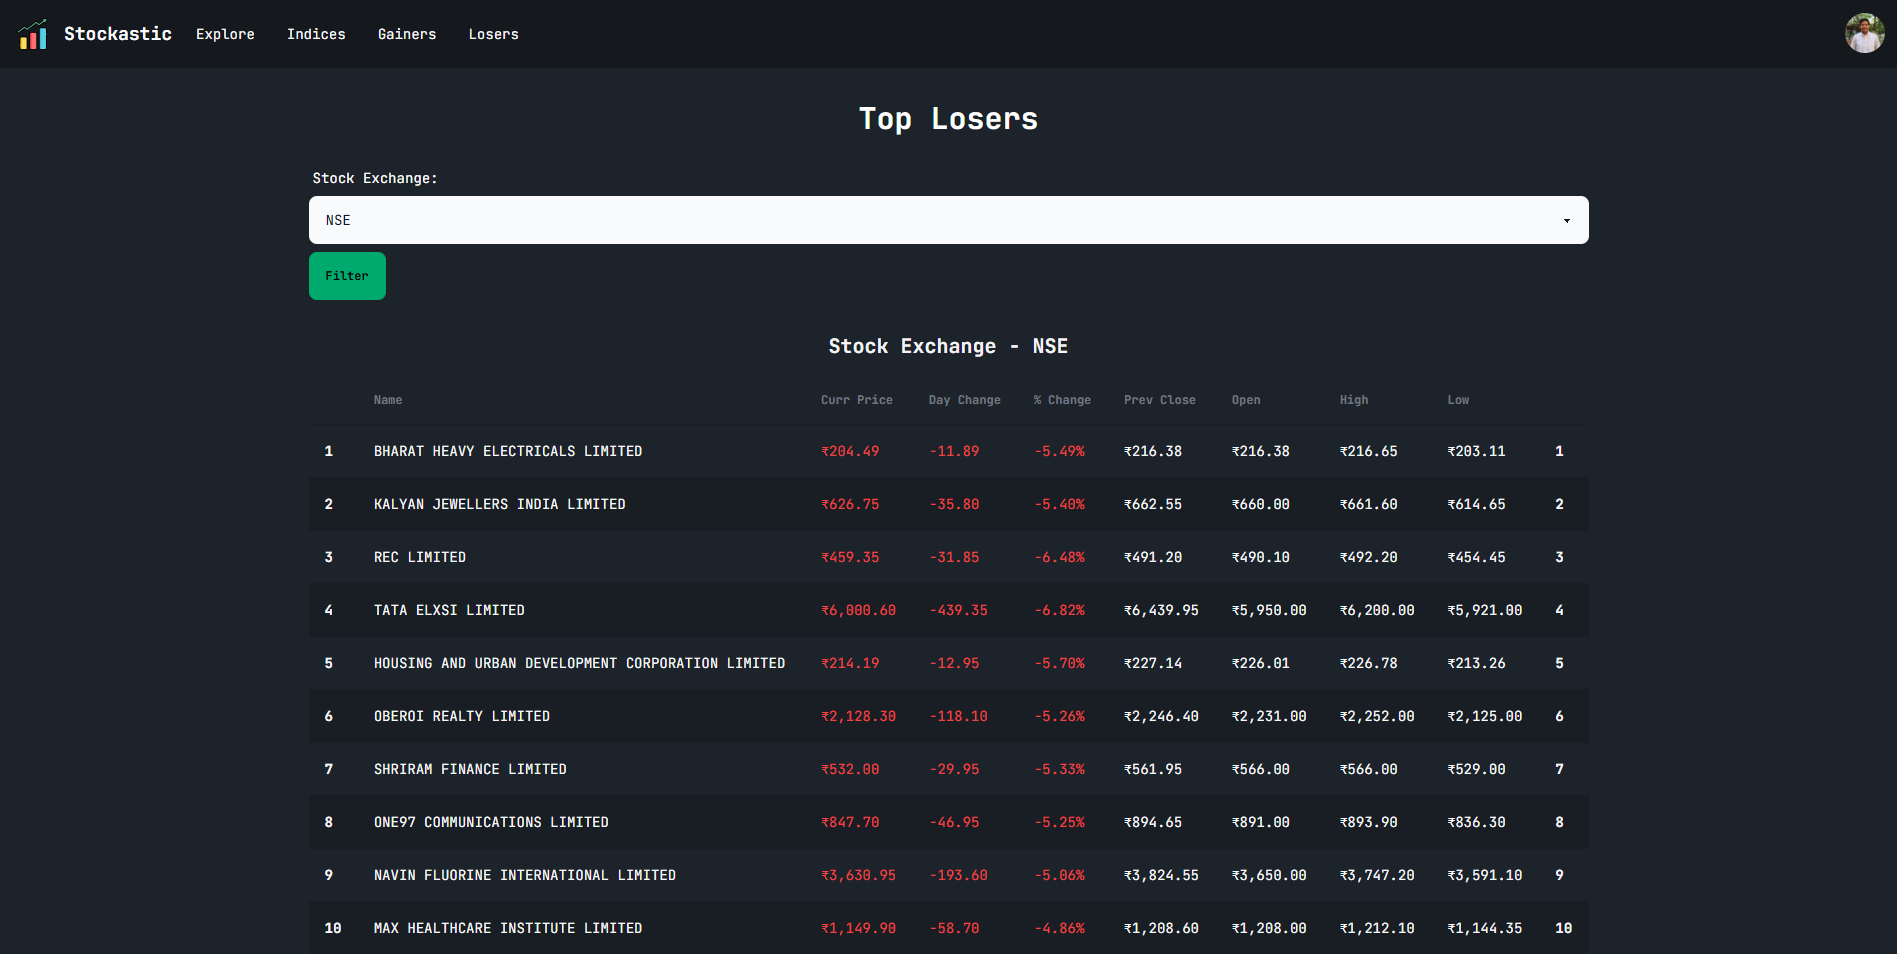
#### Top Losers Page
#### Index Detail Page
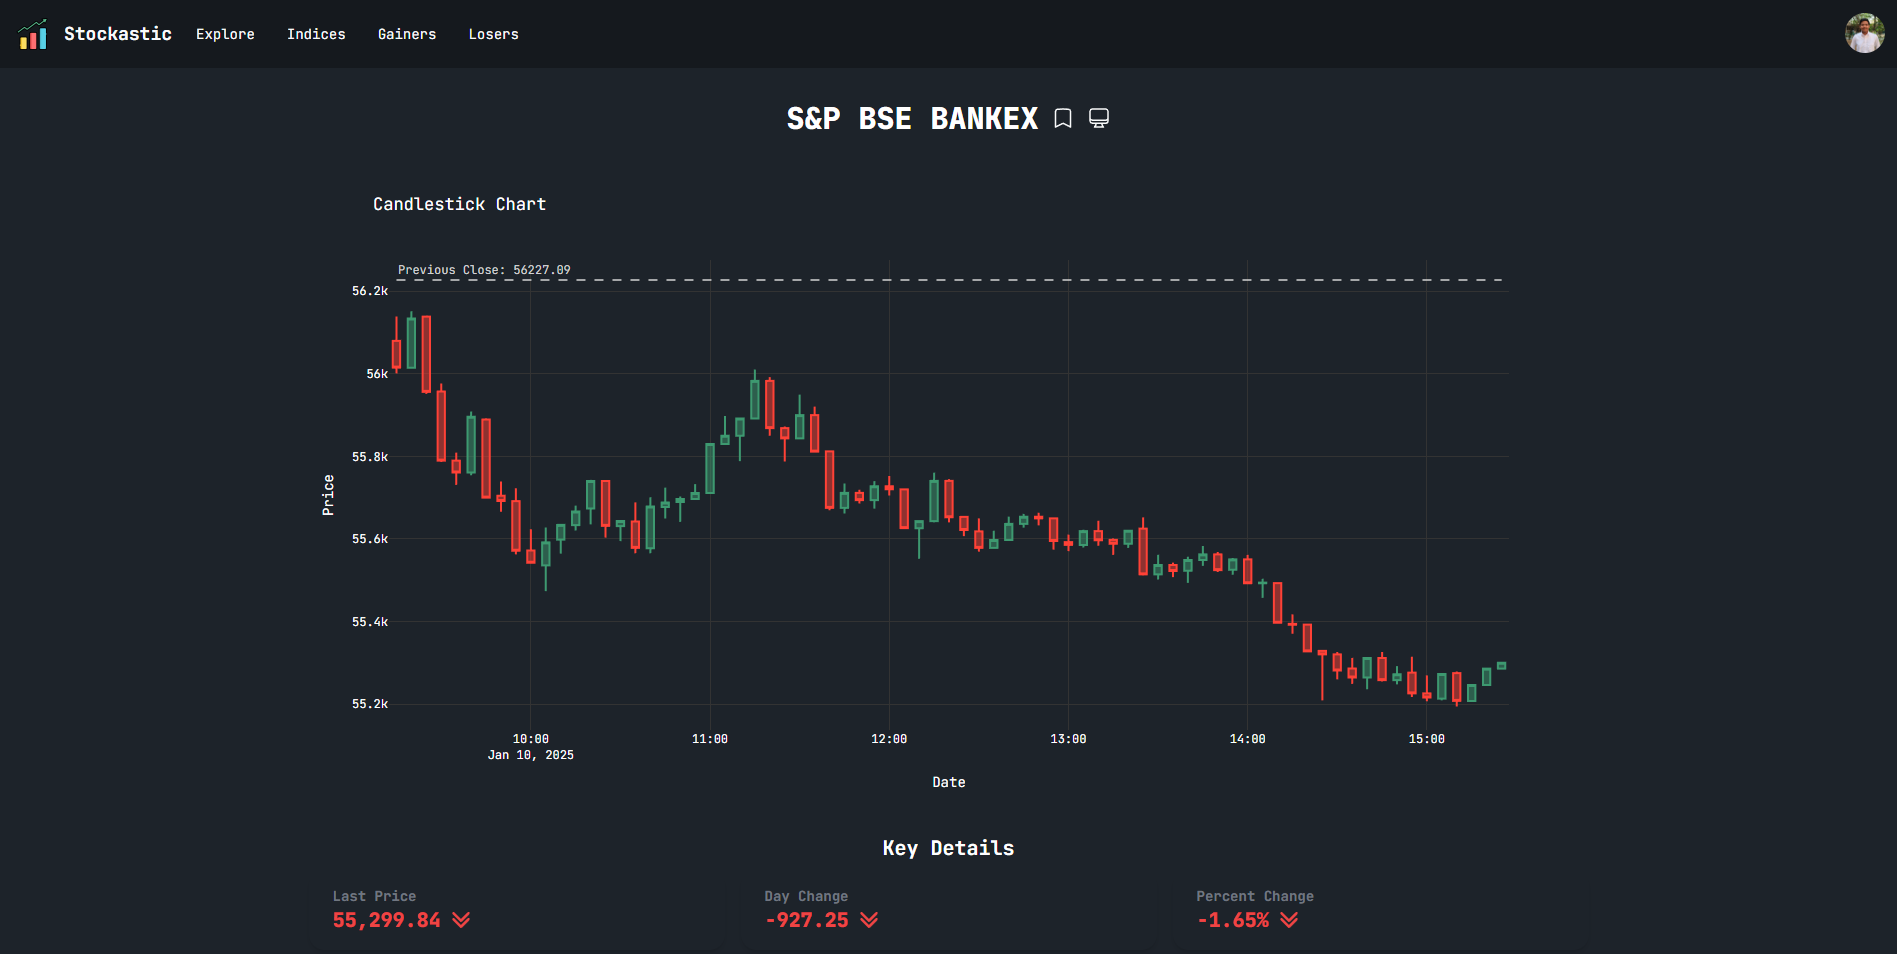
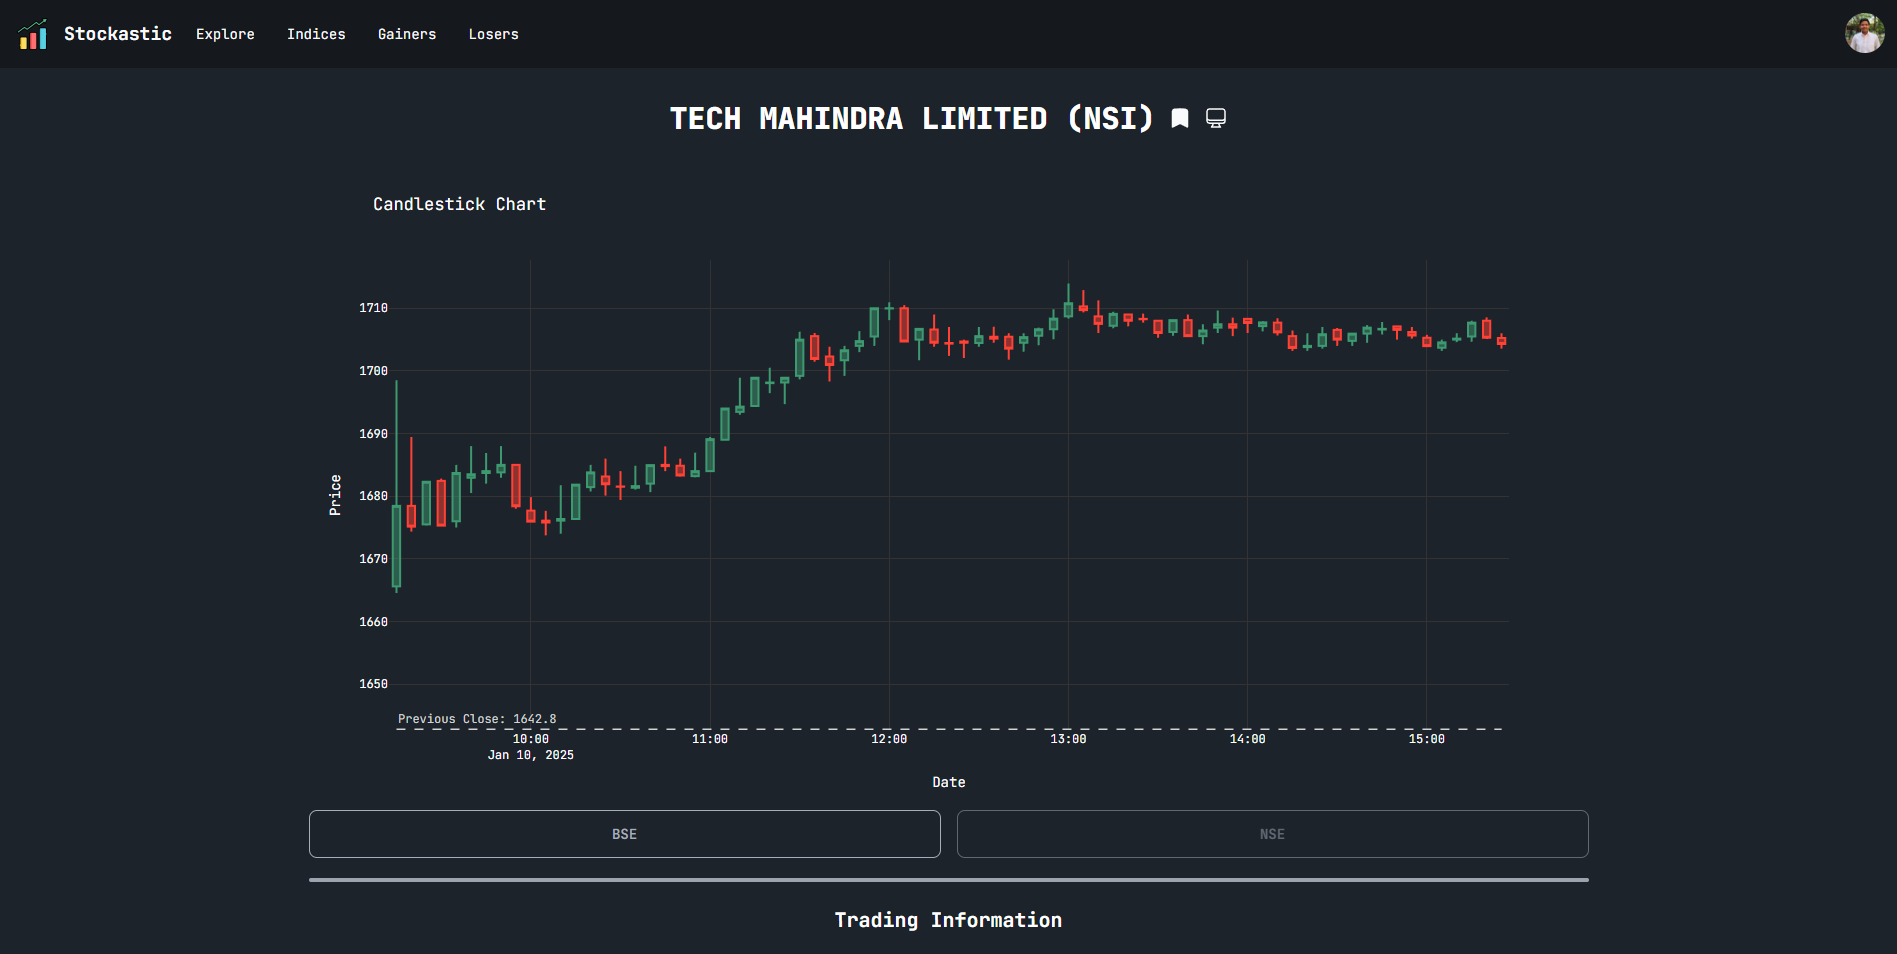
#### Equity Stock Detail Page
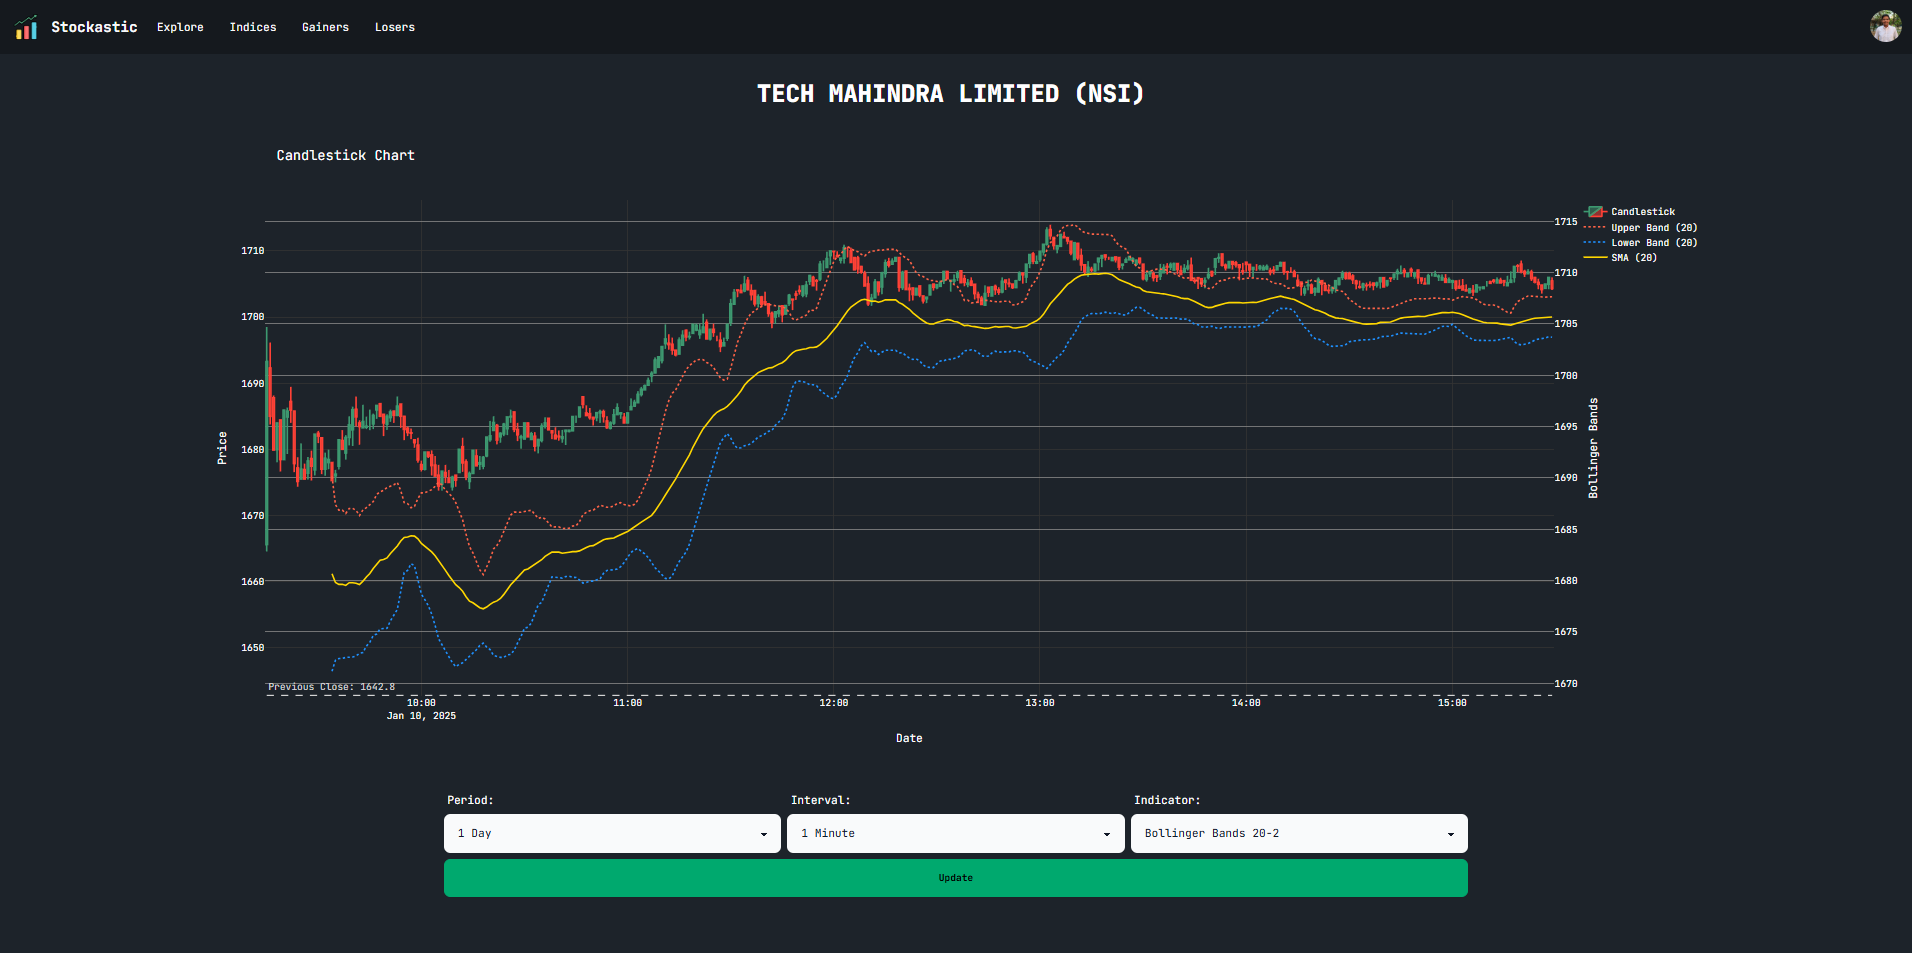
#### Playground Page
## 🙏 Acknowledgments
- NSE Python library contributors
- yfinance maintainers
- Django community
- TA contributors
- Tailwind CSS team
- DaisyUI contributors
- All contributors who have helped shape this project