https://github.com/datoviz/datoviz
⚡ Datoviz: high-performance GPU rendering for scientific data visualization
https://github.com/datoviz/datoviz
c cpp data-visualization data-viz gpu graphics python rendering scientific-computing scientific-visualization visualization vulkan
Last synced: 6 months ago
JSON representation
⚡ Datoviz: high-performance GPU rendering for scientific data visualization
- Host: GitHub
- URL: https://github.com/datoviz/datoviz
- Owner: datoviz
- License: mit
- Created: 2020-07-21T20:48:09.000Z (about 6 years ago)
- Default Branch: main
- Last Pushed: 2026-01-14T16:06:14.000Z (6 months ago)
- Last Synced: 2026-01-14T19:07:49.546Z (6 months ago)
- Topics: c, cpp, data-visualization, data-viz, gpu, graphics, python, rendering, scientific-computing, scientific-visualization, visualization, vulkan
- Language: C
- Homepage: https://datoviz.org
- Size: 41.6 MB
- Stars: 757
- Watchers: 23
- Forks: 39
- Open Issues: 8
-
Metadata Files:
- Readme: README.md
- Changelog: CHANGELOG.md
- Contributing: CONTRIBUTING.md
- License: LICENSE
- Citation: CITATION.cff
- Maintainers: MAINTAINERS.md
- Agents: AGENTS.md
Awesome Lists containing this project
- awesome-vulkan - datoviz - High-performance GPU interactive scientific data visualization with Vulkan. [MIT] (Libraries)
- awesome-eit - Datoviz
README
# Datoviz: high-performance GPU rendering for scientific data visualization
[**[Installation]**](#%EF%B8%8F-installation-instructions)
[**[Usage]**](#-usage)
[**[User guide]**](https://datoviz.org/guide/)
[**[Gallery]**](https://datoviz.org/gallery/)
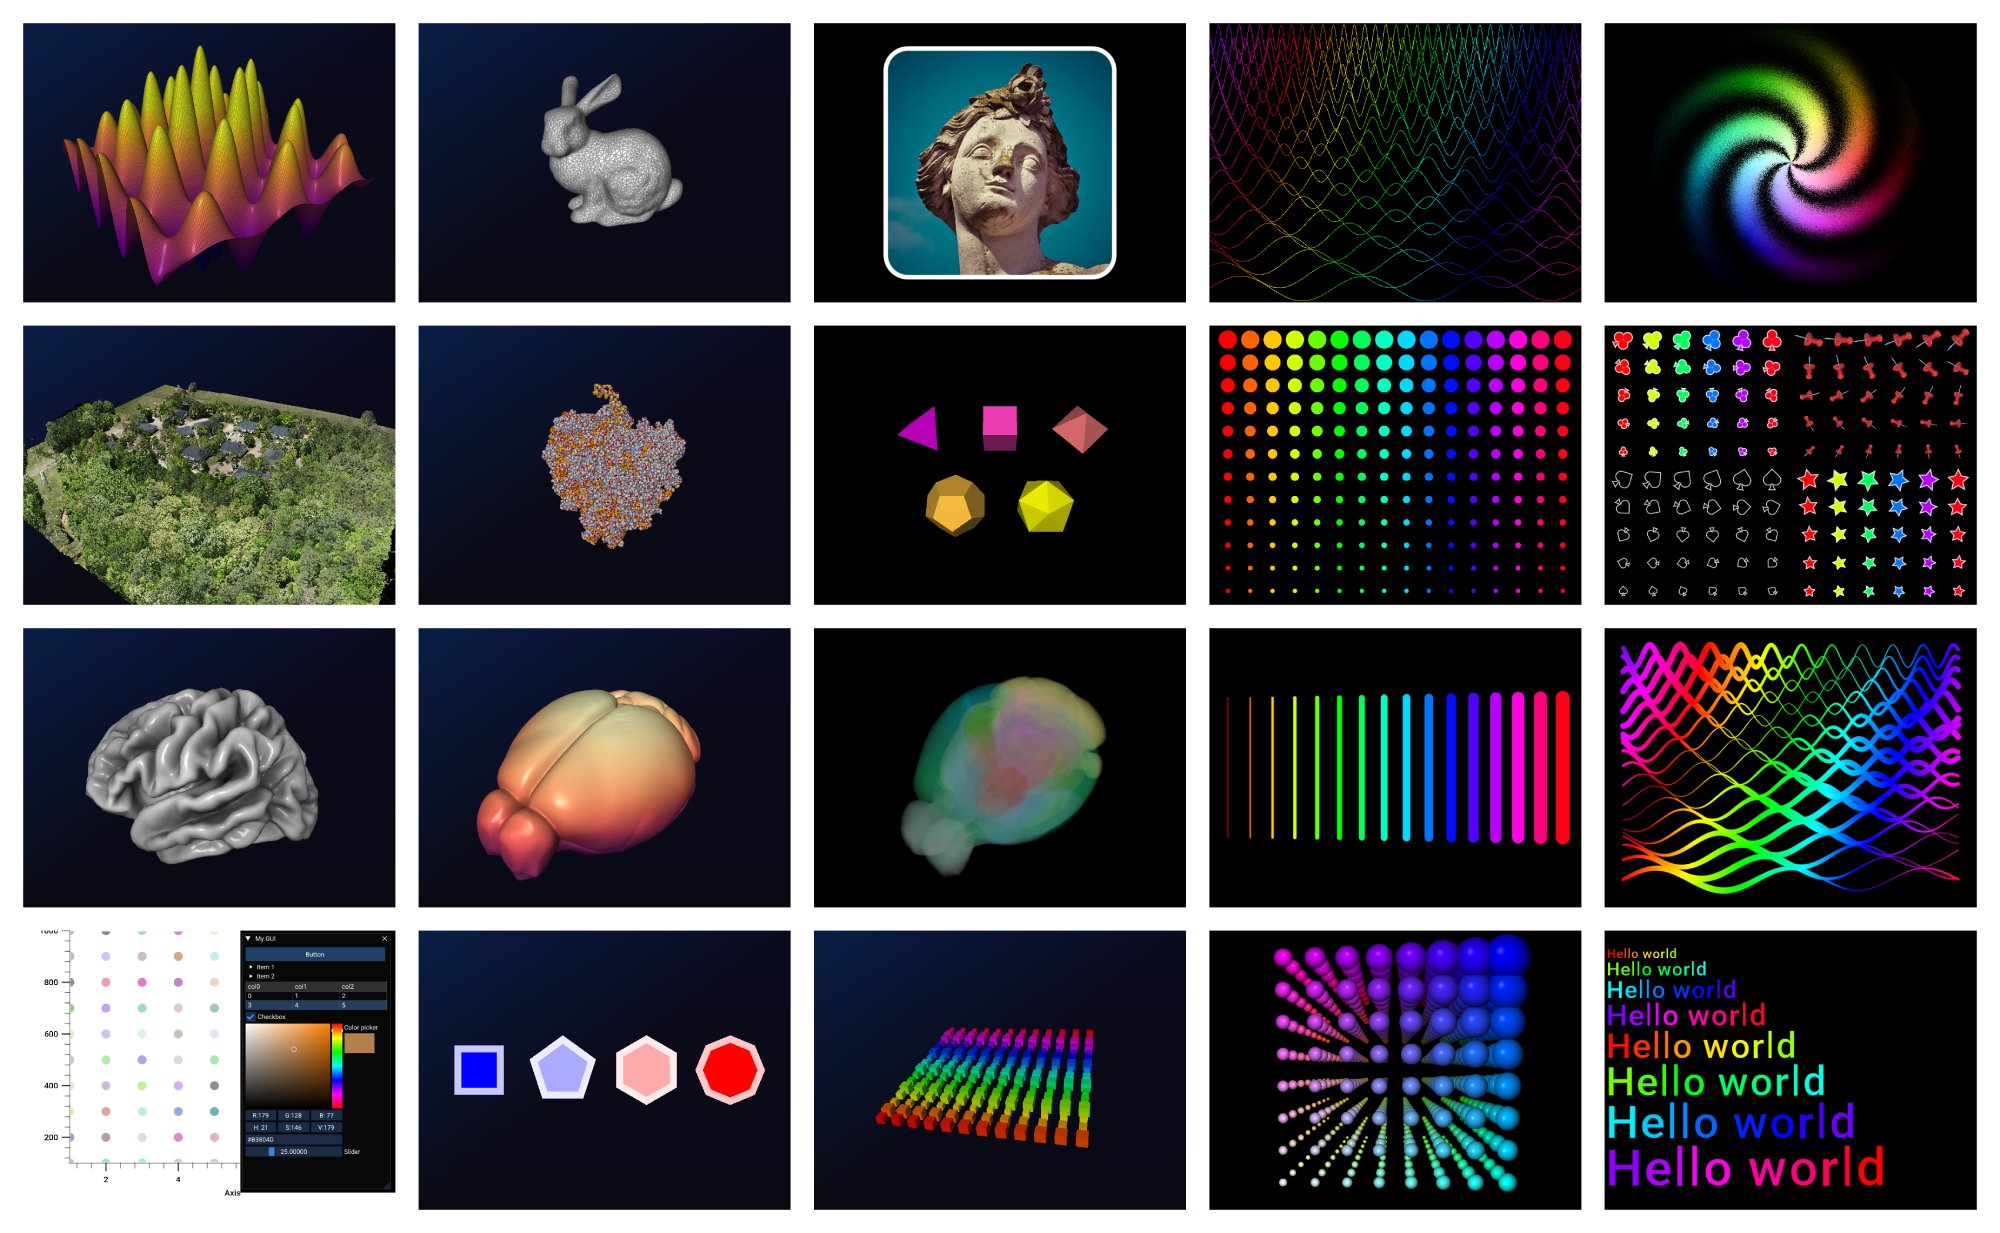
**⚡️ Datoviz** is an open-source, cross-platform, **high-performance rendering library for scientific data visualization** making extensive use of the graphics processing unit (GPU).
Up to **10,000x faster than matplotlib**, it delivers highly efficient **high-quality GPU rendering** of 2D and 3D graphical primitives—markers, paths, images, text, meshes, volumes, and more—that scale to millions of elements. Datoviz also supports **graphical user interfaces (GUIs)** for interactive visualization.
[](https://raw.githubusercontent.com/datoviz/data/master/hero.jpg)
Built from the ground up with performance in mind, Datoviz is written primarily in **C** and **C++**, leveraging the [**Khronos Vulkan graphics API**](https://www.vulkan.org/). It offers a C API, low-level Python bindings via `ctypes`, and a higher-level, idiomatic **Python API 🐍**.
Written by one of the original creators of [VisPy](https://vispy.org), a GPU-based Python scientific visualization library, Datoviz aims to serve as the default backend for the upcoming **VisPy 2.0**.
The library is lightweight with minimal dependencies: mostly Vulkan, [**GLFW**](https://www.glfw.org/) for windowing, and [Dear ImGui](https://github.com/ocornut/imgui/) for GUIs.
> [!WARNING]
> Datoviz is a young library. The API is stabilizing, but breaking changes may still occur as the project evolves with broader usage.
## ✨ Current features
* **📊 2D visuals**: antialiased points, markers, line segments, paths, text, images
* **📈 2D axes**
* **🌐 3D visuals**: meshes, volumes, volume slices
* **🌈 150 colormaps** included (from matplotlib, colorcet, MATLAB)
* **🖱️ High-level interactivity**: pan & zoom for 2D, arcball for 3D (more later)
* **🎥 Manual control of cameras**: custom interactivity
* **𓈈 Figure subplots** (aka "panels")
* **🖥️ GUIs** using [Dear ImGui](https://github.com/ocornut/imgui/)
## 🧩 API philosophy
Datoviz does **not** use high-level plotting functions like `plot()`, `scatter()`, or `imshow()`. Instead, it exposes flexible visual primitives—markers, images, meshes, and more—that can be added to a scene and customized directly with data. This approach offers fine-grained control and high performance, while remaining concise enough for quick plots.
A [higher-level plotting interface is under development as part of **VisPy 2.0**](https://github.com/vispy/vispy/discussions/2661), which will use Datoviz as its rendering backend. An intermediate layer called **GSP** (Graphics Specification Protocol) will provide a backend-agnostic API for declarative plotting.
## 🔍 Comparison with other libraries
### 🐍 Matplotlib
**Matplotlib** is the gold standard for static, publication-quality figures, with a mature, feature-rich API. But it's not optimized for interactivity or large datasets.
**Datoviz**, in contrast, is a younger, GPU-based library designed for fast, interactive visualization. It lacks Matplotlib’s high-level API but excels at rendering millions of points in real time.
Use **Matplotlib** for polished static plots, **Datoviz** for responsive data exploration.
#### Preliminary performance benchmark
The figure below shows a preliminary [**performance benchmark**](https://github.com/datoviz/datoviz/blob/main/examples/benchmarks/benchmark_mpl.py) comparing Datoviz and Matplotlib on an interactive 2D scatter plot, with increasing numbers of points and a simulated zoom interaction (on a high-end Linux desktop PC):
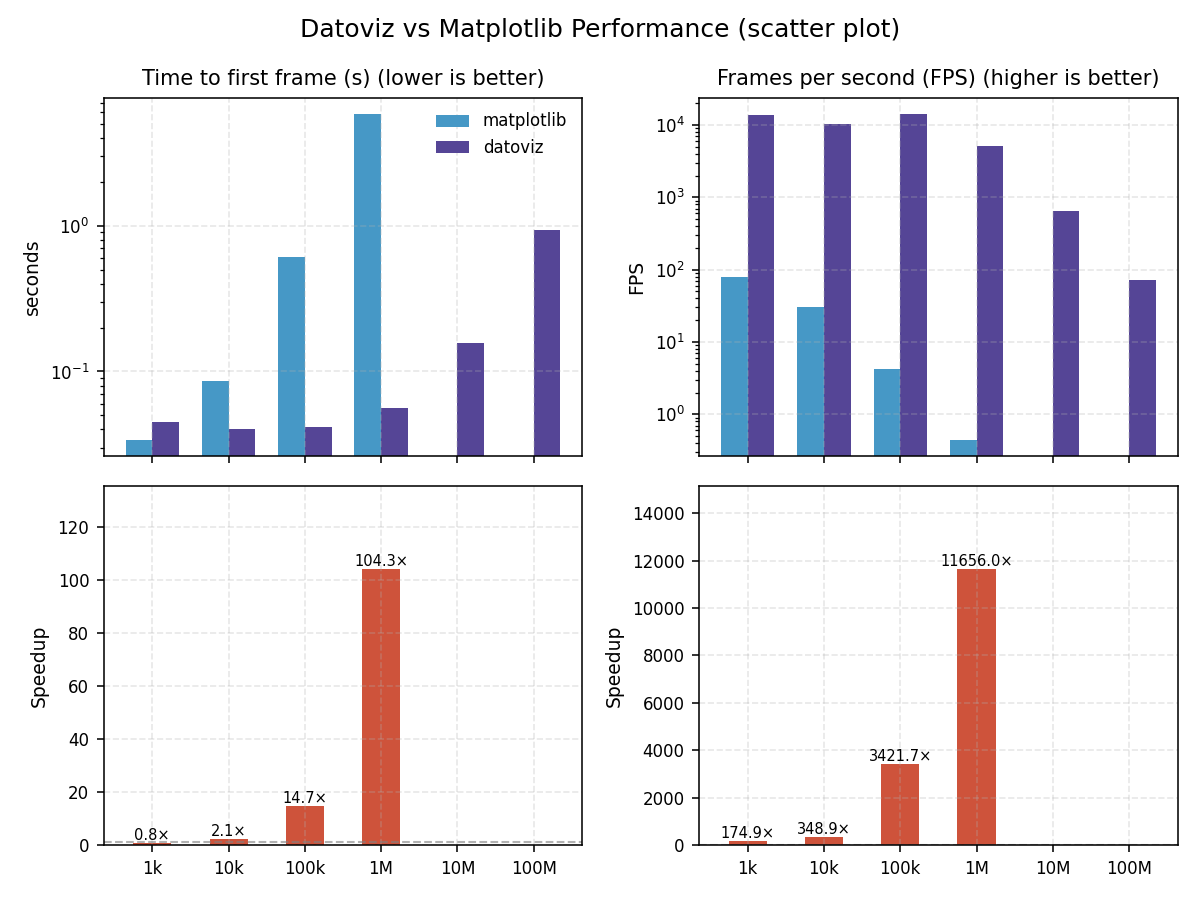
In this benchmark, **Datoviz outperforms Matplotlib by a factor of up to 10,000×**, maintaining interactive framerates even with millions of points. Matplotlib, in contrast, becomes sluggish or fails entirely as the dataset size increases.
### 🧊 VTK
Datoviz is lighter, simpler, and easier to install than VTK. It compiles in seconds, has minimal dependencies, and focuses exclusively on real-time rendering of visual primitives. Unlike VTK, it does not include data file I/O (except minimal test loaders like `.obj`), computational geometry, or data processing.
VTK is a powerful, heavyweight toolkit for 3D visualization, simulation, and scientific computing workflows. In contrast, Datoviz is designed for fast, high-quality 2D and 3D rendering.
## 🕐 Current status [July 2025]
**The current version is v0.3.x**
This release introduces major updates over v0.2, including 2D axes and a new Pythonic API.
## 🕐 Roadmap
Looking ahead, the upcoming v0.4 release (2026) will focus on foundational improvements to the low-level engine, paving the way for the following key features in future versions:
* 🧊 Correct transparency in 3D mesh and volume rendering
* ✨ Multisample anti-aliasing (MSAA)
* 🎯 Object picking
* 📈 Nonlinear coordinate transforms
* ⚡ CUDA interoperability
* 🧮 Vulkan compute shaders (similar to CUDA kernels)
* 🖌️ Dynamic and customizable shaders
* 🎛️ Combined GPGPU compute and graphics workflows
* 🔗 GPU memory sharing across visuals
* 🐍 IPython integration
* 🖥️ Qt backend support
* 🌐 WebGPU backend
## 🛠️ Installation instructions
### Requirements
* Supported operating systems:
* **Linux x86\_64** (e.g. Ubuntu 22.04 or later, as the Linux build requires glibc 2.34+)
* **macOS 12 or later** (x86\_64 and arm64, i.e. Apple silicon M1–M4)
* **Windows 10 or later** (x86\_64)
* Python environment:
* Python 3.8+ (64-bit)
* NumPy
* requests
* platformdirs
* Up-to-date graphics drivers with Vulkan support (most integrated or dedicated GPUs from the last ten years are supported)
### Install with pip
```bash
pip install datoviz
```
This installs a Python wheel that includes the C library, precompiled for your system.
If the installation fails, you may need to [build from source](BUILD.md) or [open an issue](https://github.com/datoviz/datoviz/issues) to request support for your configuration.
### Nightly builds
[Nightly builds](https://github.com/datoviz/datoviz/releases/tag/nightly) are automatically generated from the [`dev`](https://github.com/datoviz/datoviz/tree/dev) branch via [GitHub Actions](https://github.com/datoviz/datoviz/actions/workflows/wheels.yml). These builds contain the latest experimental features and bug fixes that have not yet been released.
> [!WARNING]
> Nightly wheels are untested and may be unstable. Use at your own risk, and please [report issues](https://github.com/datoviz/datoviz/issues) if you encounter any problems.
You can find the latest builds on the **[Nightly Release Page](https://github.com/datoviz/datoviz/releases/tag/nightly)**.
Each wheel file is tagged by platform (e.g. `manylinux`, `macosx`, `win_amd64`) and build date (`devYYYYMMDD`).
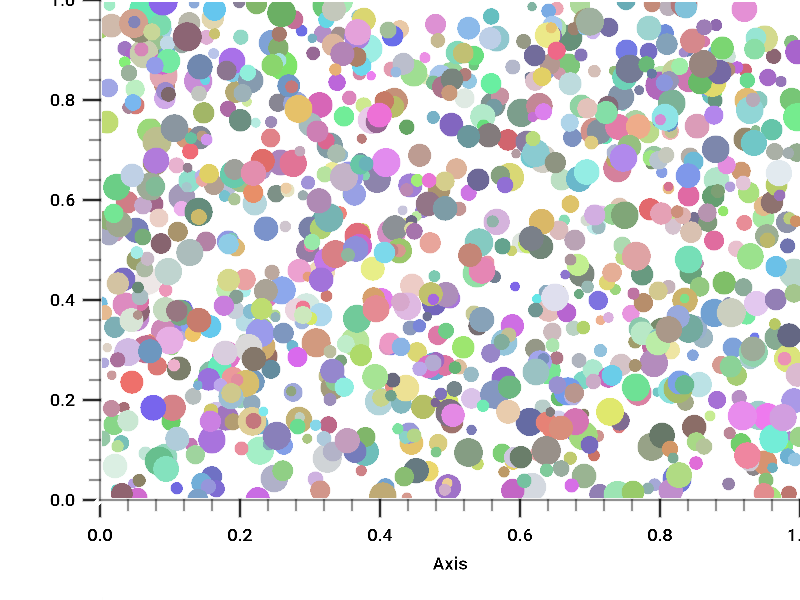
## 🚀 Usage
Here’s a simple 2D scatter plot example with axes in Python, displaying points with random positions, colors, and sizes.
```python
import numpy as np
import datoviz as dvz
n = 1000
x = np.random.normal(scale=0.2, size=n)
y = np.random.normal(scale=0.2, size=n)
color = np.random.randint(size=(n, 4), low=100, high=240, dtype=np.uint8)
color[:, 3] = 255
size = np.random.uniform(low=10, high=30, size=n)
app = dvz.App(background='white')
figure = app.figure(800, 600)
panel = figure.panel()
xmin, xmax = -1, +1
ymin, ymax = -1, +1
axes = panel.axes((xmin, xmax), (ymin, ymax))
visual = app.point(
position=axes.normalize(x, y),
color=color,
size=size,
)
panel.add(visual)
app.run()
app.destroy()
```
## 📚 Documentation
* [**📖 User guide**](https://datoviz.org/guide/)
* [**🐍 Examples**](https://datoviz.org/gallery/)
* [**📚 API** reference](https://datoviz.org/reference/api_py/)
* [**🏛️ Architecture** overview](https://datoviz.org/discussions/ARCHITECTURE/)
* [**🏗️ Build** instructions](https://datoviz.org/discussions/BUILD/)
* [**👥 Contributors** instructions](https://datoviz.org/discussions/CONTRIBUTING/)
* [**🛠️ Maintainers** instructions](https://datoviz.org/discussions/MAINTAINERS/)
## 🕰️ History
Datoviz builds on more than a decade of open-source GPU-based scientific visualization work:
- **2012** — Developers of several GPU visualization libraries (Galry, Glumpy, pyqtgraph, visvis) joined forces to create [**VisPy**](https://vispy.org/), a high-performance OpenGL-based visualization library for Python.
- **2015** — The [**Vulkan API**](https://www.khronos.org/vulkan/) was introduced as a modern low-level successor to OpenGL, [inspiring early ideas](https://cyrille.rossant.net/compiler-data-visualization/) for a future visualization library built on Vulkan.
- **2019** — [Cyrille Rossant](https://cyrille.rossant.net/), a VisPy cofounder, began experimenting with Vulkan as the foundation for a new graphics engine tailored to scientific visualization.
- **2021** — The first experimental release of **Datoviz v0.1** laid the foundation for future development. That same year, a [Chan Zuckerberg Initiative (CZI)](https://chanzuckerberg.com/eoss/proposals/) grant to VisPy helped support the ecosystem.
- **2024** — Datoviz **v0.2** was released with a full redesign. It introduced a modular architecture focused on stability and extensibility, paving the way for cross-platform rendering (including WebGPU) with support from a second [CZI grant](https://chanzuckerberg.com/eoss/proposals/).
- **2025** — Datoviz **v0.3** added 2D axes, a more Pythonic API, and core improvements in usability and flexibility.
Datoviz remains closely tied to **VisPy** and is being developed by one of its original authors. As part of the **VisPy 2.0** initiative (led by Cyrille Rossant and Nicolas Rougier, two of the original creators of VisPy), Datoviz will act as a low-level backend beneath a unified scientific visualization layer called the **Graphics Server Protocol (GSP)**, enabling frontends to target multiple renderers (Datoviz, Matplotlib, etc.).
The long-term vision is to enable high-performance 2D/3D scientific visualization across platforms (desktop, web, cloud) and languages (C/C++, Python, Julia, Rust).
## 🤝 Contributing
See the [contributing notes](CONTRIBUTING.md).
## 📄 License
See the [MIT license](LICENSE).
## 🙏 Credits
**Datoviz** is developed by [Cyrille Rossant](https://cyrille.rossant.net) at the [International Brain Laboratory](http://internationalbrainlab.org/), a global consortium of neuroscience research labs.
### 💸 Funding
Datoviz is supported by:
-  [Wellcome Trust](https://wellcome.org/)
-  [Simons Foundation](https://www.simonsfoundation.org/)
-  [Chan Zuckerberg Initiative](https://chanzuckerberg.com/), through the [Essential Open Source Software for Science program](https://chanzuckerberg.com/eoss/)
## 📚 References
- Khronos Group (2025). [Datoviz: Ultra-fast, high-performance GPU scientific visualization library built on Vulkan](https://www.khronos.org/blog/datoviz-ultra-fast-high-performance-gpu-scientific-visualization-library-built-on-vulkan)
- Rossant, C. & Rougier, N. (2021). [Datoviz: A GPU Scientific Visualization Library Based on Vulkan](https://ieeexplore.ieee.org/document/9500108). *2021 IEEE Visualization Conference (VIS)*.
- Rossant, C. (2015). [A compiler for data visualization](https://cyrille.rossant.net/compiler-data-visualization/)
- Campagnola, L., Klein, A., Larson, E., Rossant, C., & Rougier, N. P. (2015, July). [VisPy: harnessing the GPU for fast, high-level visualization.](https://inria.hal.science/hal-01208191/) In Proceedings of the 14th Python in Science Conference.
- Rougier, N. P. (2014). [Antialiased 2d grid, marker, and arrow shaders.](https://hal.science/hal-01081592/) Journal of Computer Graphics Techniques, 3(4), 52.
- Rougier, N. P. (2013). [Shader-based antialiased dashed stroked polylines.](https://inria.hal.science/hal-00907326/) Journal of Computer Graphics Techniques, 2(2), 91-107.
- Rougier, N. P. (2013). [Higher quality 2D text rendering.](https://inria.hal.science/hal-00821839/) Journal of Computer Graphics Techniques, 2(1), 50-64.