https://github.com/daveiano/weather-data-center
App built with Electron, React, IBM Carbon and nivo to collect, organize and analyse weather data.
https://github.com/daveiano/weather-data-center
sensor sensors smarthome weather weather-app weather-dashboard weather-data weather-station
Last synced: 5 months ago
JSON representation
App built with Electron, React, IBM Carbon and nivo to collect, organize and analyse weather data.
- Host: GitHub
- URL: https://github.com/daveiano/weather-data-center
- Owner: Daveiano
- License: gpl-3.0
- Created: 2021-03-05T23:54:30.000Z (over 4 years ago)
- Default Branch: 1.x
- Last Pushed: 2023-02-03T17:33:26.000Z (over 2 years ago)
- Last Synced: 2025-05-13T00:16:30.510Z (5 months ago)
- Topics: sensor, sensors, smarthome, weather, weather-app, weather-dashboard, weather-data, weather-station
- Language: TypeScript
- Homepage:
- Size: 70.6 MB
- Stars: 14
- Watchers: 3
- Forks: 3
- Open Issues: 16
-
Metadata Files:
- Readme: readme.md
- Funding: .github/FUNDING.yml
- License: LICENSE
Awesome Lists containing this project
README
# Weather Data Center
[](https://github.com/Daveiano/weather-data-center/actions/workflows/unit-tests.yml)
[](https://github.com/Daveiano/weather-data-center/actions/workflows/e2e-tests.yml)
## Introduction
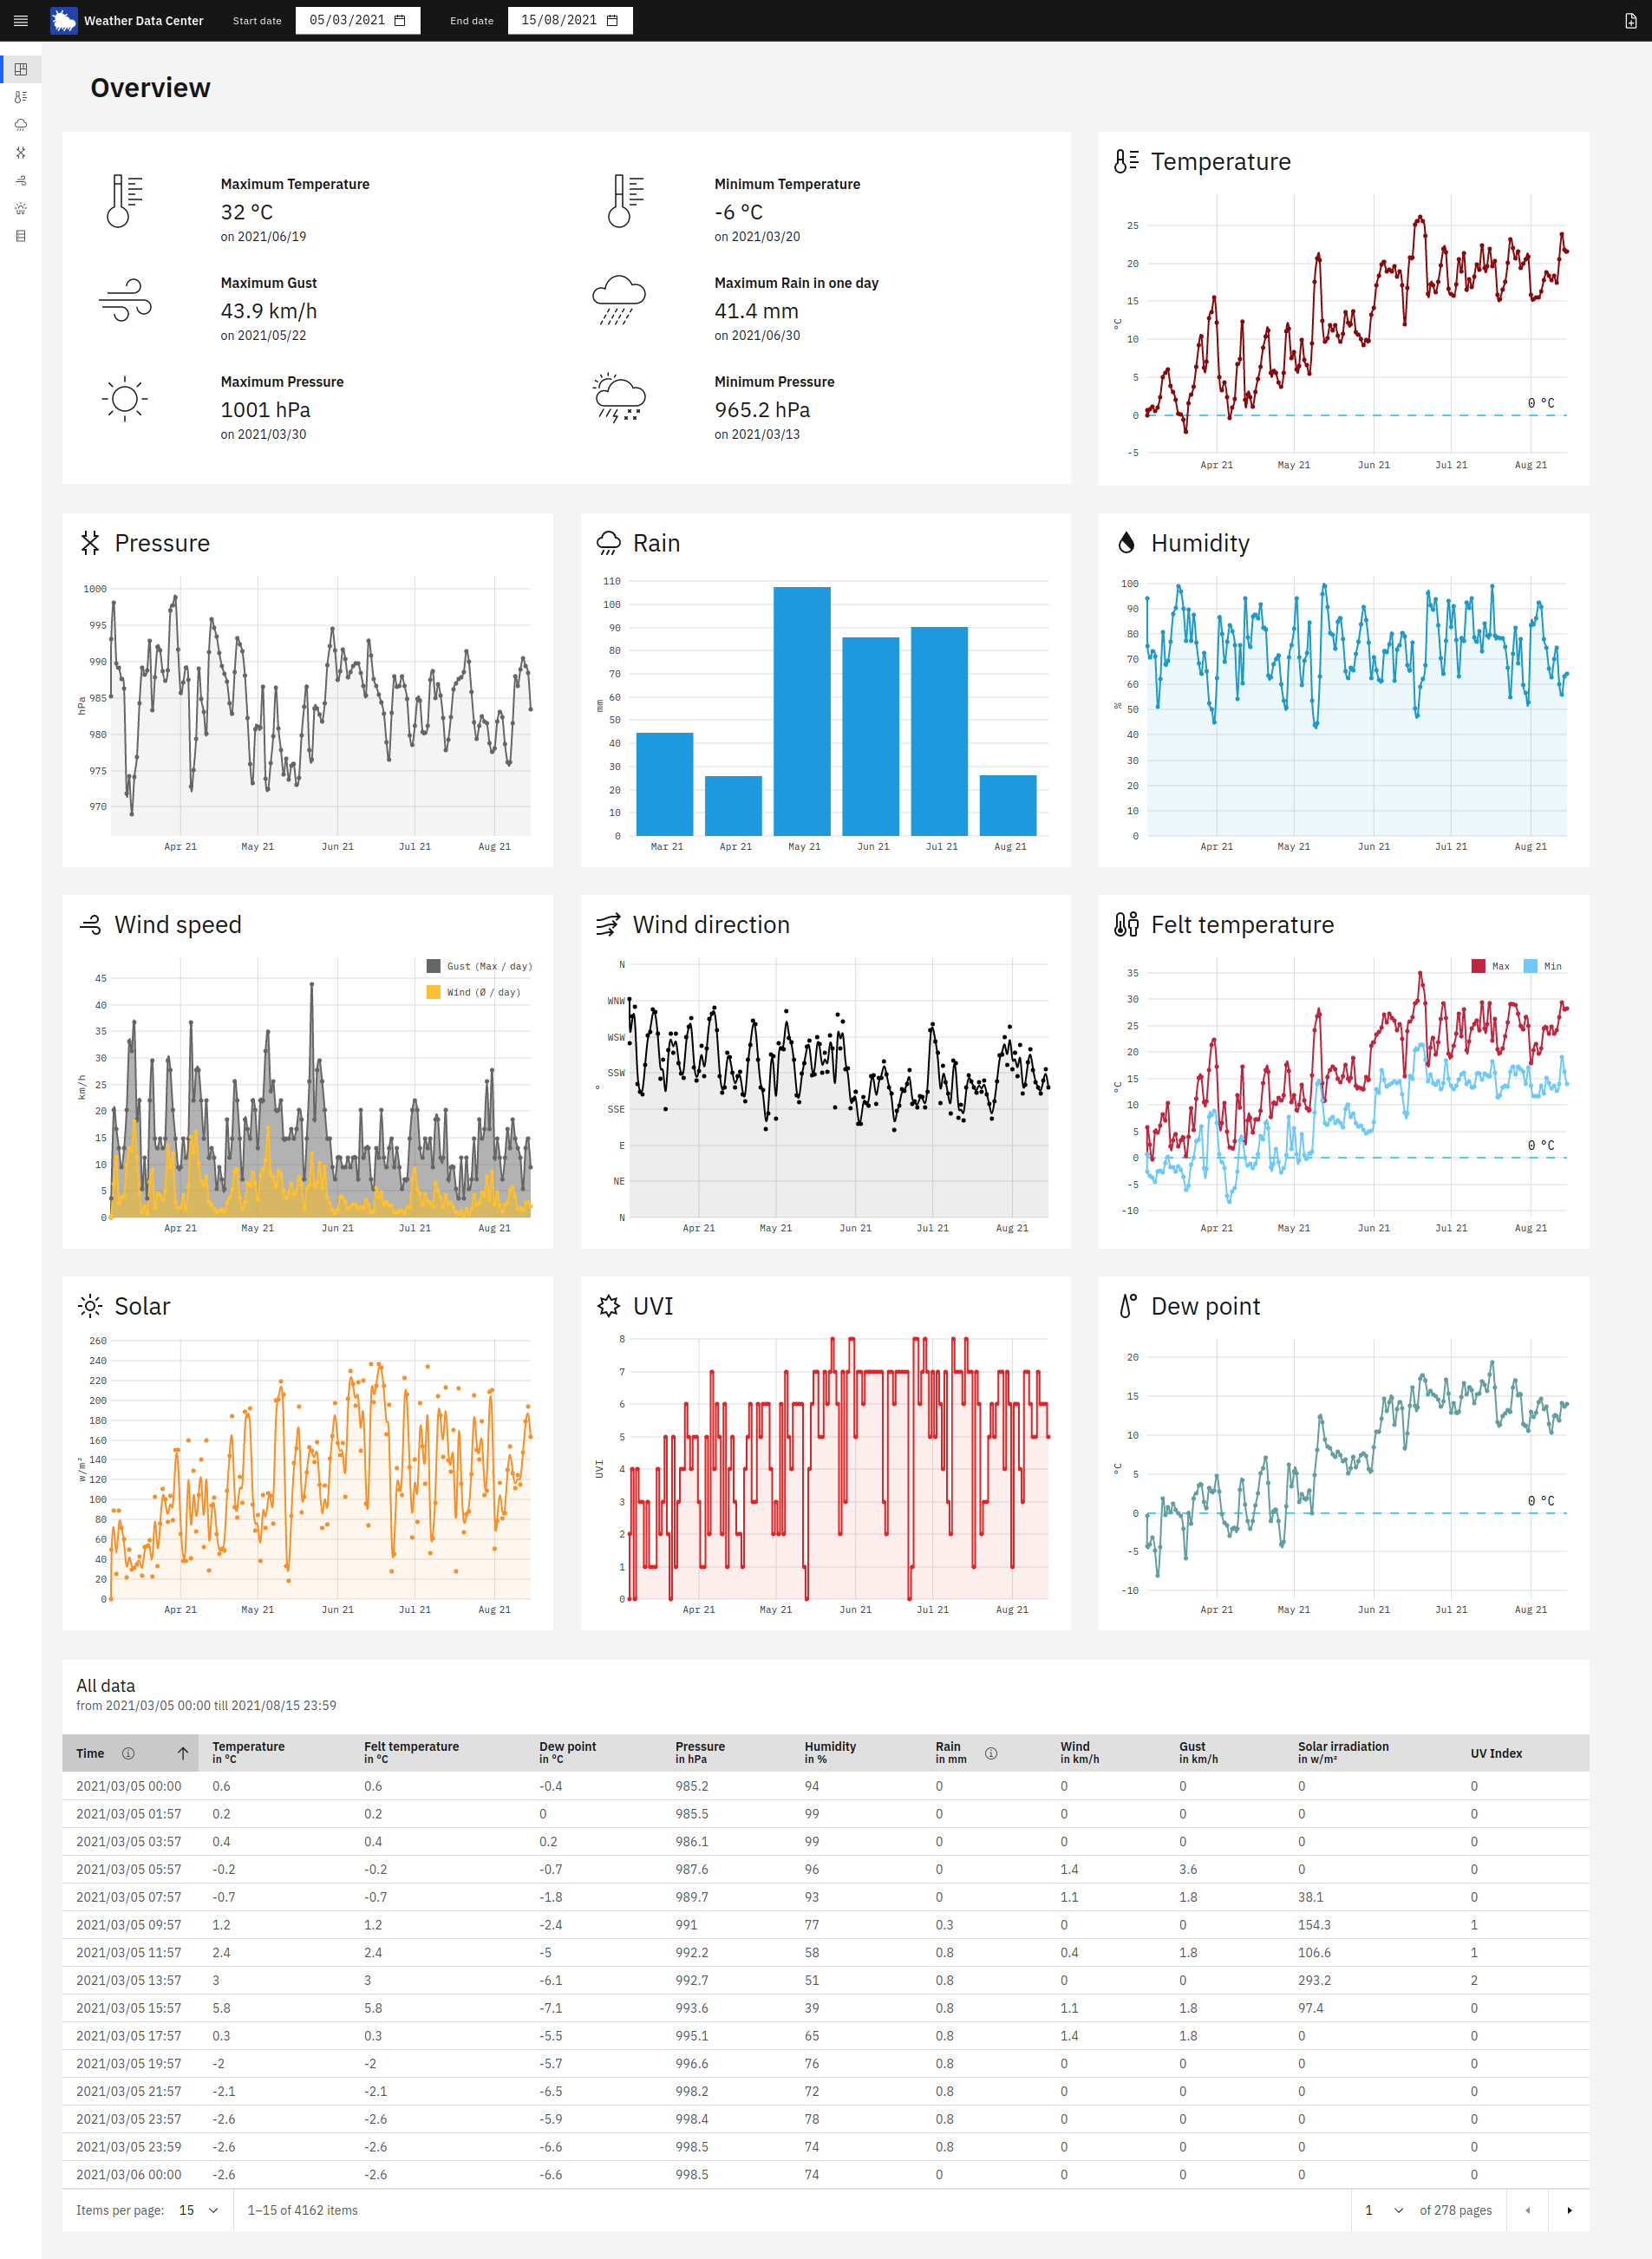
Weather Data Center is an application written with TypeScript + React in an Electron environment. This way it is a
cross-platform Desktop application. The main purpose is to collect, organize, analyze and visualize weather data
from your backyards weather station.
You need to export/backup the data from your weather station and import them as a .csv file into the app.
### Supported characteristics
- Temperature
- Pressure
- Humidity
- Wind direction
- Wind Speed
- Guest Speed
- Felt temperature
- Dew point temperature
- Rain
- Solar radiation
- UV Index
### Import file & App settings
Currently, only .csv files with named headers are supported. You can manage the header names and the units within
the app settings. You can also configure the input date and time format (this is important because various personal
weather stations backup their data in different date formats). For the rain, you need to provide the data in a form
where the data is accumulated per day, so the last entry of the day is the total amount of rain. See the
[Docs](https://daveiano.github.io/weather-data-center/manual.html) for more info.
### Screenshots
#### Front Page
## [Manual](https://daveiano.github.io/weather-data-center/manual.html)
## Development
### Local development
```
yarn install
yarn run start
```
### Tests
```
yarn run test
```
### Build installable
```
yarn run make
```
### Upstream issues
- Carbon structure: components-react vs @carbon - https://github.com/carbon-design-system/carbon/issues/9540
- Carbon DataTable sort all pages, not only current visible - https://github.com/carbon-design-system/carbon/issues/6373
- Carbon - Support React Link in SideNav - https://github.com/carbon-design-system/carbon/issues/2473
- Nivo Annotations for line diagram (show min and max value for e.g. temperature) - https://github.com/plouc/nivo/issues/1857
- playwright: Filechooser not working - https://github.com/microsoft/playwright/issues/5013
- Carbon: \ cannot appear as a descendant of \ when using tooltips in table headers