https://github.com/davesteele/netbwtools
Simple tools for monitoring network traffic
https://github.com/davesteele/netbwtools
Last synced: 2 months ago
JSON representation
Simple tools for monitoring network traffic
- Host: GitHub
- URL: https://github.com/davesteele/netbwtools
- Owner: davesteele
- License: gpl-2.0
- Created: 2015-09-02T12:11:08.000Z (almost 11 years ago)
- Default Branch: master
- Last Pushed: 2015-09-23T22:22:35.000Z (almost 11 years ago)
- Last Synced: 2026-02-11T02:28:56.841Z (6 months ago)
- Language: Python
- Size: 313 KB
- Stars: 1
- Watchers: 1
- Forks: 0
- Open Issues: 0
-
Metadata Files:
- Readme: README.md
- License: LICENSE
Awesome Lists containing this project
README
# netbwtools
This repository contains a few simple scripts for download performance testing,
creating comma-separated variable (CSV) files as output. These can be converted
to charts in a spreadsheet application.
The scripts:
* _netbwcsv_ - Output network port traffic as CSV.
* _dltest_ - Run a download test, creating a CSV file.
* _addbwcsv_ - Combine multiple 'netbwcsv' files into a single spreadsheet.
## netbwcsv
Monitor data through network port(s), output as a csv file.
```Batchfile
$ netbwcsv -h
usage: netbwcsv [-h] [-b] [-d SEC] [-l] [-t TITLE]
ipaddr[:device[:community[:direction]]]
[ipaddr[:device[:community[:direction]]] ...]
Monitor traffic at network endpoints
positional arguments:
ipaddr[:device[:community[:direction]]]
Monitoring point. Device defaults to 'eth0'. The SNMP
community defaults to 'public'. Direction is 'in' or
'out' (default 'in')
optional arguments:
-h, --help show this help message and exit
-b, --bps output the rate in bits/second (default is bytes/sec)
-d SEC, --delay SEC delay between samples (default is 5 seconds)
-l, --list-devices just list the devices on the node, and exit
-t TITLE, --title TITLE
title for the csv data column
Query the device using SNMP, and output the results in CSV format. The device
may be specified by name or by SNMP index (the last digit in the monitoring
OID).
```
```
$ netbwcsv -l localhost
localhost : ['lo', 'Controller', 'wlan1']
```
```
$ netbwcsv -b -d 1 localhost:wlan1
time, localhost:wlan1:in
2015-09-18 11:40:01, 1336
2015-09-18 11:40:02, 10504
2015-09-18 11:40:03, 22048
2015-09-18 11:40:04, 2280
2015-09-18 11:40:05, 336
^C$
```
## dltest
Run a download test, creating a CSV file.
```
$ dltest
dltest
Usage: ./dltest
This creates a CSV file named .csv, with columns for time (separated
by seconds) and bandwidth on , in bits/second.
The format for is as defined by 'netbwcsv'. is a data
consuming command - for instance 'scp user@host:path .'.
```
```
$ dltest googletest localhost:wlan1 1 'wget http://google.com'
$ cat googletest.csv
time, "googletest"
2015-09-18 11:44:57, 1848
2015-09-18 11:44:58, 0
2015-09-18 11:44:59, 1472
2015-09-18 11:45:00, 4008
2015-09-18 11:45:01, 5296
2015-09-18 11:45:02, 179120
2015-09-18 11:45:03, 0
2015-09-18 11:45:04, 3024
2015-09-18 11:45:05, 0
2015-09-18 11:45:06, 824
$
```
## addbwcsv
Merge multiple 'netbwcsv' output files to a single spreadsheet with a single time base.
```
$ addbwcsv -h
usage: addbwcsv [-h] file.csv [file.csv ...]
Combine netbwcsv CSV files
positional arguments:
file.csv A netbwcsv CSV file to be incorporated.
optional arguments:
-h, --help show this help message and exit
Combines CSV files from netbwcsv output into a single spreadsheet, with a
common time base and separate columns for each data series. Output is to
stdout.
```
```
$ dltest google1 localhost:wlan1 1 'wget http://google.com'
...
$ dltest google2 localhost:wlan1 1 'wget http://google.com'
...
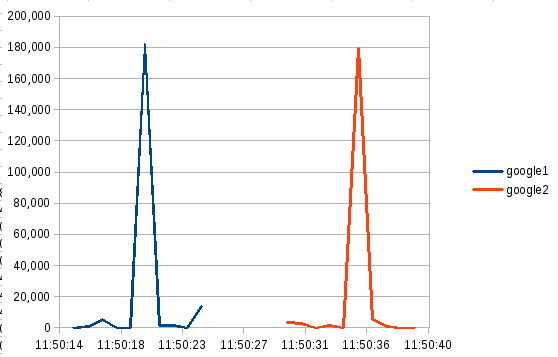
$ addbwcsv google1.csv google2.csv
time,google1,google2
2015-09-18 11:50:15, 0,
2015-09-18 11:50:16, 744,
2015-09-18 11:50:17, 5408,
2015-09-18 11:50:18, 0,
2015-09-18 11:50:19, 0,
2015-09-18 11:50:20, 181616,
2015-09-18 11:50:21, 1336,
2015-09-18 11:50:22, 1480,
2015-09-18 11:50:23, 0,
2015-09-18 11:50:24, 13896,
2015-09-18 11:50:30,, 3408
2015-09-18 11:50:31,, 2904
2015-09-18 11:50:32,, 0
2015-09-18 11:50:33,, 1560
2015-09-18 11:50:34,, 0
2015-09-18 11:50:35,, 179144
2015-09-18 11:50:36,, 5344
2015-09-18 11:50:37,, 744
2015-09-18 11:50:38,, 0
2015-09-18 11:50:39,, 0
```
Which parses to:
time | google1 | google2
---- | ------- | -------
2015-09-18 11:50:15 | 0 | |
2015-09-18 11:50:16 | 744 | |
2015-09-18 11:50:17 | 5408 | |
2015-09-18 11:50:18 | 0 | |
2015-09-18 11:50:19 | 0 | |
2015-09-18 11:50:20 | 181616 | |
2015-09-18 11:50:21 | 1336 | |
2015-09-18 11:50:22 | 1480 | |
2015-09-18 11:50:23 | 0 | |
2015-09-18 11:50:24 | 13896 | |
2015-09-18 11:50:30 | | 3408
2015-09-18 11:50:31 | | 2904
2015-09-18 11:50:32 | | 0
2015-09-18 11:50:33 | | 1560
2015-09-18 11:50:34 | | 0
2015-09-18 11:50:35 | | 179144
2015-09-18 11:50:36 | | 5344
2015-09-18 11:50:37 | | 744
2015-09-18 11:50:38 | | 0
2015-09-18 11:50:39 | | 0
This can be charted in a spreadsheet as an X-Y plot, with the following
results: