Ecosyste.ms: Awesome
An open API service indexing awesome lists of open source software.
https://github.com/davidmoten/rtree-3d
3D R-Tree in java
https://github.com/davidmoten/rtree-3d
Last synced: 16 days ago
JSON representation
3D R-Tree in java
- Host: GitHub
- URL: https://github.com/davidmoten/rtree-3d
- Owner: davidmoten
- License: apache-2.0
- Created: 2016-01-31T10:28:45.000Z (almost 9 years ago)
- Default Branch: master
- Last Pushed: 2024-09-19T16:21:37.000Z (about 2 months ago)
- Last Synced: 2024-10-14T07:46:37.419Z (30 days ago)
- Language: Java
- Size: 1.02 MB
- Stars: 35
- Watchers: 4
- Forks: 17
- Open Issues: 3
-
Metadata Files:
- Readme: README.md
- License: LICENSE
Awesome Lists containing this project
README
# rtree-3d
[](https://travis-ci.org/davidmoten/rtree-3d)
[](https://maven-badges.herokuapp.com/maven-central/com.github.davidmoten/rtree-3d)
**Note**: this project is NOT under active development. See [rtree-multi](https://github.com/davidmoten/rtree-multi) for an n-dimensional R-Tree.
Three dimensional R-Tree in java.
* motivated by spatio-temporal queries
* nodes can be serialized to disk or network storage.
* particularly interested in serializing large static datasets into a top tree and many sub-tree files that might be accessed over medium latency and medium bandwidth io (e.g. using AWS S3 from EC2).
Status: *pre-alpha*
Progress is being made on this project. I've copied my [rtree 2D implementation](https://github.com/davidmoten/rtree) and beefed it up for 3D.
* expanded the R* `Selector` and `Splitter` implementations to handle 3 dimensions
* enhanced Quadratic `Selector` and `Splitter` implementations to handle 3 dimensions
* normalized coordinates so they range from 0..1
* added [R language code](src/main/r/source.r) to produce PNG visualizations of tree structure (below)
If the coordinates are normalized to the [0..1] range then the data structure doesn't favour one dimension over another. To favour time over position for instance just scale the time value down by a constant (experiment with your data!).
Note also that if your entries are added to the R-tree in say ascending time order then the resultant R-tree may be affected negatively in terms of the efficiency of its structure. A useful strategy to avoid this is to shuffle the entries before adding. For example:
```java
RTree tree =
tree.add(
entries
.toList()
.flatMapIterable(list -> {Collections.shuffle(list);return list}));
```
Visualization
-----------------------
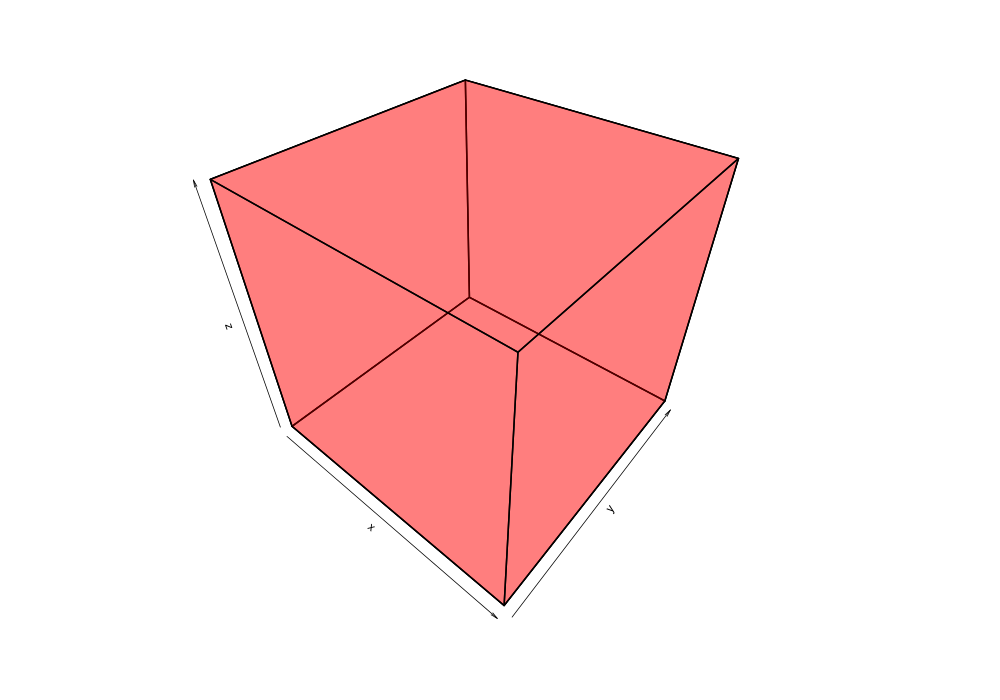
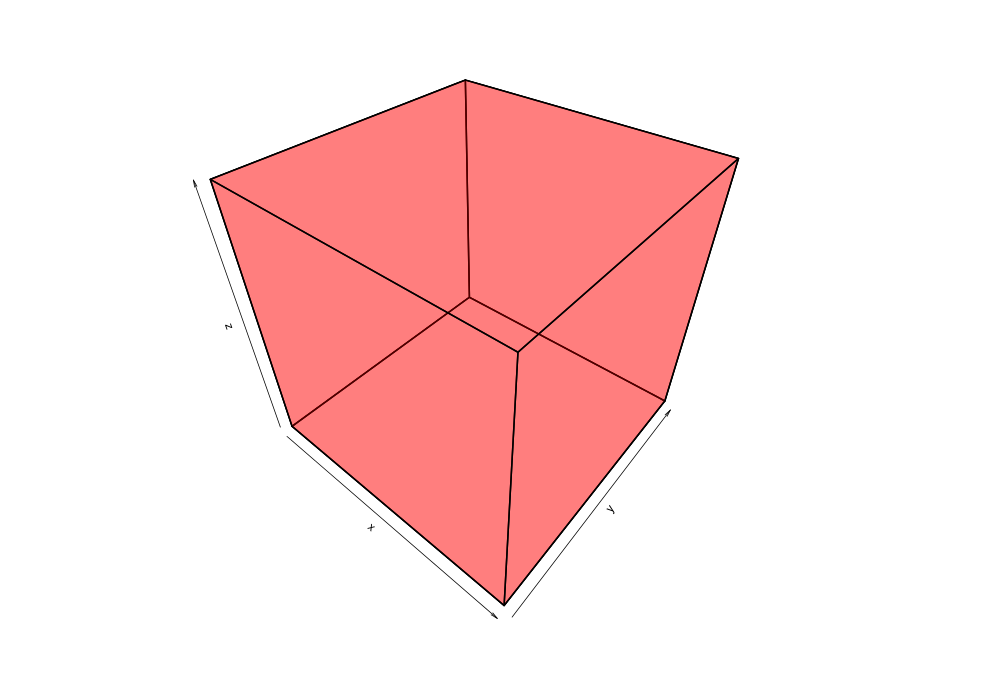
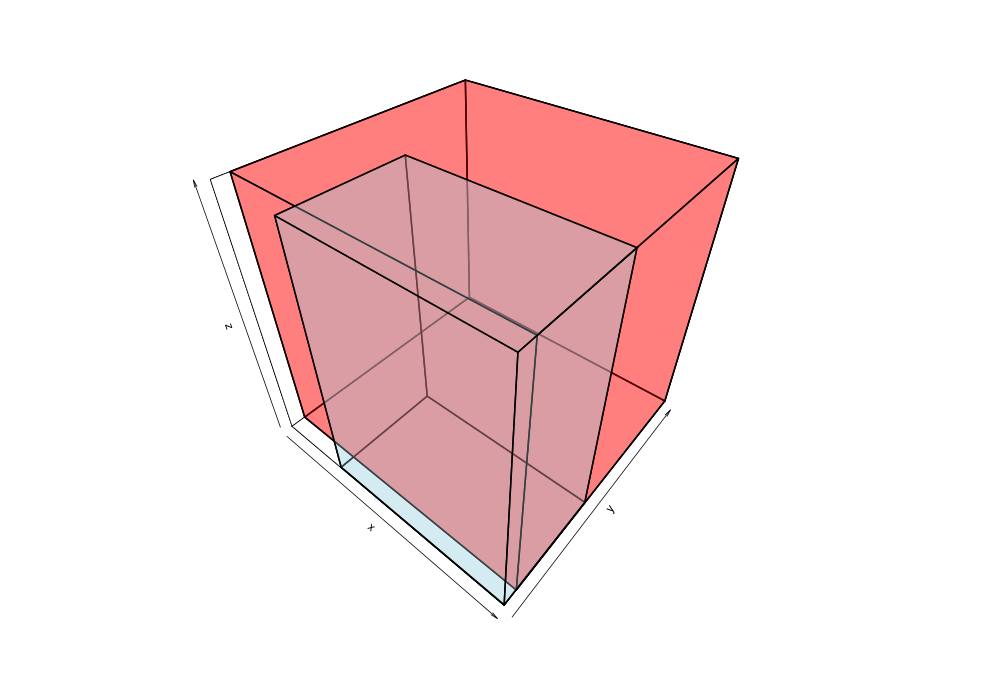
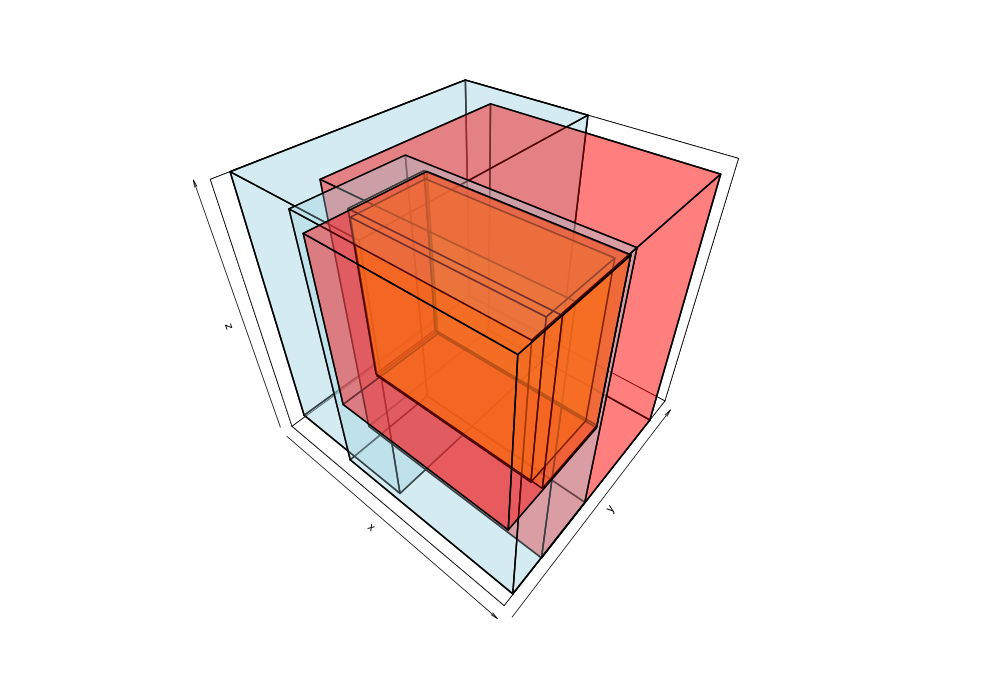
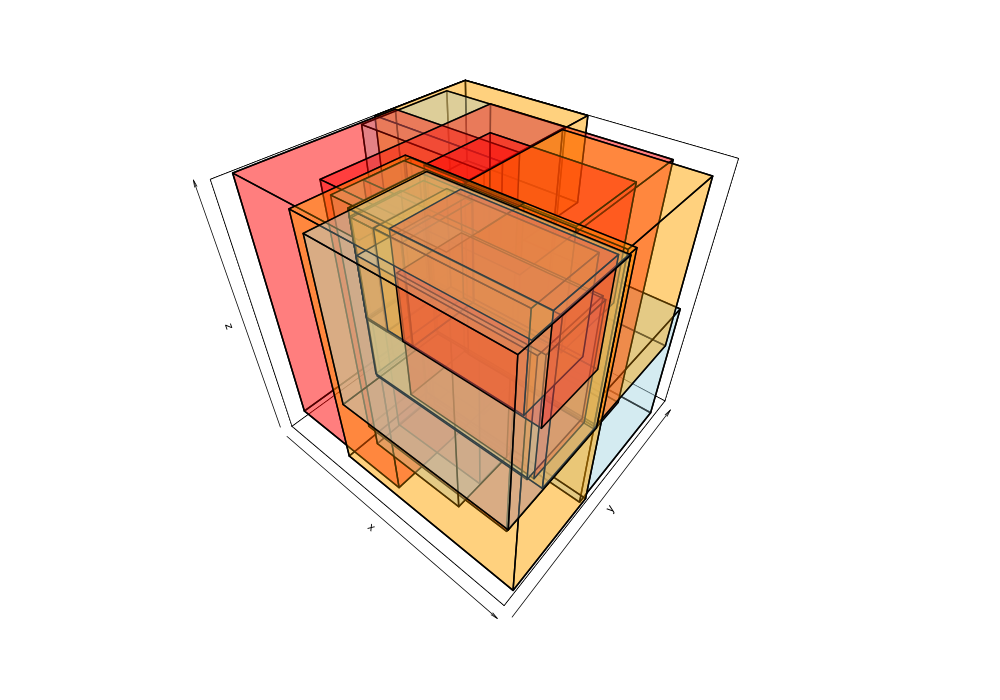
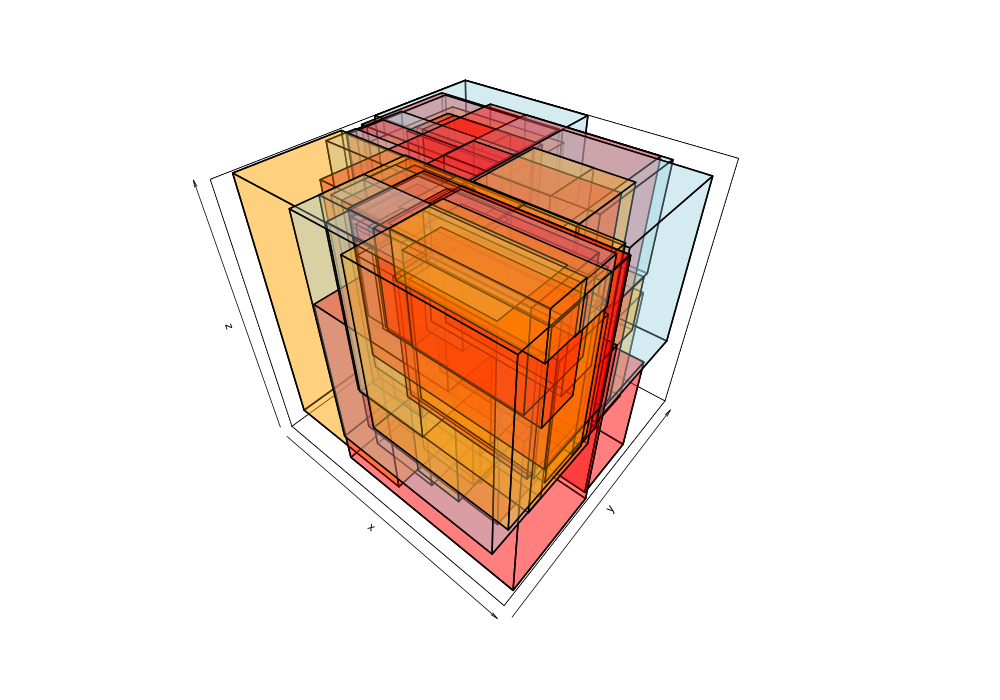
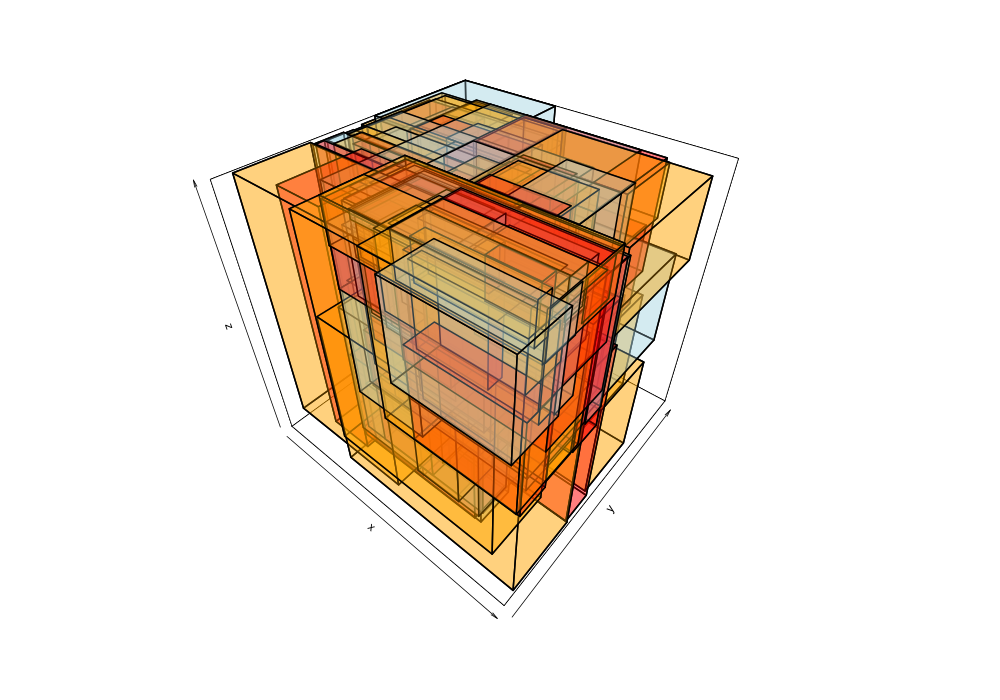
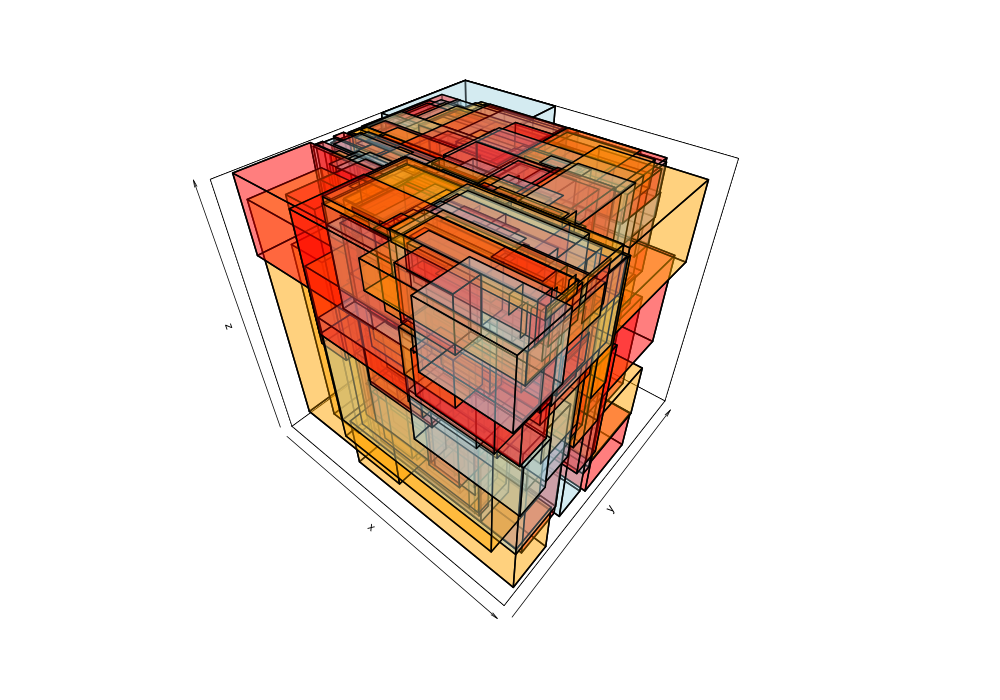
Given the 38,377 data points of greek earthquakes (lat, long, time) from 1964 to 2000, the data is scanned to establish the ranges for each coordinate then normalized to a [0,1] range. The points are shuffled then added to an R-tree with `minChildren=2` and `maxChildren=4` using either the R* heuristics or standard R-tree heuristics. Visualization of the bounding boxes at nodes by method and depth is below.
Generated with this [commit](tree/83c760b3ee7f9fb7d64f581554424ee7ab88cac7).
The plots below are generated from the same shuffle of data points.
| Quadratic split | R*-tree split |
| :-------------: | :-----------: |
|  |
|  |
|
|  |
|  |
|
|  |
|  |
|
|  |
|  |
|
|  |
|  |
|
|  |
|  |
|
|  |
|  |
|
| 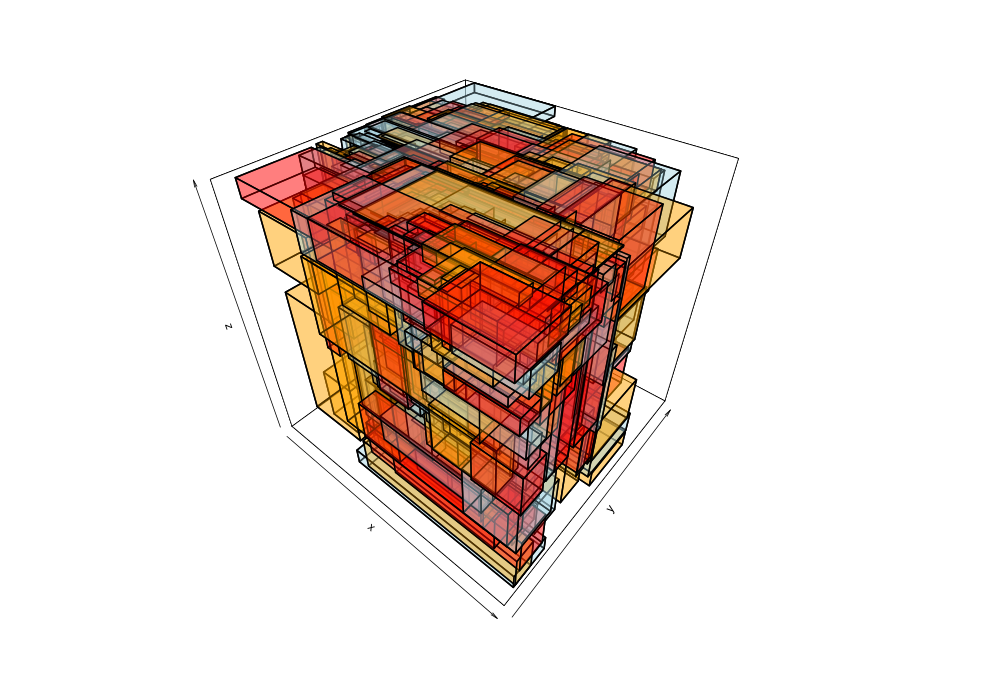 |
| 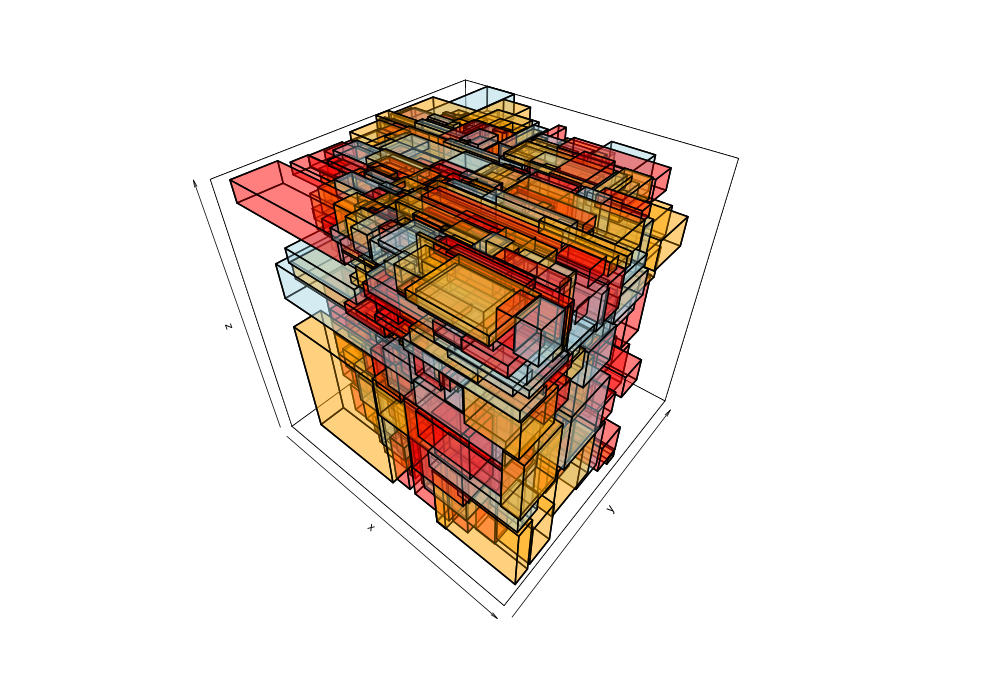 |
|
| 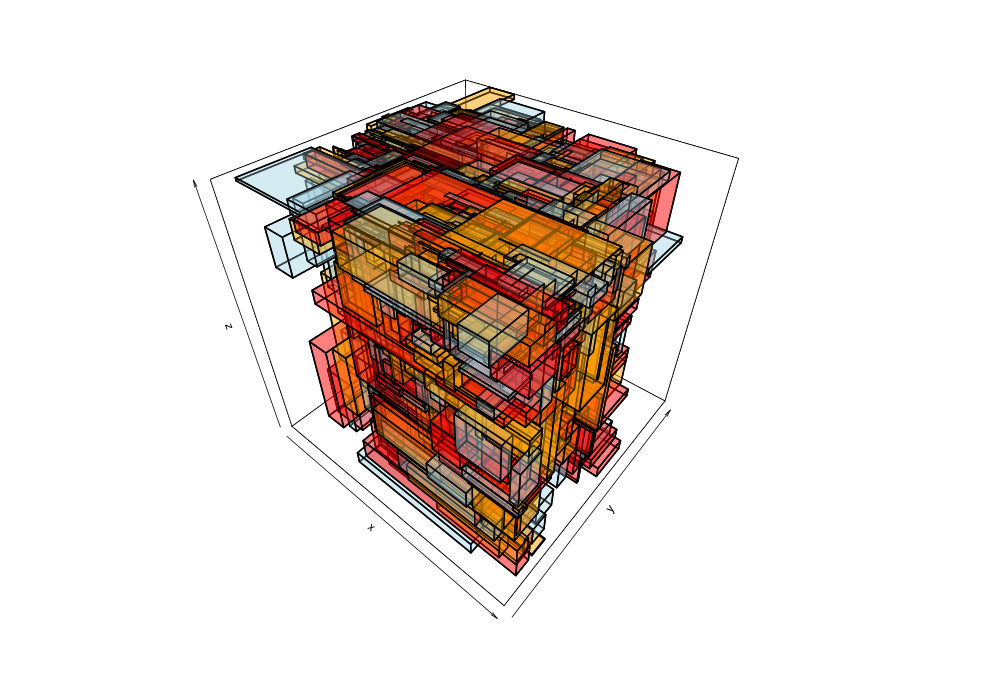 |
| 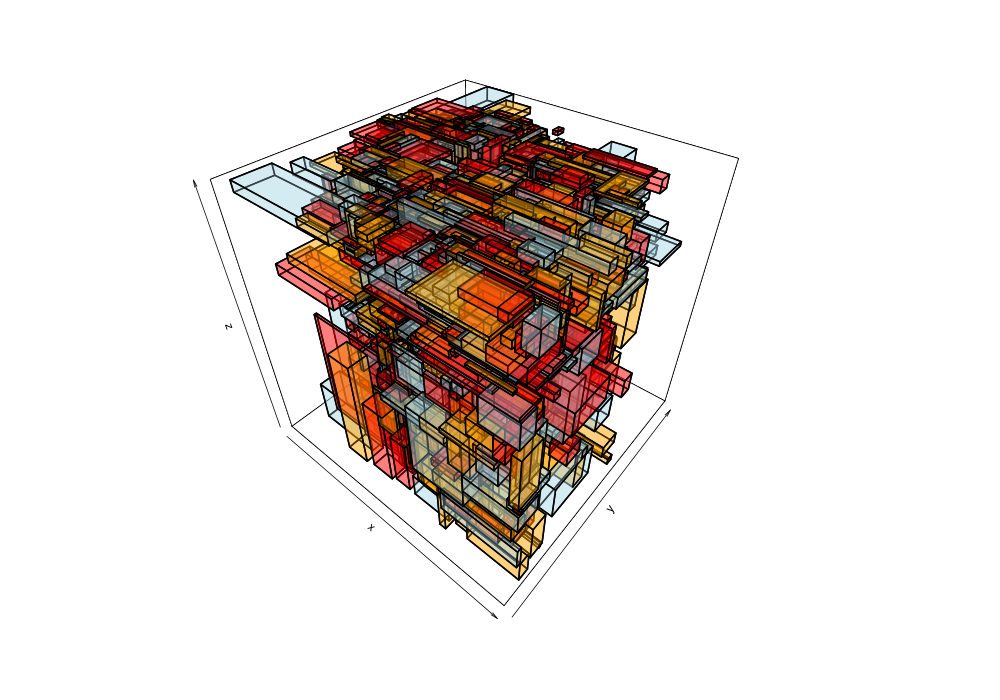 |
|
| 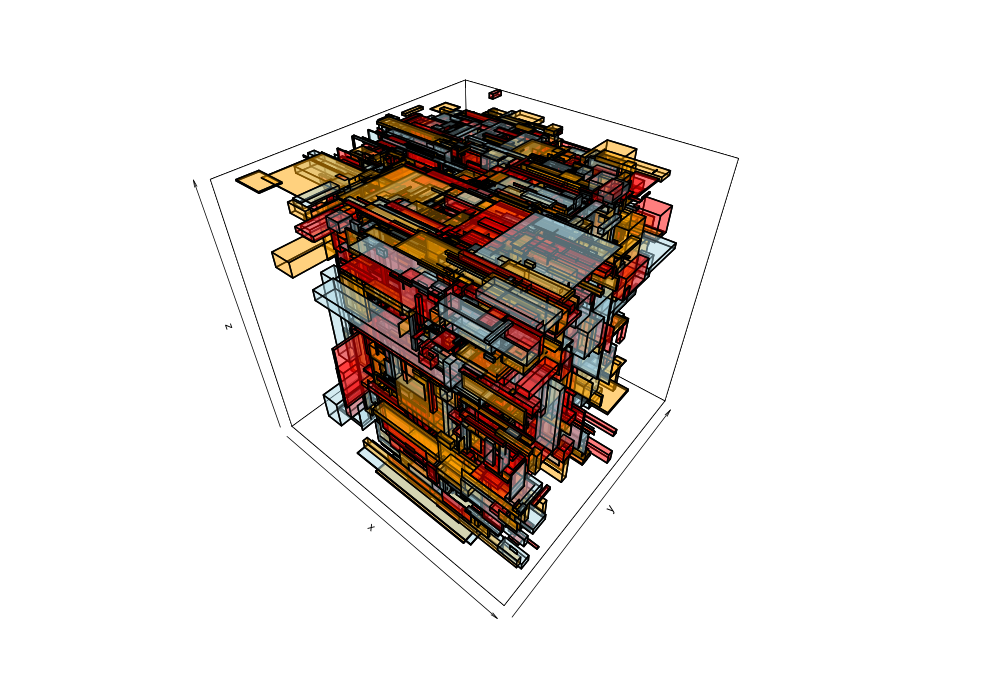 |
| 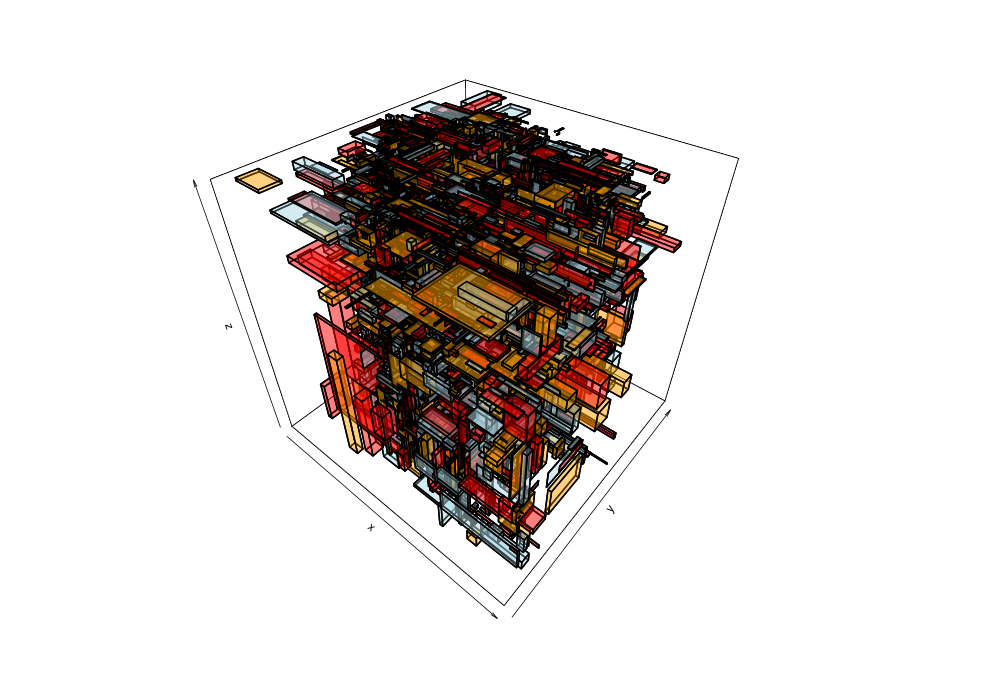 |
|
Commands to generate:
```bash
mvn test
cd src/test/r
./source.r
```
Images are generated in `target` directory (`plot*.png`).