https://github.com/deadflowers/bitcurrents-log-analyzer
Web traffic log analyzer featuring IP address insights provided by IP2Location API. Concept is created as a entry for their 2025 Hackathon programming contest.
https://github.com/deadflowers/bitcurrents-log-analyzer
analytics geolocation-api ip2location ip2locationcontest nginx programmingcontest python security-tools traffic-analysis
Last synced: 5 months ago
JSON representation
Web traffic log analyzer featuring IP address insights provided by IP2Location API. Concept is created as a entry for their 2025 Hackathon programming contest.
- Host: GitHub
- URL: https://github.com/deadflowers/bitcurrents-log-analyzer
- Owner: deadflowers
- License: mpl-2.0
- Created: 2025-10-01T05:54:33.000Z (10 months ago)
- Default Branch: main
- Last Pushed: 2025-10-10T04:07:13.000Z (10 months ago)
- Last Synced: 2025-10-23T11:59:48.141Z (9 months ago)
- Topics: analytics, geolocation-api, ip2location, ip2locationcontest, nginx, programmingcontest, python, security-tools, traffic-analysis
- Language: HTML
- Homepage: https://bitcurrents.com/log-analyzer/
- Size: 7.64 MB
- Stars: 3
- Watchers: 0
- Forks: 0
- Open Issues: 0
-
Metadata Files:
- Readme: README.md
- License: LICENSE
- Security: security_patterns.json
Awesome Lists containing this project
README
# BitCurrents Log Analyzer
**A powerful, real-time Nginx log analyzer with a focus on security intelligence, performance monitoring, and beautiful data visualization. Powered by the IP2Location API.**
[](https://youtu.be/_bsR1jk-Mas?si=I0kenWTKE6MPDkoP)
BitCurrents Analyzer turns raw Nginx logs into actionable insights. It moves beyond simple IP lookups to provide a rich, interactive dashboard that helps you understand your traffic, identify security threats, and diagnose server errors instantly. It's extremely lightweight as single-page web application, built with a Python/Flask backend and dynamic JavaScript frontend, private, nimble, customizable.
---
**[Log Analyzer LIVE demo](https://bitcurrents.com/log-analyzer/index.html)**
Follow link, List Button, select file, Analyze Button, wait..., peruse all the things ;)
---
## 🔥 Key Features
### 1. Multi-Mode Analysis Dashboard
Switch between three distinct analysis modes, each with a purpose-built dashboard:
#### ✨ General Mode
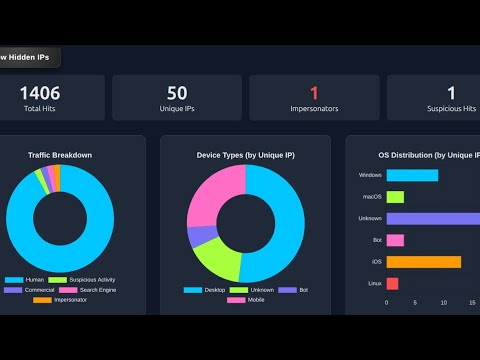
Your command center for at-a-glance traffic overview.
- **Rich KPI Cards:** Total Hits, Unique IPs, and critical counts of Impersonator and Suspicious traffic.
- **Comprehensive Charting:**
- Traffic Breakdown (Human, Bots, Crawlers)
- Device Types (Desktop, Mobile)
- OS & Browser Distribution
- HTTP Status Code Distribution
- Top Countries & Top Successful Pages
- **Powerful Filtering:** Instantly hide noisy IPs to see the real signal, and switch between analyzing Unique IPs vs. All Hits.
**
#### 🛡️ Security Mode
Proactively hunt for threats and analyze attack patterns.
- **Dynamic Threat Categories:** Filter logs for specific attack vectors like Config Exposure, Webshells, and WordPress probes using a configurable `security_patterns.json`.
- **Targeted Visualizations:** See charts for Top Attack Categories and Top Attacking IPs.
- **Bot Impersonator Detection:** Automatically flags traffic pretending to be a legitimate crawler from an unverified IP address.
**
#### 🚨 Error Mode
Quickly diagnose and understand server problems.
- **Smart Error Parsing:** Intelligently categorizes common Nginx `error.log` messages (e.g., "Backend Unreachable," "Index Forbidden").
- **Insightful Charts:** Visualize error types and severity levels to prioritize fixes.
- **In-App Quick Guide:** A helpful "Error Log Tips" modal provides context and troubleshooting advice for common Nginx errors.
**
---
### 👨💻 Hackathon Submission built for the IP2Location Programming Contest
This project leverages the power and precision of the **[IP2Location.io](https://www.ip2location.io/)** API to deliver advanced security features, including:
- **High-Fidelity Geolocation:** Pinpointing the source of traffic with country, city, and ISP data.
- **Intelligent Bot Detection:** Moving beyond simple user-agent strings.
- **Bot Impersonator Flagging:** A critical security feature that verifies if traffic claiming to be from major crawlers (like Googlebot) is actually coming from their published IP ranges.
### Set Up:
Clone this repository.
* **Install pyenv:** If you don't have it, follow the installation guide. For macOS/Linux with Homebrew, it looks like this:
`brew install pyenv`
Make sure to follow the post-install instructions to add pyenv init to your shell's startup script (.zshrc, .profile, .bashrc, etc.).
Then add these lines to your shell config (~/.bashrc or ~/.zshrc):
```
export PATH="$HOME/.pyenv/bin:$PATH"
eval "$(pyenv init -)"
eval "$(pyenv virtualenv-init -)"
```
Restart your shell so changes take effect.
* **Install a Python Version:** Let's use a recent, stable version.
`pyenv install 3.13.0`
* **Create Your Project:**
`git clone https://github.com/deadflowers/bitcurrents-log-analyzer`
`cd bitcurrents-log-analyzer`
* **Set the Local Python Version:** This command creates a .python-version file in your directory, so pyenv automatically uses this version whenever you're in this folder.
`pyenv local 3.13.0`
* **Create & Activate a Virtual Environment:** This is a best practice within your pyenv version to keep packages project-specific.
Create the virtual environment folder named 'venv'
`python -m venv .venv`
Activate it
`source .venv/bin/activate`
Your terminal prompt should have in it `(.venv)`
* **Install Dependencies:**
`pip install -r requirements.txt`
* **Set Up API Key:**
* Sign up for a free account at [IP2Location.io](https://ip2location.io) to get an API key. The free plan is quite capable.
* Create a file named .env in your project directory and add your key:
`IP2LOCATION_API_KEY=your-key`
or
`export IP2LOCATION_API_KEY=your-key`
Make sure your .venv is activated.
* **Run it:** In your terminal, inside the bitcurrents-log-analyzer directory, start the backend, and the front end
`source .venv/bin/activate`
### Start Backend: Run the Python server:
```bash
python app.py
```
### Launch Frontend:
Open `index.html` in your web browser as `file:///` path
### Analyze:
The dashboard will load with the new dark theme.
- Enter the directory where your logs are stored or copied to. Default is `.`
- Hit "List" button to see log files in that directory
- Optionally, enter a path fragment to track in the "Track Custom Path"
- Click the "Analyze Logs" button and wait a moment.
You can use sample logs provided in './sample_logs' in the project folder, where you will find `combined.log`. Just entr `.` as directory to search logs then choose in the next area specific file `combined.log`
The charts will populate, and the detailed IP table will appear below. You can now distinguish OS/Bot and any suspicious paths hit directly in the table.
- Add new paths to your watchlist on-the-fly using the "Add to Suspicious List" feature.
Being conservative with credits we keep an ip cache file as well automatically.
### NGINX
`combined.log` is a quick dump of nginx access logs. It is provided in the app as data to test. If you are not having luck when running your own, check your nginx config:
To display the referrer in Nginx access logs, ensure your `log_format` configuration includes the `$http_referer` variable.
I have in my `nginx.conf` the following:
```
# Logging
log_format custom_format '$remote_addr - $remote_user [$time_local] '
'"$request" $status $body_bytes_sent '
'"$http_referer" "$http_user_agent"';
access_log /var/log/nginx/access.log custom_format;
error_log /var/log/nginx/error.log warn;
```
Then in my domain conf:
```
# logging
access_log /var/log/nginx/site.com.access.log custom_format buffer=512k flush=1m;
error_log /var/log/nginx/site.com.error.log warn;
```
Reload
```
sudo systemctl reload nginx
```
Thanks for checking it out, let me know what you think. We look forward to future iterations and new features.
#IP2LocationContest #ProgrammingContest
Log Analyzer concept by Ray Kooyenga
@deadflowers @rkooyenga