https://github.com/deadtrickster/beam-dashboards
BEAM :heart: Prometheus :heart: Grafana
https://github.com/deadtrickster/beam-dashboards
dashboard elixir erlang grafana monitoring prometheus
Last synced: over 1 year ago
JSON representation
BEAM :heart: Prometheus :heart: Grafana
- Host: GitHub
- URL: https://github.com/deadtrickster/beam-dashboards
- Owner: deadtrickster
- License: apache-2.0
- Created: 2017-02-11T16:00:04.000Z (over 9 years ago)
- Default Branch: master
- Last Pushed: 2020-02-24T18:33:51.000Z (over 6 years ago)
- Last Synced: 2025-02-14T04:43:57.995Z (over 1 year ago)
- Topics: dashboard, elixir, erlang, grafana, monitoring, prometheus
- Homepage:
- Size: 1.3 MB
- Stars: 288
- Watchers: 16
- Forks: 42
- Open Issues: 4
-
Metadata Files:
- Readme: README.md
- License: LICENSE
Awesome Lists containing this project
README
# BEAM Dashboards
A collection of Grafana dashboards for visualizing [Prometheus](https://github.com/deadtrickster/prometheus.erl) BEAM metrics.
- IRC: #erlang on Freenode;
- Slack: #prometheus channel - Browser or App(slack://elixir-lang.slack.com/messages/prometheus).
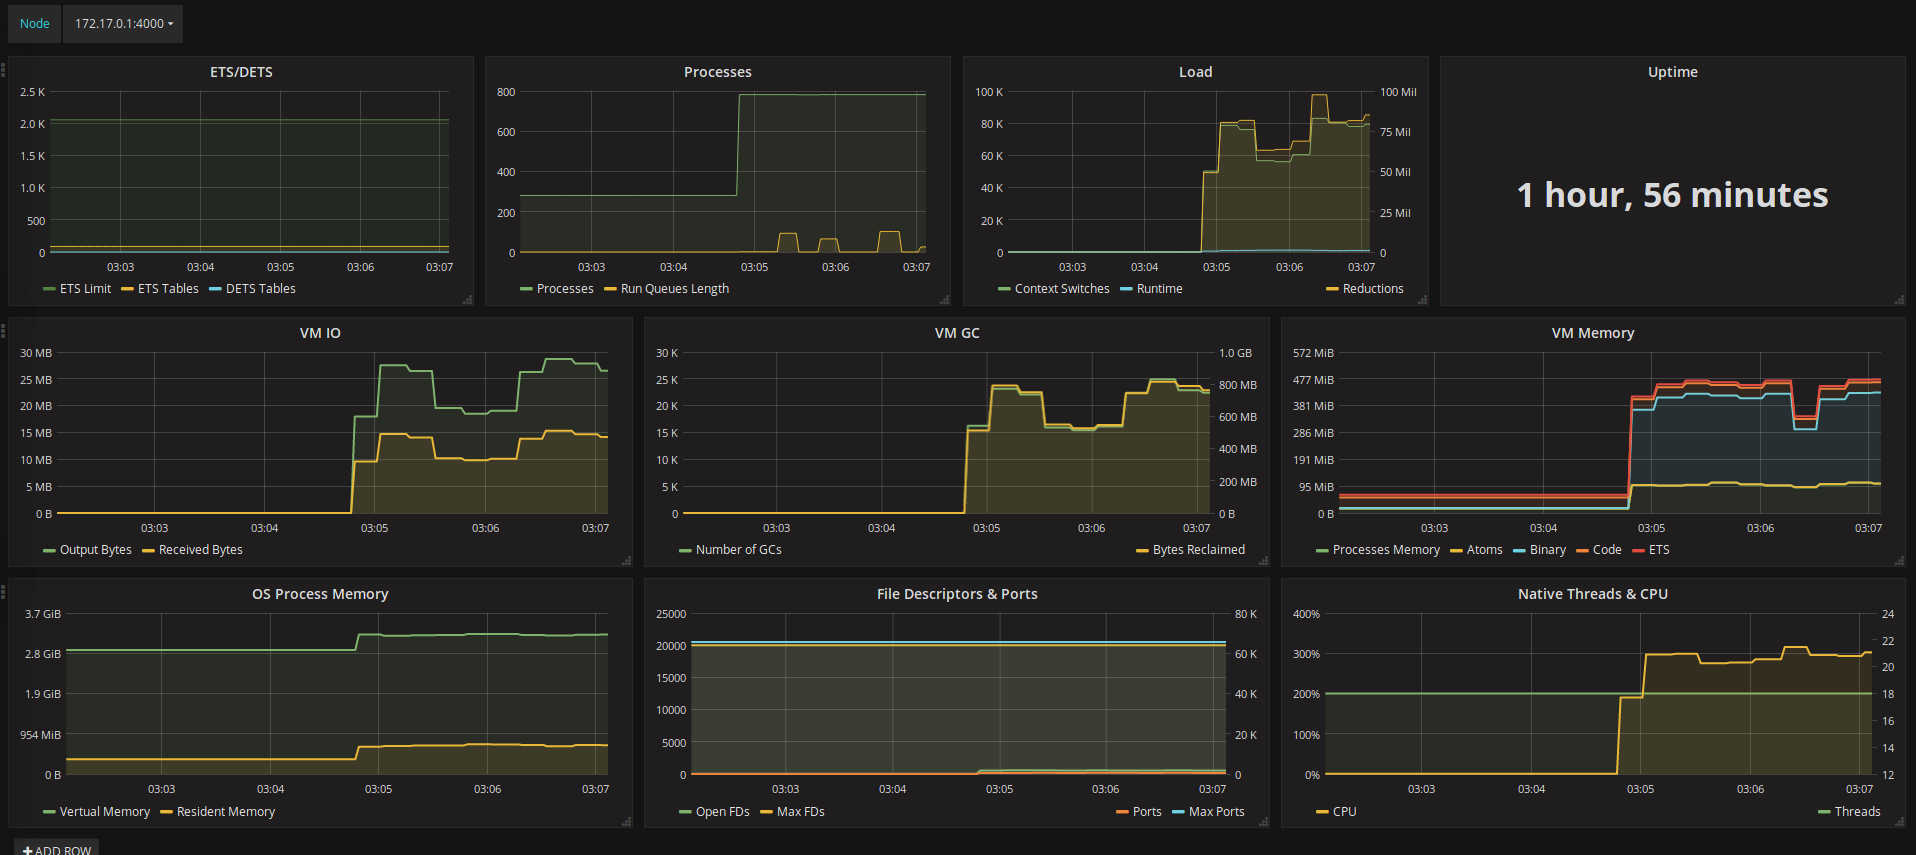
BEAM Dashboard:
BEAM Memory Allocators Dashboard:

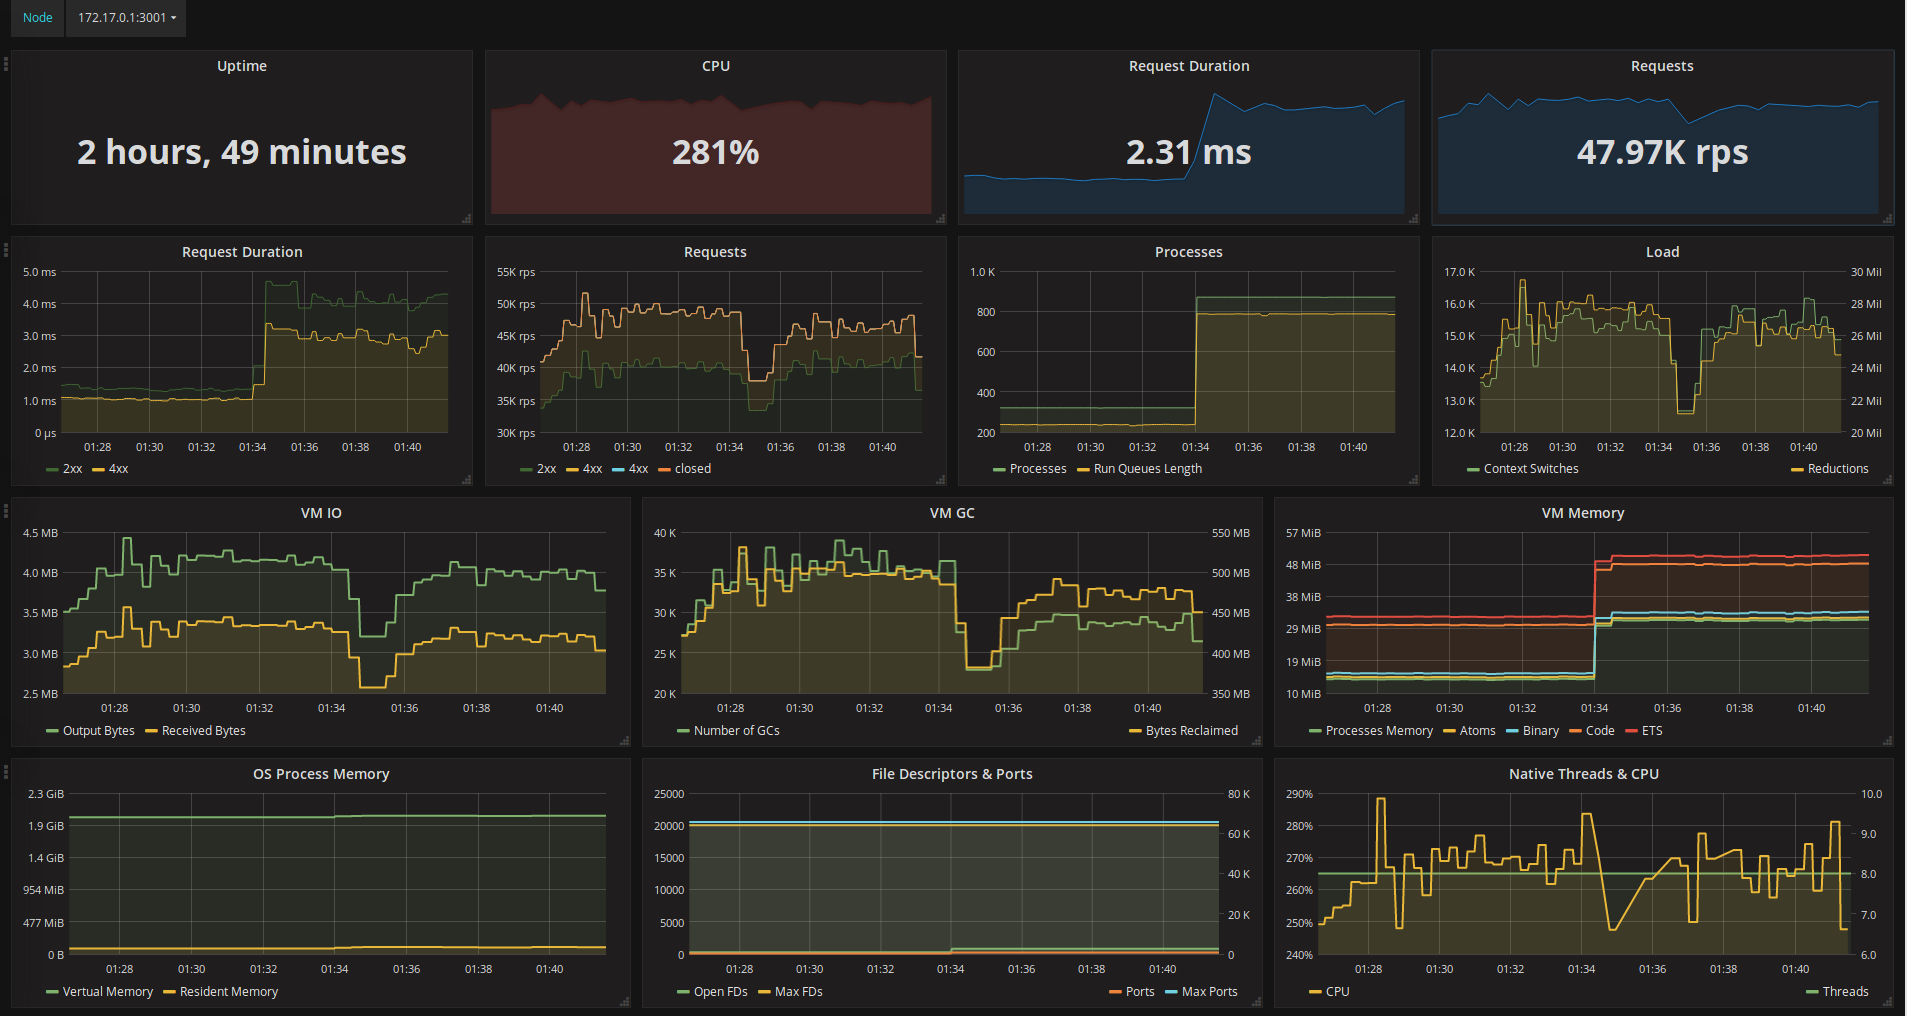
Elli Dashboard:
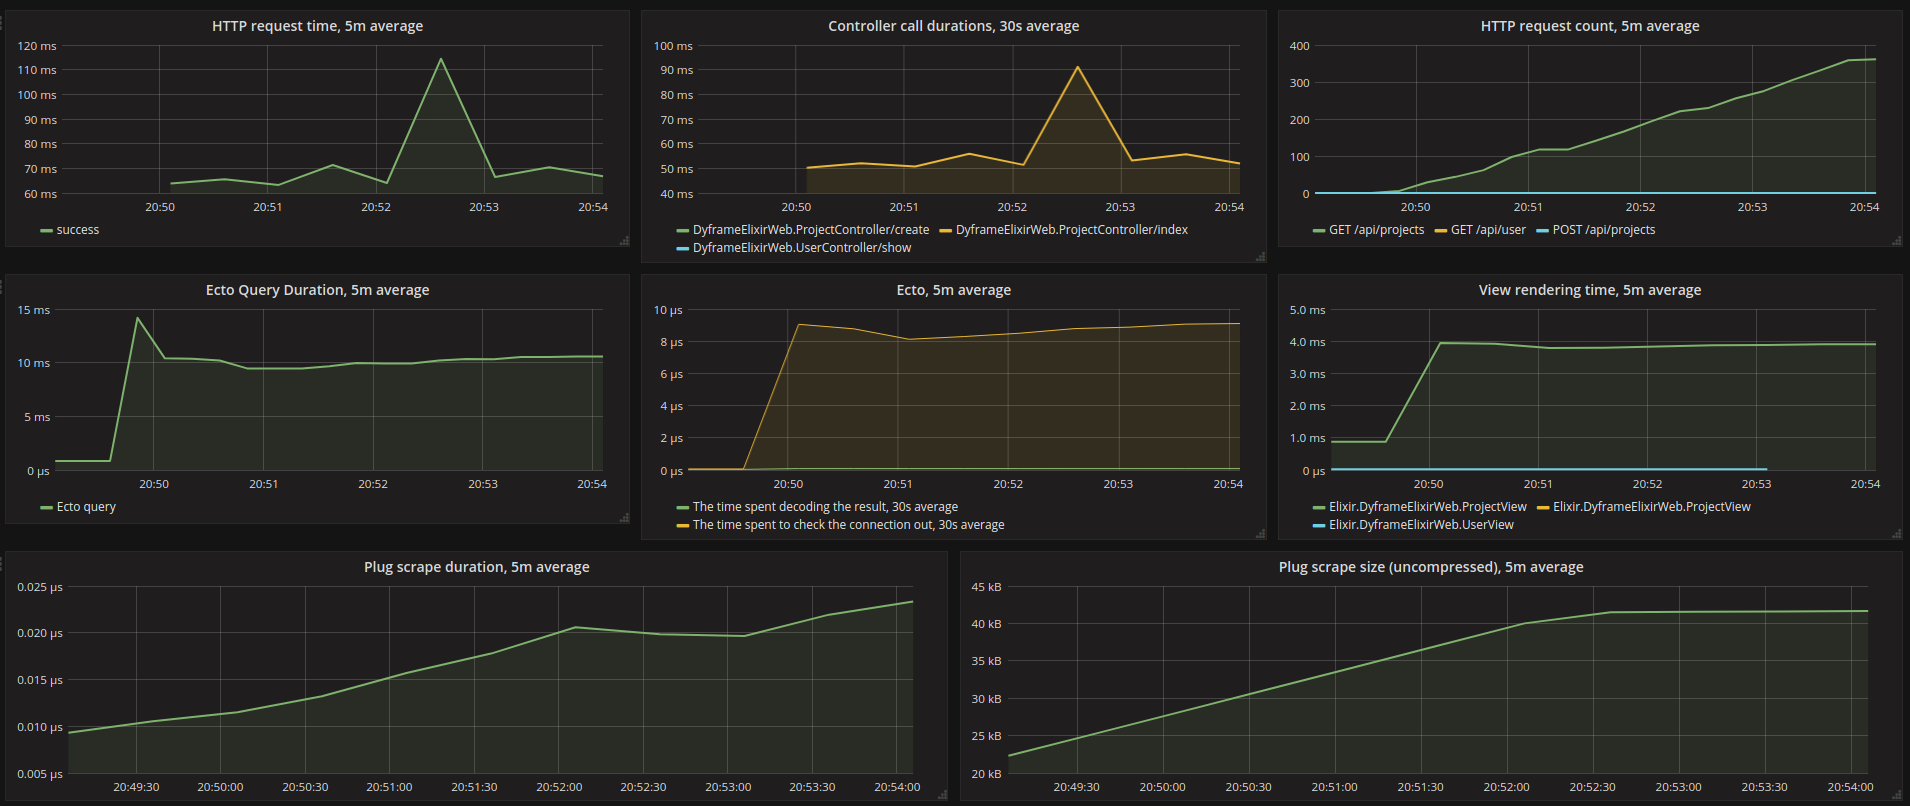
Plugs/Phoenix/Ecto Dashboard:
## TODO
- RabbitMQ