https://github.com/defuse/elfplayer
Visualize an ELF's execution
https://github.com/defuse/elfplayer
Last synced: about 1 year ago
JSON representation
Visualize an ELF's execution
- Host: GitHub
- URL: https://github.com/defuse/elfplayer
- Owner: defuse
- License: mit
- Created: 2014-12-28T17:43:03.000Z (over 11 years ago)
- Default Branch: master
- Last Pushed: 2014-12-28T18:02:43.000Z (over 11 years ago)
- Last Synced: 2025-03-25T02:51:18.923Z (over 1 year ago)
- Language: JavaScript
- Size: 223 KB
- Stars: 10
- Watchers: 2
- Forks: 3
- Open Issues: 5
-
Metadata Files:
- Readme: README.md
- License: LICENSE
Awesome Lists containing this project
README
ELFPlayer
============
ELFPlayer is a tool for visualizing the execution of 32-bit x86 ELFs (with
symbols). This can be useful for getting a better understanding of what your
code is doing, crafting exploits, or side-channel analysis.
**Currently, ELFPlayer is prototype quality. This is a beta release.**
ELFPlayer is made up of three components: The tracer, encoder, and player.
Tracer
--------
The tracer is a C program that uses ptrace to save all of the EIP values as your
program executes. To use it, pass the output file on the command line followed
by the command to execute under ptrace (just like `strace`).
For exaple, if you've built the `hello` sample in the `samples` directory (by
`gcc -m32 hello.c -o hello`), here's how you trace it (with an unnecessary
command-line argument for demonstration):
```
$ ./tracer/tracer ./output ./samples/hello --an-argument-to-hello
```
This will save all of the EIP values to `./output.`. To visualize it, you first
have to encode it into a JSON file that the player supports. Use the encoder
tool to do that.
Encoder
--------
The encoder (Ruby script) transforms the tracer's output into an easy-to-parse
JSON file for the player to play. Supposing we ran the tracer on
`./samples/hello` and its output is saved in `./output`, the command to encode
is:
```
$ ruby encoder/encode.rb -b ./samples/hello -o ./player/out.json ./output
```
This will write the encoded JSON into `./player/out.json`, the location the
player expects its input to be.
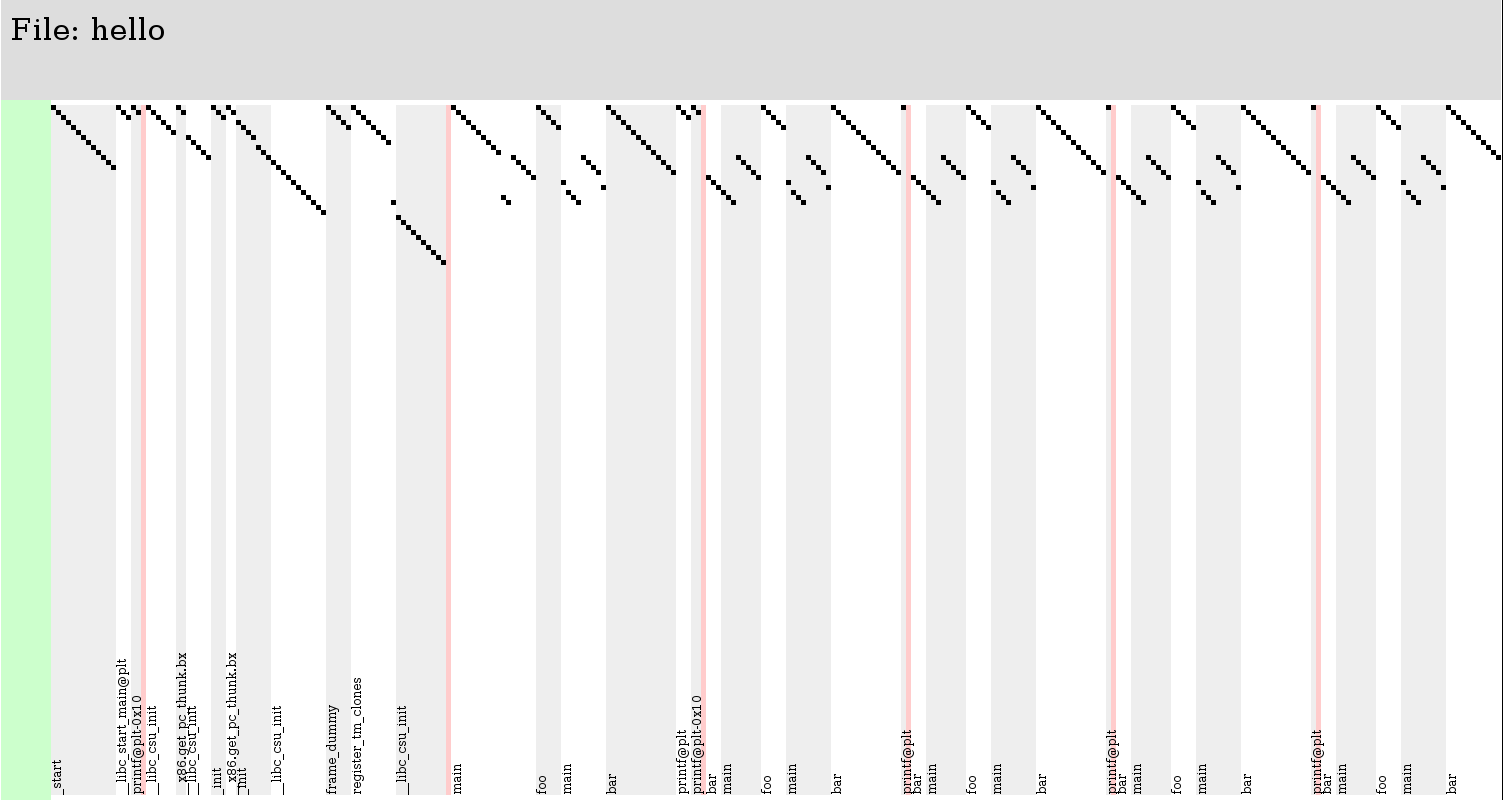
Player
--------
The player is an HTML5 Canvas web page that fetches the JSON file and displays
a visualization of the execution. It currently supports only very primitive
scrolling by using the mousewheel or by clicking the scrollbars on the left or
the top. To open it, run:
```
$ firefox ./player/ptrace.html
```
For now, it will probably only work with firefox. I haven't tested it with
anything else.
Red columns represent continuous sequences of EIP values which were not in
regions known to the encoder. For example, if execution jumps into glibc for 100
instructions, those 100 instructions are displayed as a single red column. Blue
dots on the top or bottom mean there is an instruction above or below the view,
respectively. Use the (shitty) left scrollbar to bring them into view.