https://github.com/devalone/machine-learning-course-by-andrew-ng-in-rust
Implementation of algorithms from machine learning course by Andrew Ng https://www.coursera.org/learn/machine-learning/
https://github.com/devalone/machine-learning-course-by-andrew-ng-in-rust
andrew-ng-course andrew-ng-coursera andrew-ng-machine-learning andrew-ng-ml-course linear-regression logistic-regression machine-learning neural-networks rust
Last synced: about 1 month ago
JSON representation
Implementation of algorithms from machine learning course by Andrew Ng https://www.coursera.org/learn/machine-learning/
- Host: GitHub
- URL: https://github.com/devalone/machine-learning-course-by-andrew-ng-in-rust
- Owner: DevAlone
- Created: 2021-03-25T20:03:00.000Z (over 4 years ago)
- Default Branch: master
- Last Pushed: 2022-02-09T21:17:28.000Z (over 3 years ago)
- Last Synced: 2025-08-12T21:08:53.106Z (about 2 months ago)
- Topics: andrew-ng-course, andrew-ng-coursera, andrew-ng-machine-learning, andrew-ng-ml-course, linear-regression, logistic-regression, machine-learning, neural-networks, rust
- Language: Rust
- Homepage:
- Size: 15.4 MB
- Stars: 1
- Watchers: 1
- Forks: 1
- Open Issues: 0
-
Metadata Files:
- Readme: README.md
Awesome Lists containing this project
README
# machine-learning-course-by-andrew-ng-in-rust
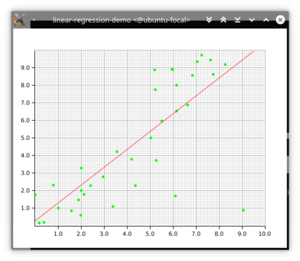
## Week 1
`week1` dir contains linear regression demo for the first week.
Just run it, click to create additional points and see how it converges.

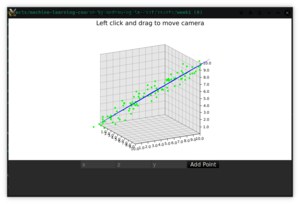
## Week 2
`week2` dir contains linear regression with multiple features demo for the second week. The implementation works with
any number of features, but we use 2 because human beings have troubles perceiving more than 3 dimensions.
You can left click the image and rotate it with the mouse and add points by the inputs on the bottom.
There 2 algorithms: linear regression and normal equation and you can switch between them by
changing `USE_NORMAL_EQUATION` in `src/constants.rs` file

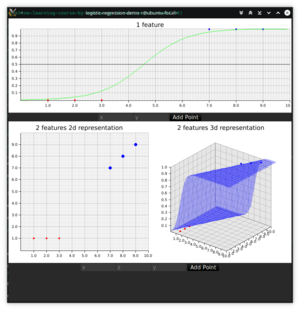
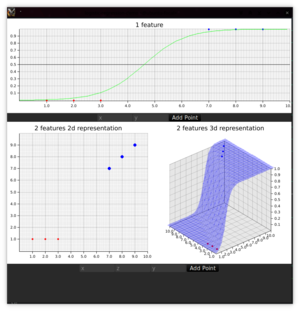
## Week 3
`week3` dir contains a demo for logistic regression with 1 and 2 features. For 2 features there's a 2d visualization
where x, y and size of the dot are original data. For 3 features we visualize points in 3d space and prediction function
as a sigmoid surface. You can add new points and see how the surface will get adjusted.
## Week 4
There's no demo for week 4 since week 5's demo includes the material from week 4.