https://github.com/devnamdev2003/angular-expense-tracker
📱 A mobile-first Expense Tracker built with Angular & Tailwind CSS, featuring dashboards, calendar, budget tracking, and LocalStorage-based data management
https://github.com/devnamdev2003/angular-expense-tracker
android-application angular expense-manager expense-tracker money-manager spend-analysis tailwindcss typescript
Last synced: 2 months ago
JSON representation
📱 A mobile-first Expense Tracker built with Angular & Tailwind CSS, featuring dashboards, calendar, budget tracking, and LocalStorage-based data management
- Host: GitHub
- URL: https://github.com/devnamdev2003/angular-expense-tracker
- Owner: devnamdev2003
- Created: 2025-04-08T16:21:23.000Z (over 1 year ago)
- Default Branch: main
- Last Pushed: 2026-04-04T03:49:32.000Z (3 months ago)
- Last Synced: 2026-04-04T05:28:11.486Z (3 months ago)
- Topics: android-application, angular, expense-manager, expense-tracker, money-manager, spend-analysis, tailwindcss, typescript
- Language: TypeScript
- Homepage: https://devnamdev2003.github.io/angular-expense-tracker/
- Size: 73.1 MB
- Stars: 1
- Watchers: 1
- Forks: 0
- Open Issues: 0
-
Metadata Files:
- Readme: README.md
- Security: SECURITY.md
Awesome Lists containing this project
README
# [📘 Expense Tracker](https://exwise.vercel.app/)
> ### Expense Wisely – Where Your Money Stops Playing Hide and Seek!
## 📌 Overview
**Expense Tracker** is a mobile-first financial management application designed to help users easily track their daily and monthly expenses. The application emphasizes a user-friendly UI/UX tailored specifically for smartphones, allowing seamless personal finance management on the go.
This application leverages **Angular** as the frontend framework and **Tailwind CSS** for responsive and modern UI styling. All user data is stored in **LocalStorage**, making the app lightweight and independent of backend dependencies.
---
⬇️ Download APK | 🌐 Live Demo | 🔗 GitHub | 📄 Code Documentation
---
## 🧰 Tech Stack
| Technology | Purpose |
| -------------------- | ------------------------------- |
| Angular | Frontend application logic |
| Tailwind CSS | Styling and responsive UI |
| LocalStorage | Persistent data storage |
| Spring Boot | Backend api logic |
---
## 📱 Features & Functionality
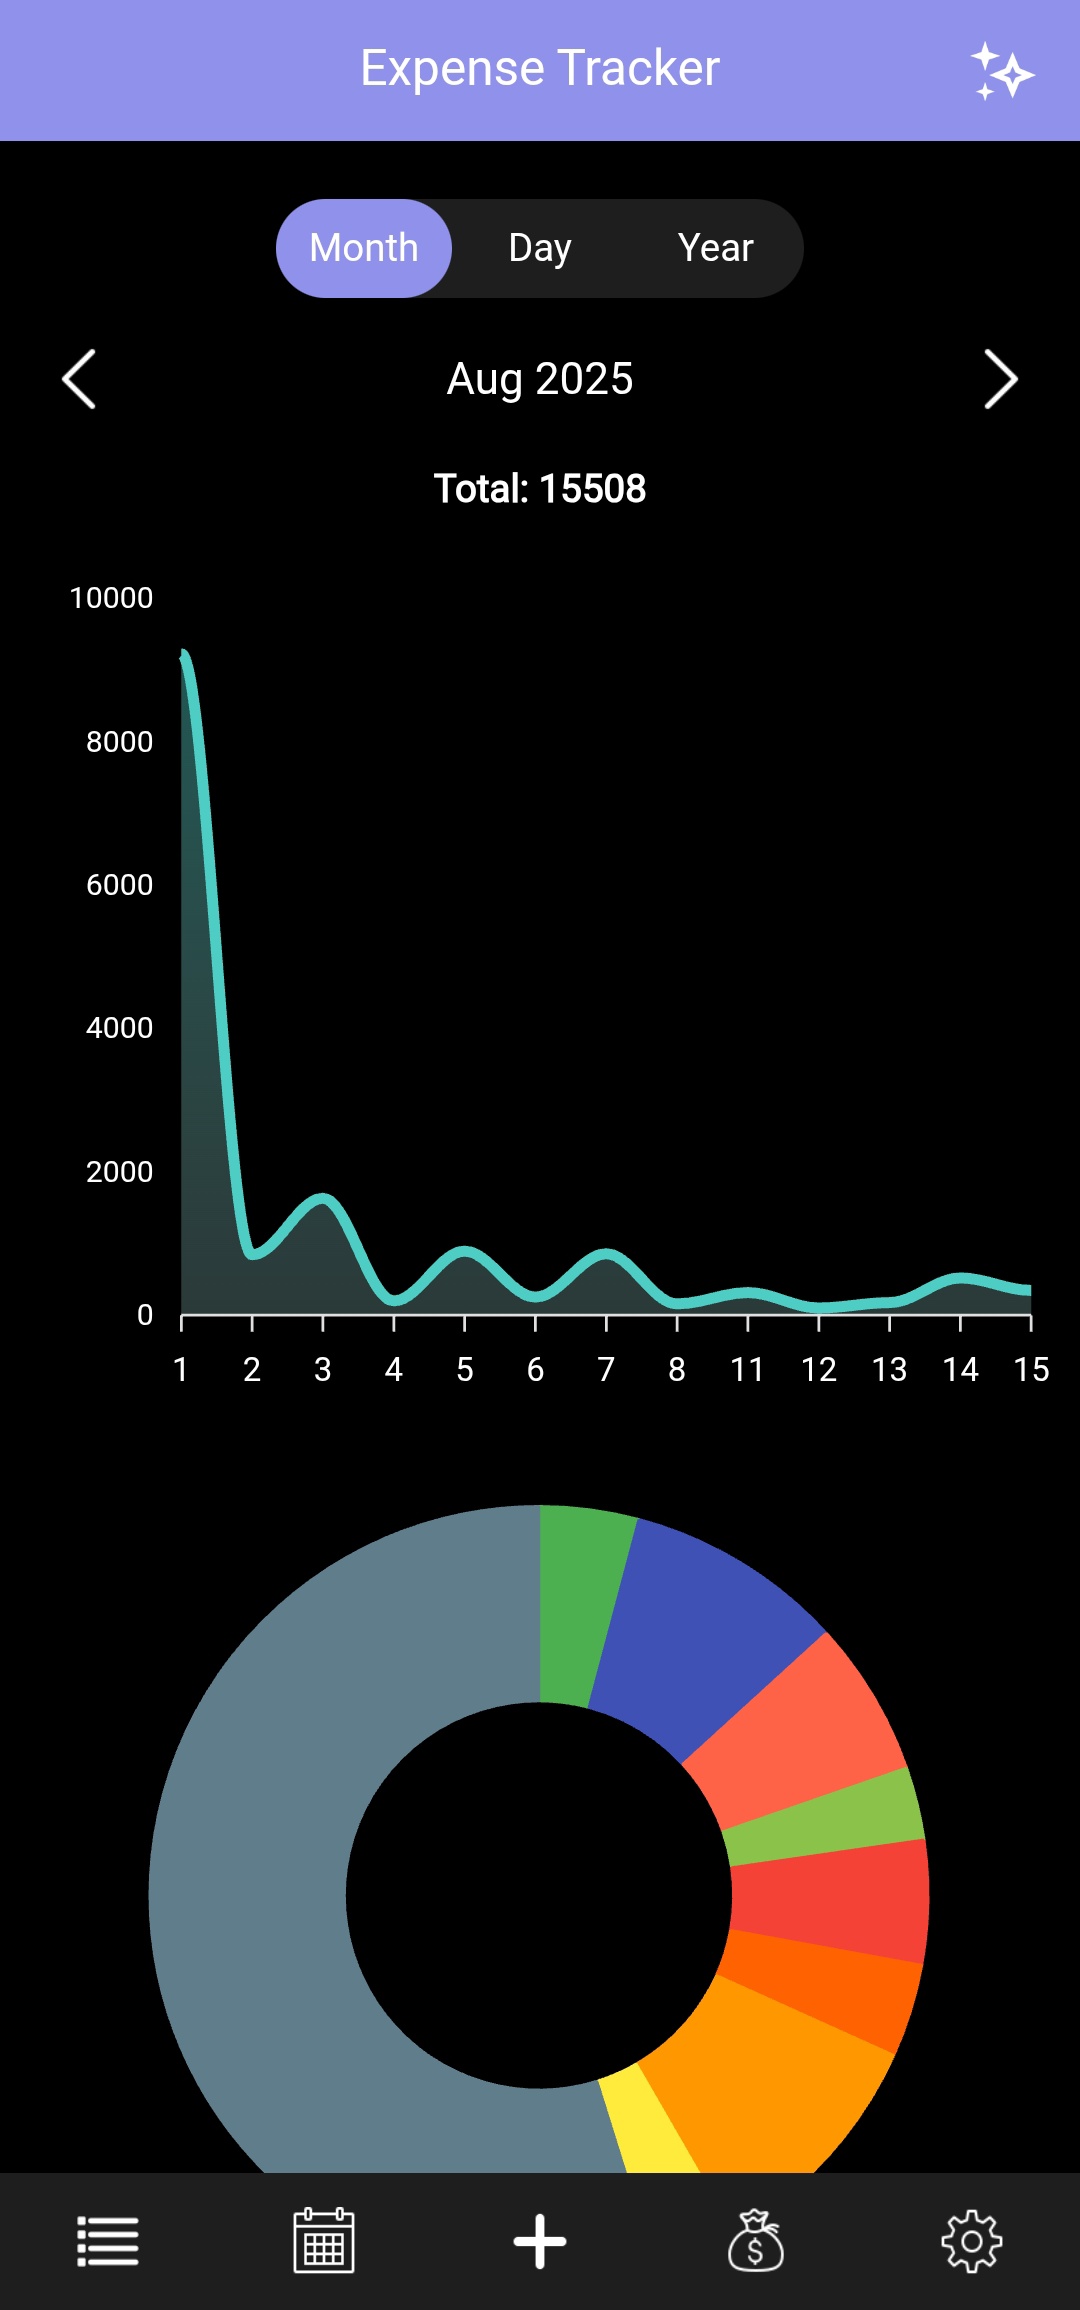
### 1. **Dashboard View**
* Upon launch, users are greeted with two interactive graphs:
* **Expense Graph**:
- Displays a line graph representing user expenses over time.
- Supports multiple **time-based views**:
- **Daily** – View expenses for individual days.
- **Monthly** – View month-wise expense distribution.
- **Yearly** – View yearly expense trends.
- Includes a **graph representation toggle**:
- **Discrete (discrete values)** – Shows period-wise expense values.
- **Cumulative** – Shows a running total of expenses over time, useful for understanding overall spending growth.
- Graph updates dynamically based on the selected time range and graph mode.
* **Category-wise Pie Chart**: Visualizes how the expenses are distributed across different categories (e.g., Food, Travel, Shopping).
---
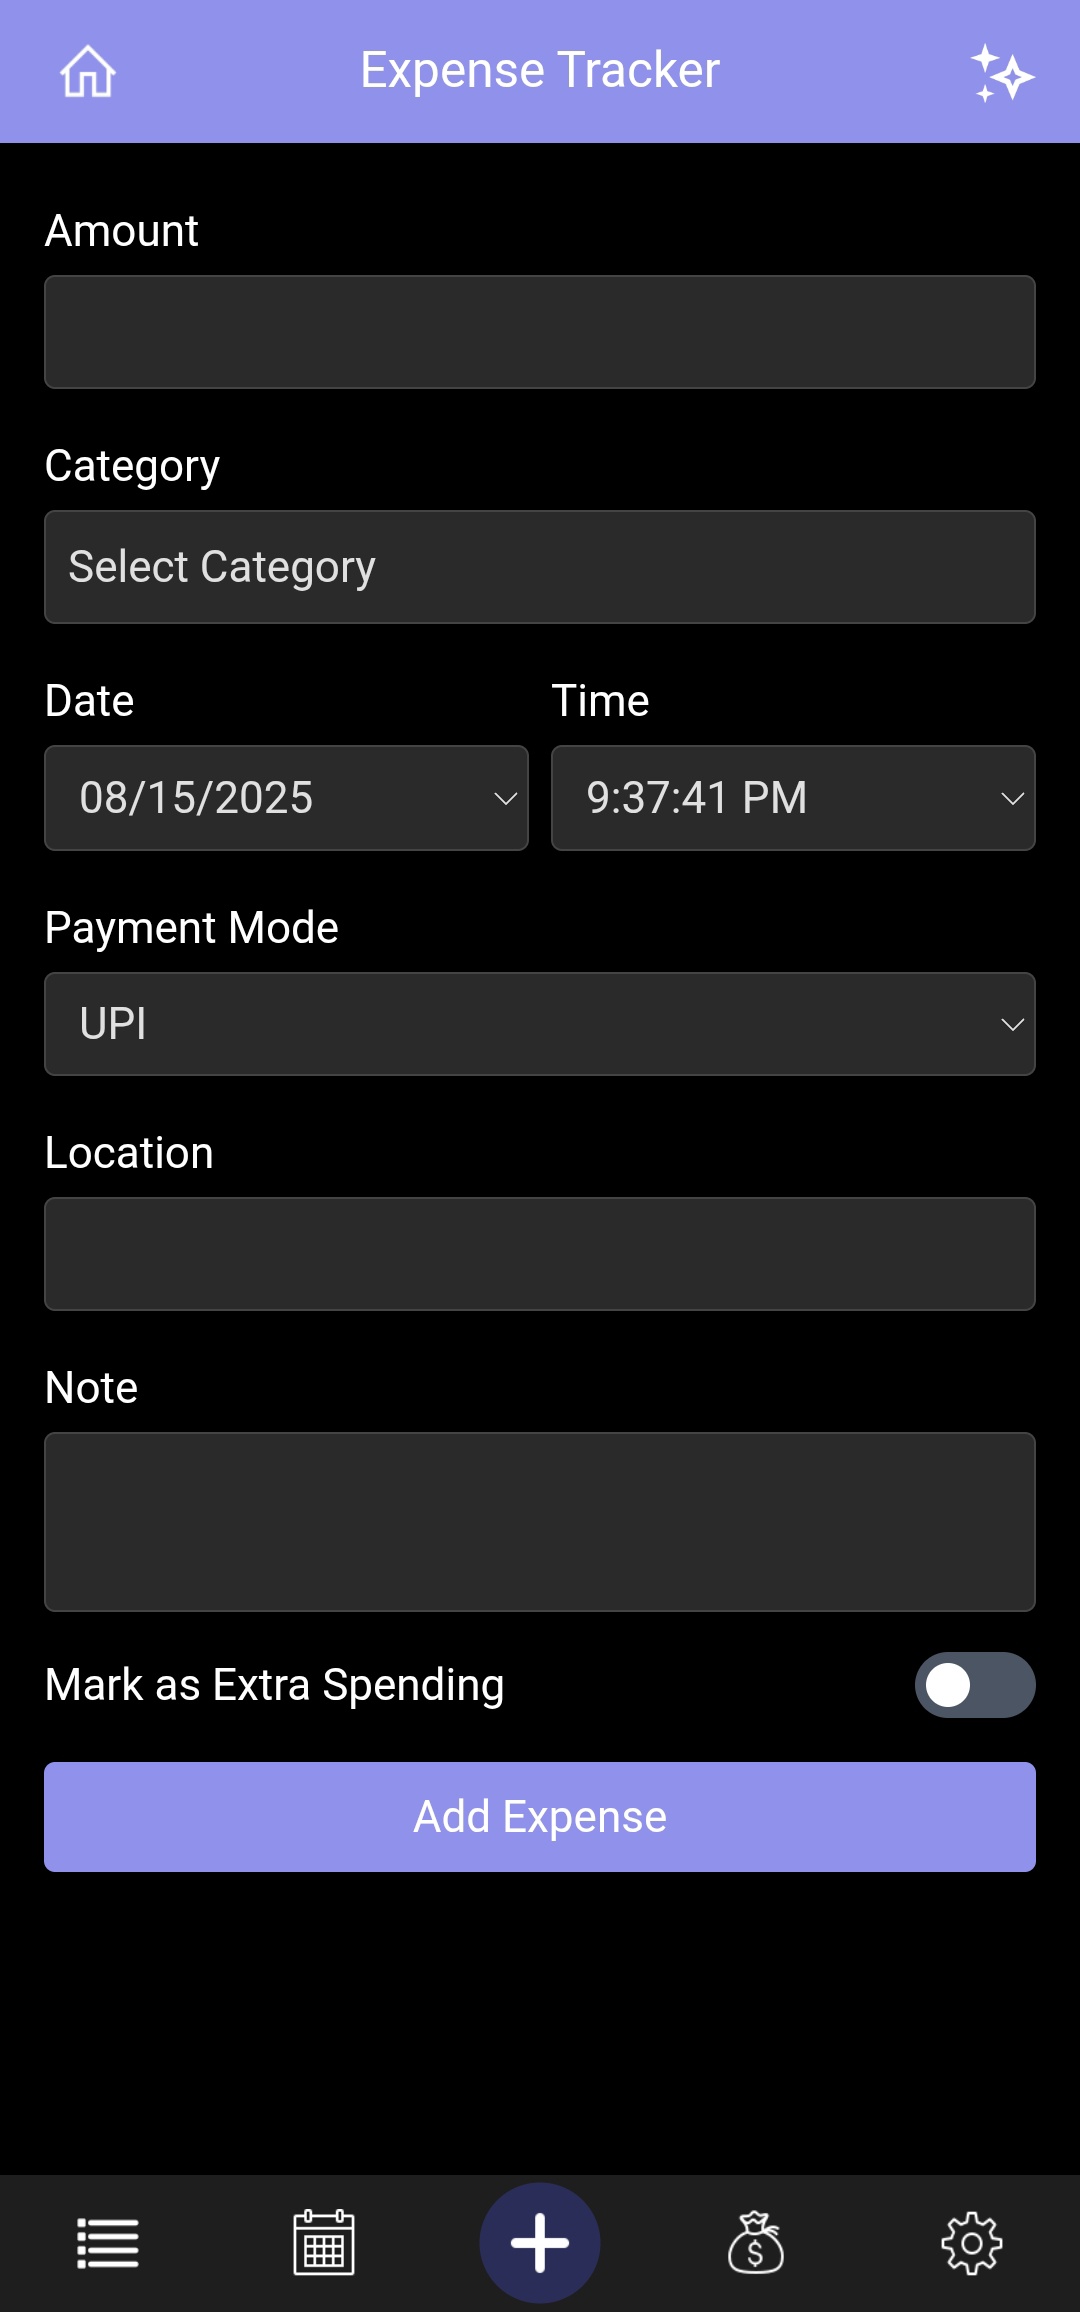
### 2. **Add Expense View**
Allows users to add new expense entries through a form. Input fields include:
* 💰 **Amount**
* 📅 **Date & Time**
* 🏷️ **Category** (chosen from a dropdown list)
* 💳 **Payment Mode**
* 📍 **Location** (chosen from a dropdown list or manually typed)
* 📝 **Note** (chosen from a dropdown list or manually typed)
* 💡 **Extra Spending**
All expenses are stored in the device's **LocalStorage** and reflected immediately in graphs and listings.
---
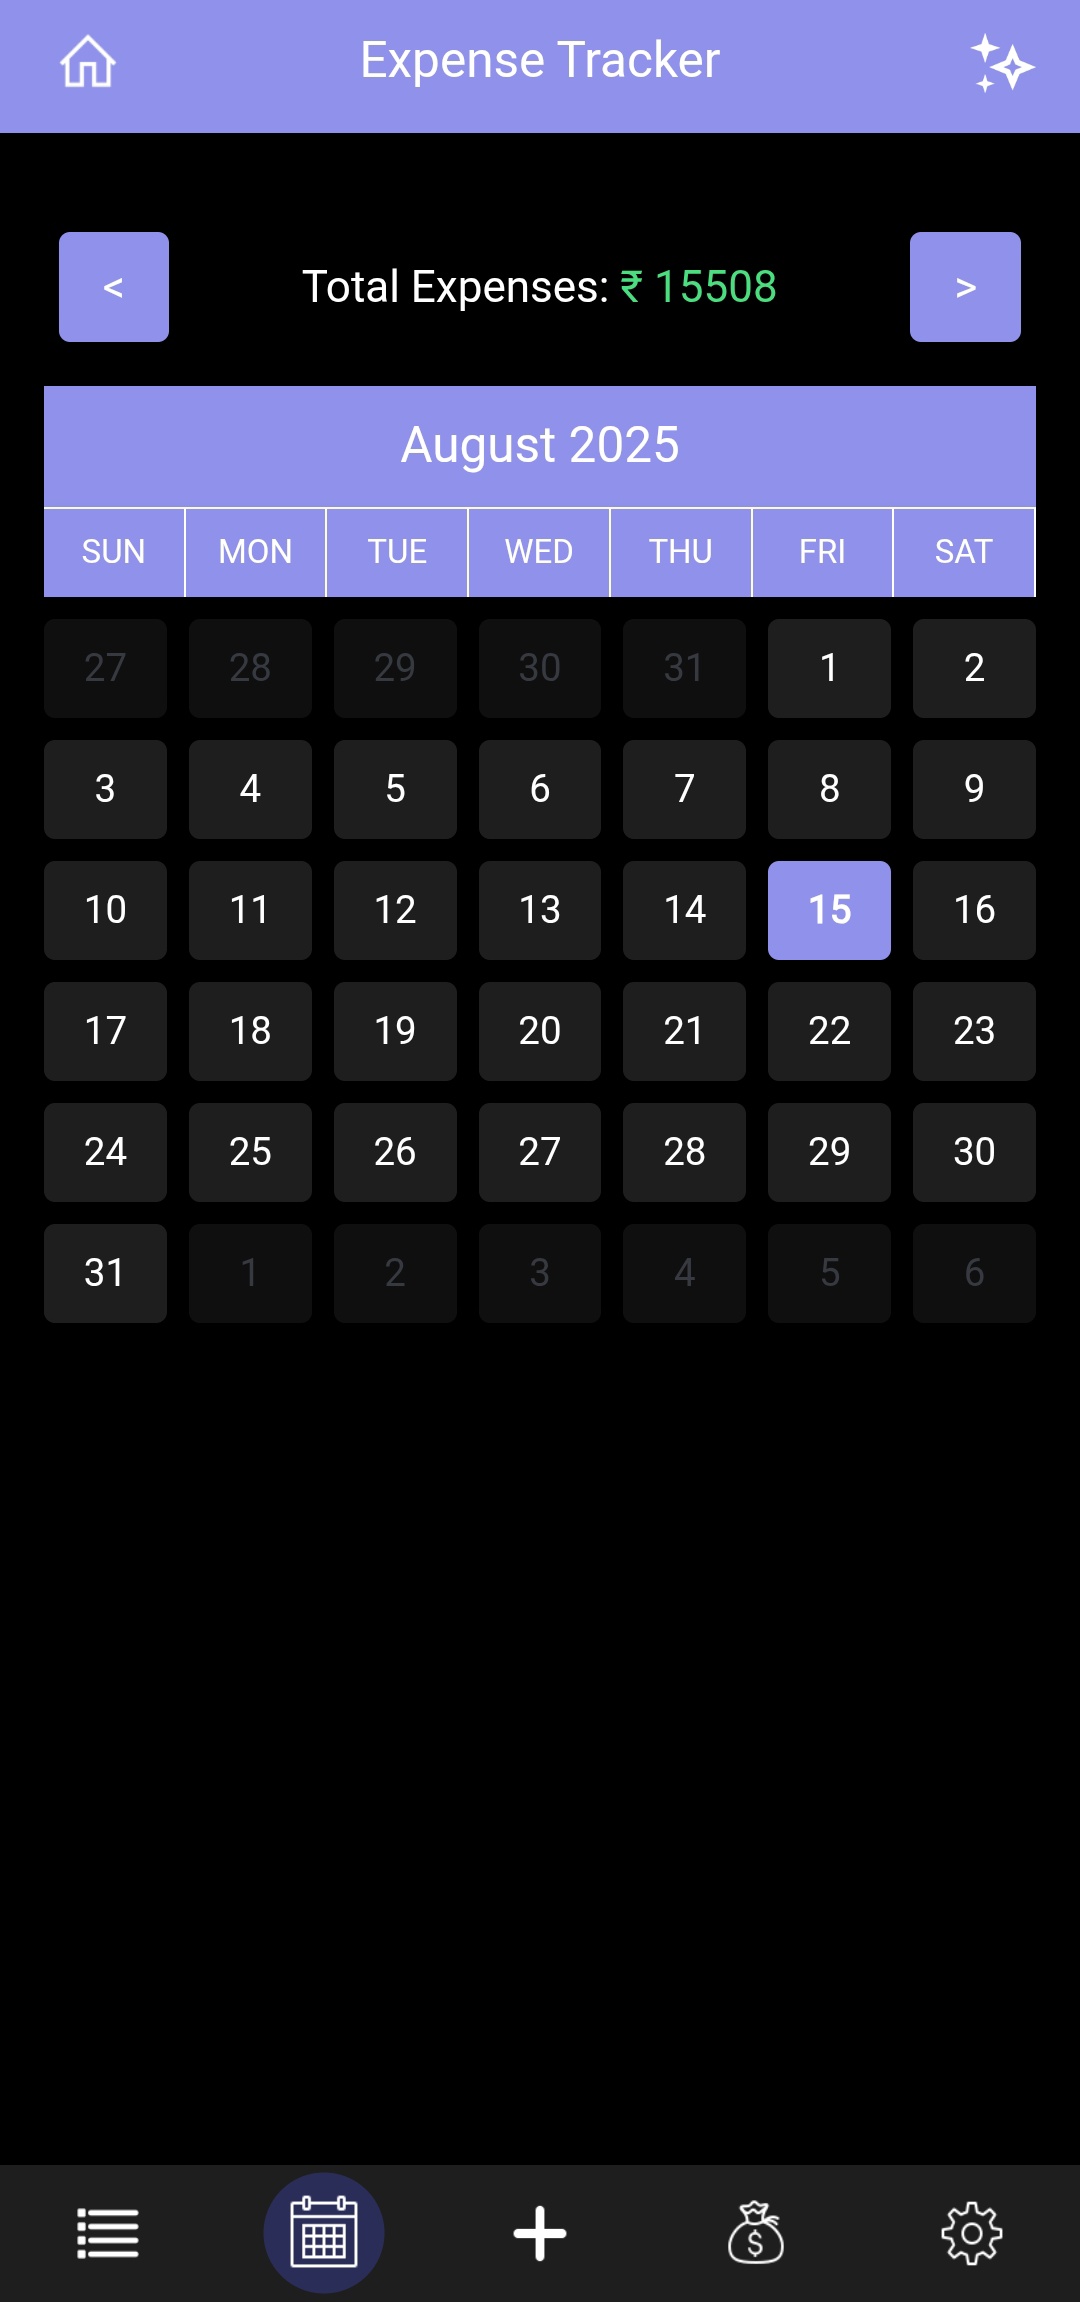
### 3. **Calendar View**
* Users can view a **monthly calendar** to explore expenses on specific dates.
* Tap any date to open a **popup modal** displaying all expenses for that day.
* Navigate across **months and years** to view past or future expenses.
* Toggle the Show HeatMap switch to highlight each day based on spending intensity.
* Days are color-coded based on spending thresholds (e.g. No expense, < threshold, between thresholds, > threshold) for quick insights.
* Users can now **customize the threshold amounts** for each heatmap color:
* **Red (Rose)** – default > ₹1000
* **Yellow (Amber)** – default ₹500 - 1000
* **Green (Emerald)** – default < ₹500
* A **summary table** displays each color, the number of days, the total expense, and an **Edit button** for updating the thresholds.
* Editing allows users to set a new amount for the corresponding color, immediately updating the heatmap visualization.
* Additionally, users can enable a radio option to automatically set threshold values based on their budget, where
* Rose represents the average spent per day amount.
* Emerald represents the suggested spending per day amount.
---
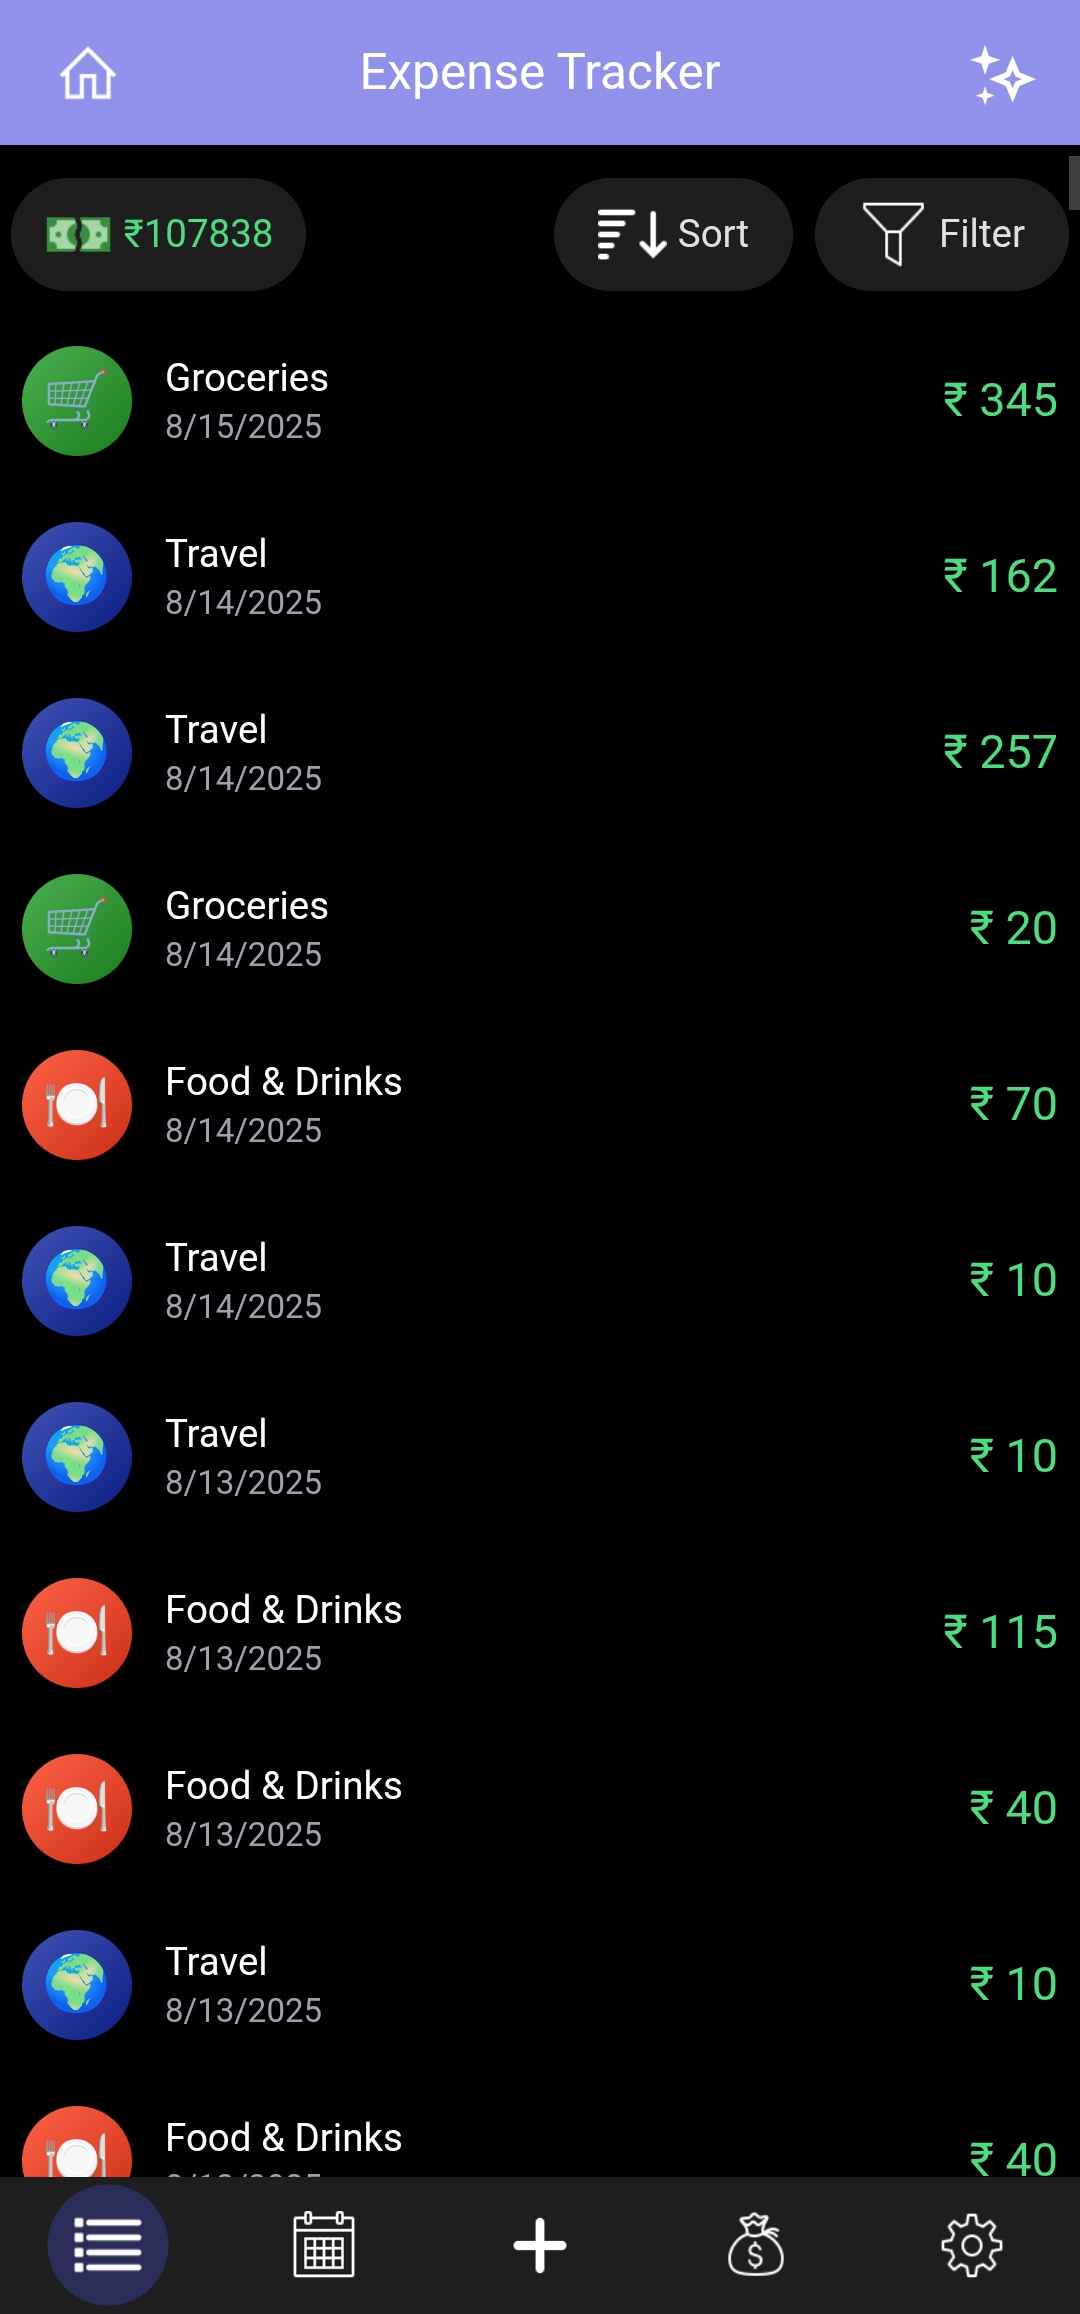
### 4. **List View**
* Displays all user expenses in a scrollable, and sortable list.
* Users can:
* 🔍 **Search** expenses quickly by typing keywords (category, note, or payment mode).
* 🧾 **Sort** expenses by date, amount, or category.
* 🎯 **Filter** by category, date, extra spending, and payment mode.
* 🖱️ Tap any entry to open a **modal** with complete details and options to **edit** or **delete** the expense.
---
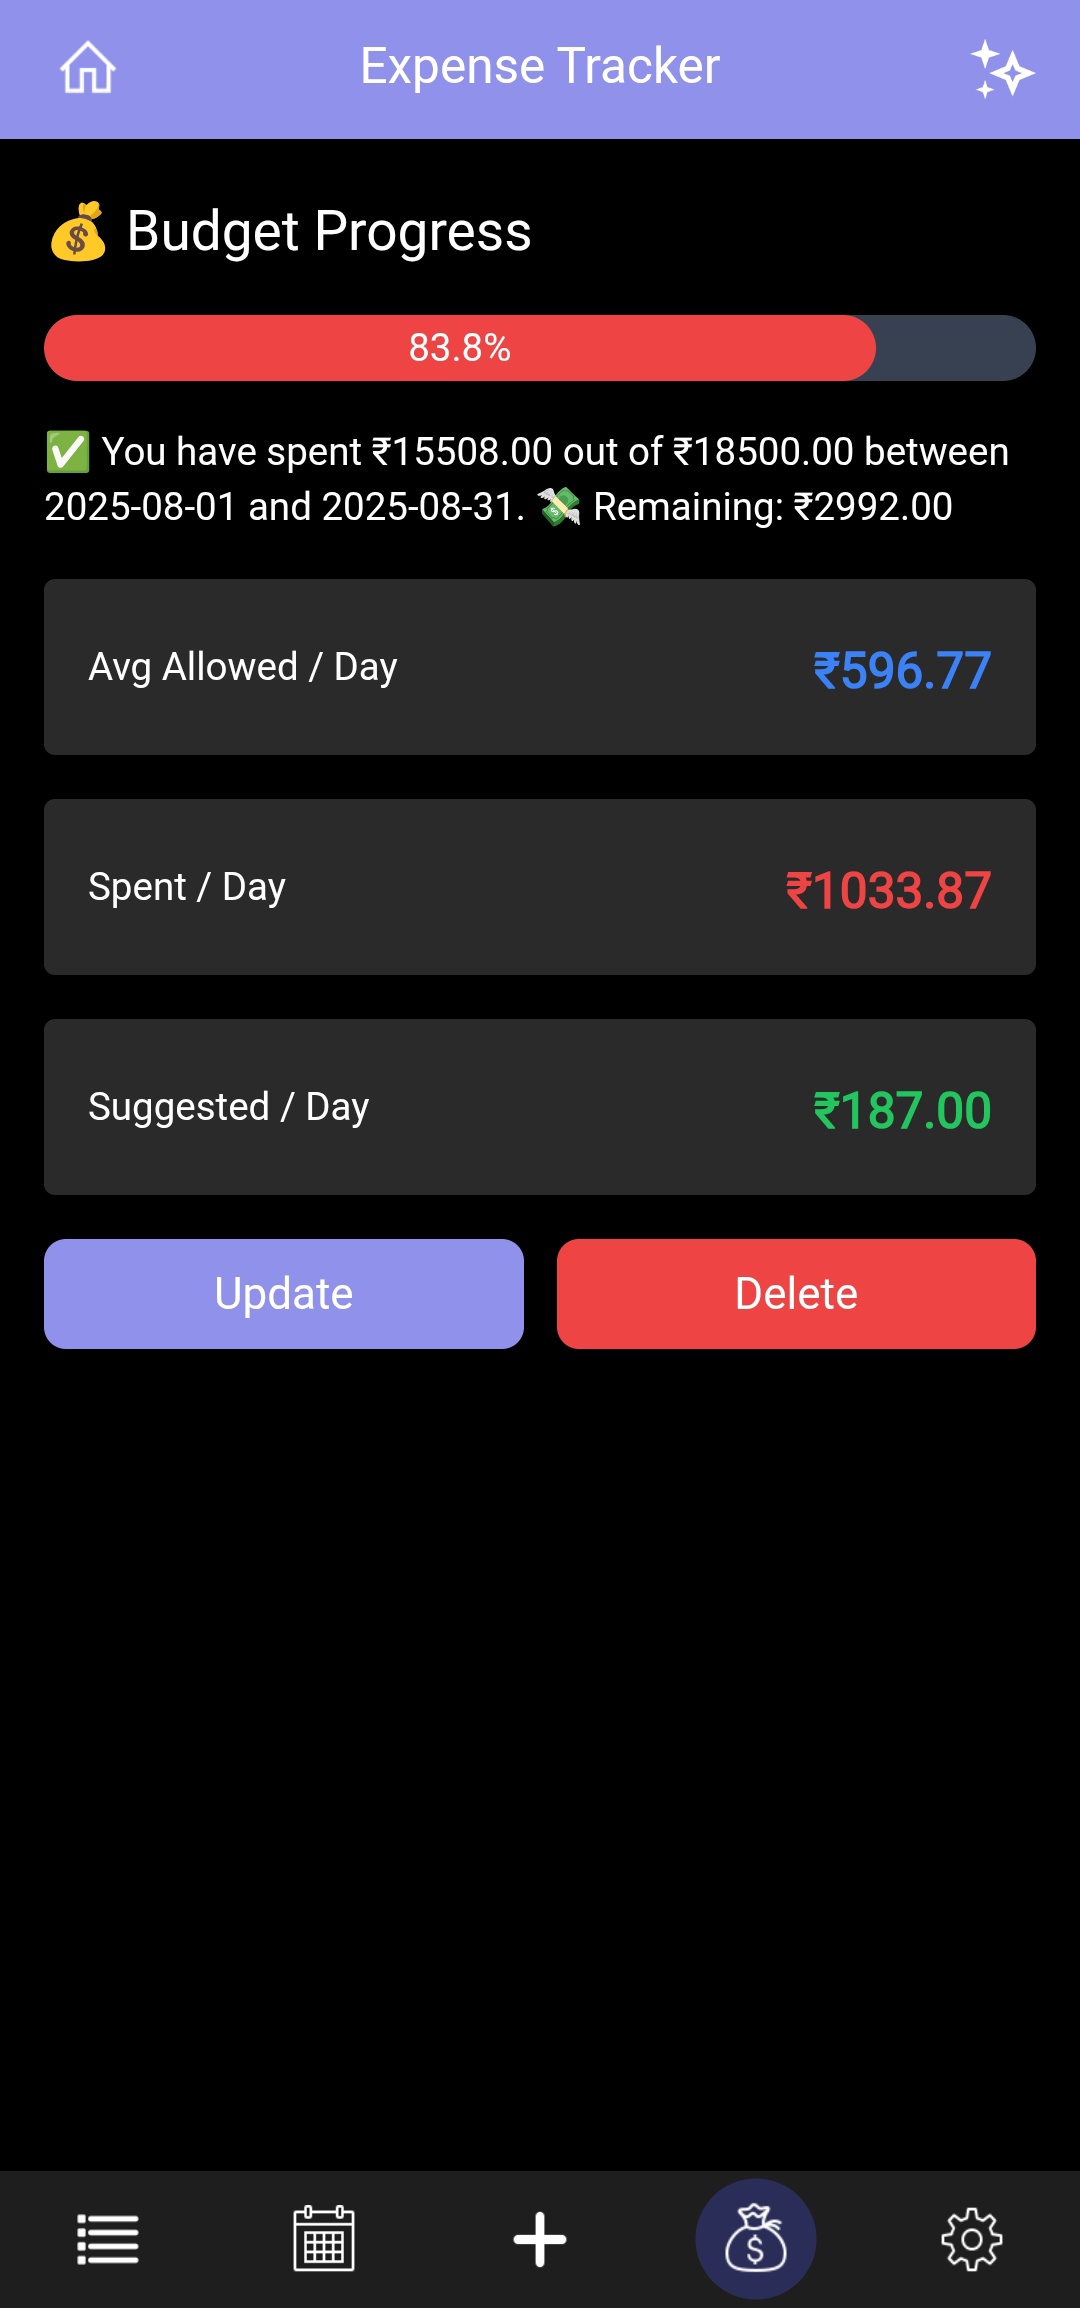
### 5. **Budget & Income Management**
The **Budget & Income** module provides a sophisticated financial dashboard that transitions between total income tracking and granular monthly budgeting, along with advanced filtering capabilities for deeper financial insights.
**Key capabilities include:**
* 💼 **Dynamic Financial Modes**
* **Income Tracking:** Tracks total accumulated income and overall savings rates.
* **Budget Tracking:** Focuses on a specific month's limits to prevent overspending.
* The system intelligently calculates metrics based on the active `viewMode`.
* 🔎 **Income Date Range Filtering**
* Users can filter income records between a selected **start month and end month**.
* Displays income analytics based only on the selected period.
* Allows better financial analysis such as:
* Tracking income trends over time.
* Reviewing earnings for specific periods.
* Simplifying historical income comparisons.
* 📊 **Advanced Financial Analytics**
* **Income Growth:** Automatically calculates the percentage increase or decrease in income compared to the previous month.
* **Savings Rate:** Real-time calculation of the percentage of income retained after expenses.
* 📅 **Daily Spending Intelligence**
* **Allowed/Day:** Your theoretical daily limit based on the total budget and days in the month.
* **Spent/Day:** Actual average spending calculated from the day of your first expense to today.
* **Suggested/Day:** A dynamic "correction" metric that tells you exactly how much you can spend for the remaining days to stay on target.
* 🎨 **Visual Feedback & Progress**
* **Smart Progress Bar:** A multi-state indicator that shifts colors based on your spending velocity:
* 🟢 **Green to Indigo:** (Below 50%) – Safe zone.
* 🟠 **Orange:** (50%–90%) – Warning zone.
* 🔴 **Red:** (Above 90%) – Critical limit / Exceeded.
* **Contextual Status:** Text insights (e.g., *"Excellent! Saving > 50%"* or *"⚠️ You have exceeded your limit!"*).
* 🛠️ **Transaction Management**
* **Full CRUD Operations:** Add, edit, and delete income/budget records.
* **Validation Layer:** Integrated error handling for:
* Maximum amount limits
* Required notes
* Month selection validation
---
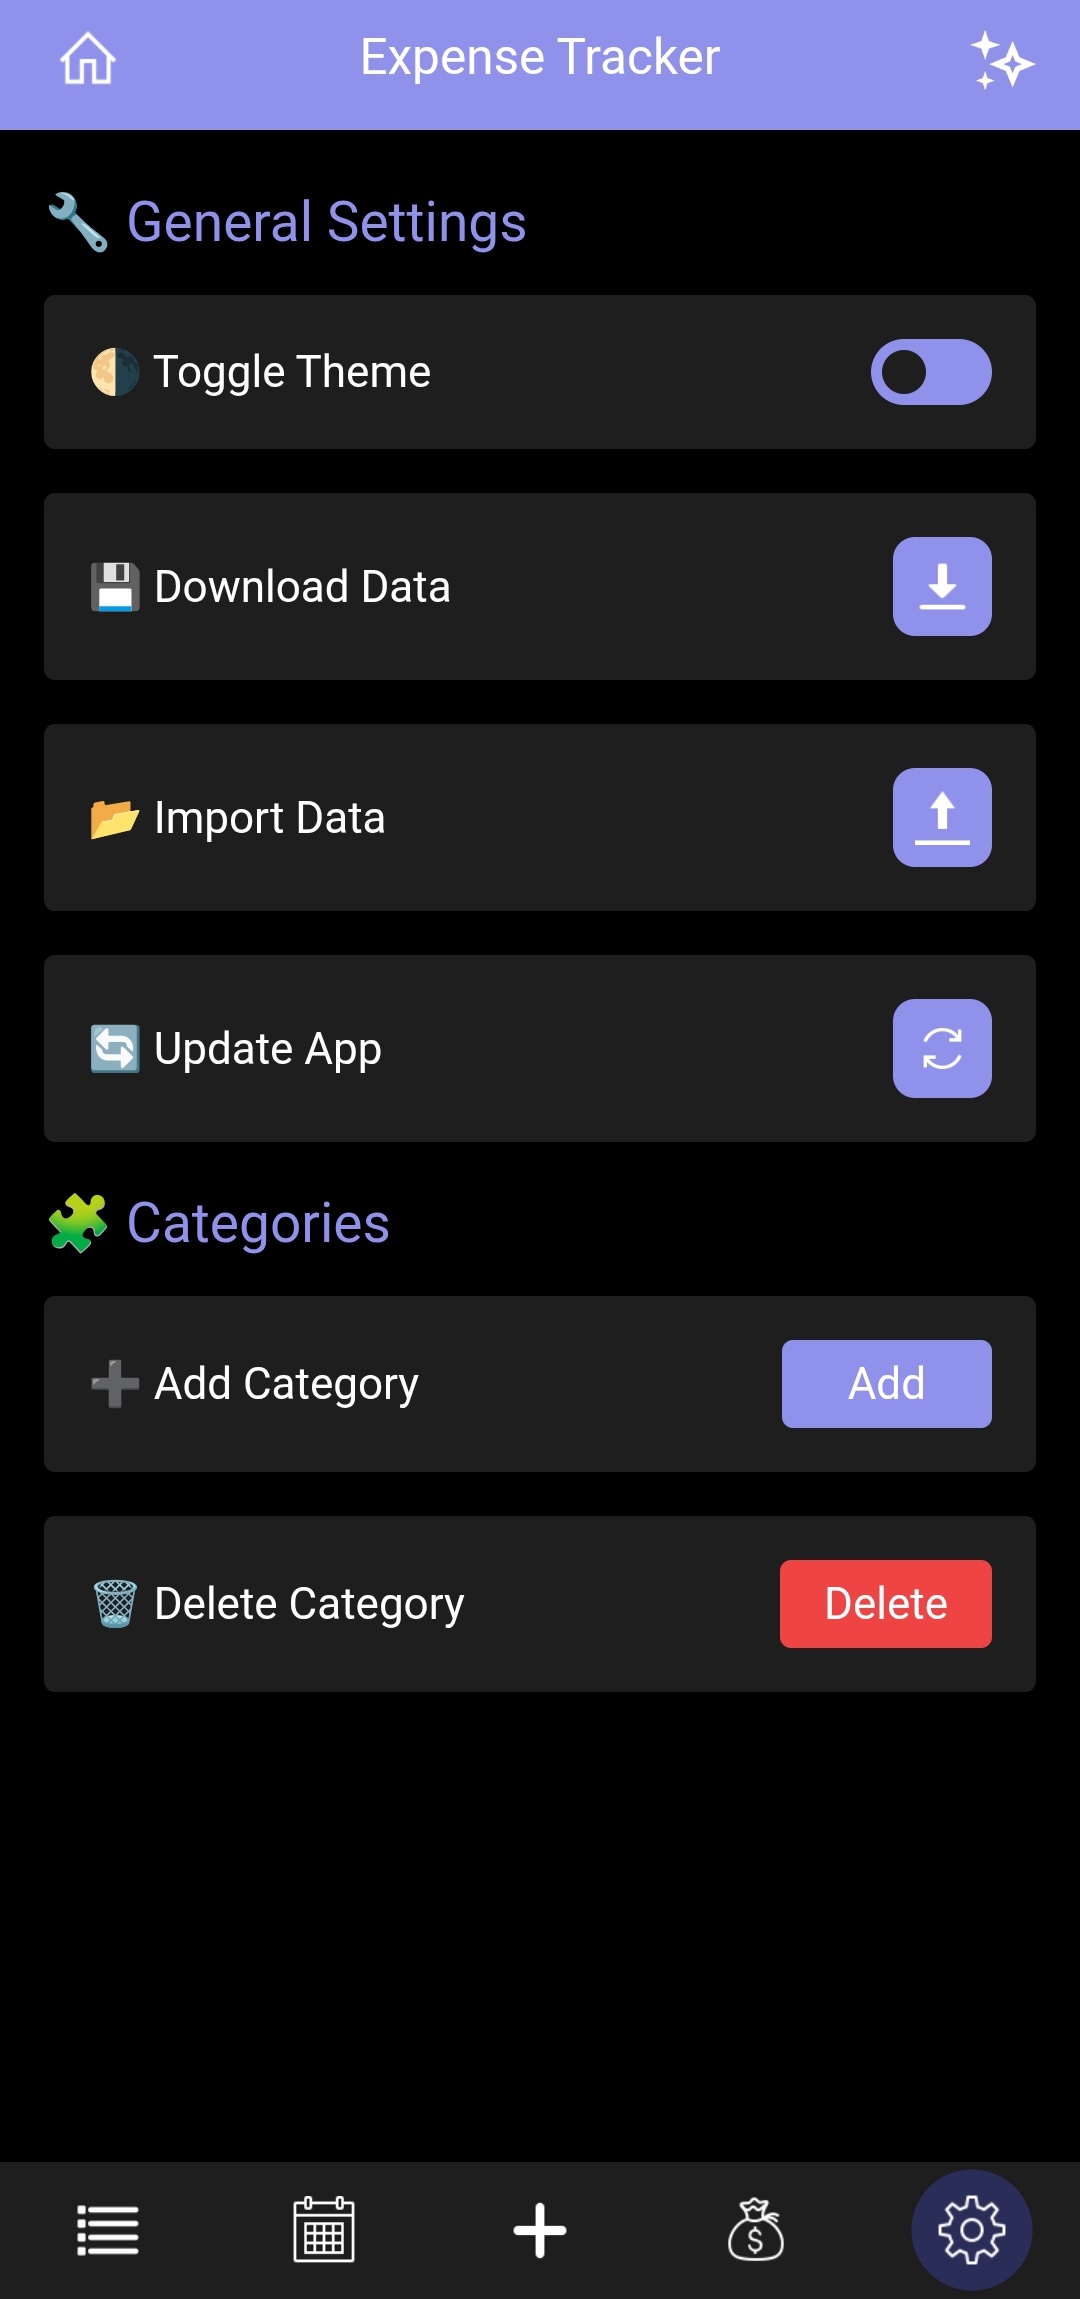
### 6. **Settings View**
Provides customization and utility options for better personalization:
* 🎨 **Theme Mode Toggle** — Switch between **Dark** and **Light** modes
* ⬇️ **Download Data** — Export expenses in **PDF**, **JSON**, or **Excel** formats within a selected date range. Users can also choose **All Data** to export every expense record
* 📤 **Import Data** — Upload and import expense data into the application
* 🔄 **Update App** — Update the application to the latest available version
* ☁️ **Data Backup** — Enable automatic or manual data backup for data safety. When enabled, a backend API runs automatically in the background to upload your data to the database.
* ❓ **[Help & Support](https://devnamdev2003.github.io/angular-expense-tracker/public/help.html)** — Redirects to the external help center for FAQs, guides, and customer support
* ➕ **Add Category** — Create custom categories for better expense organization
* ✏️ **Edit Category** — Update or rename existing categories
* ❌ **Delete Category** — Remove unused or incorrect categories
---
## ☁️ 7. Cloud Backup View
The **Cloud Backup** page provides secure cloud synchronization and backup management for your financial data.
This page can be accessed from **Settings → Cloud Backup** and helps users protect their data against device loss, app reinstall, or accidental deletion.
### 🔐 Key Features
#### ✅ Auto Backup
* Enables **automatic periodic backup** of user data to the cloud.
* Once enabled, the app automatically uploads updated data in the background.
* Users can toggle this option anytime.
#### ☁️ Cloud Synchronization
* Allows users to **manually sync current local data to the cloud**.
* Useful when:
* You want an instant backup.
* You updated important data recently.
* Includes a loading indicator during sync.
#### 🔑 Get Backup Key
* Retrieves a **secure cloud backup key** linked to the user’s stored data.
* This key is required to restore data later.
* Users can:
* View the key securely in a modal.
* Copy it to clipboard for safekeeping.
> ⚠️ Important: Keep this key safe. Without it, data restoration may not be possible.
#### 🔄 Restore From Backup Key
* Allows users to **restore data from the cloud** using their backup key.
* Process includes:
* Entering the backup key.
* Confirming restoration.
* Automatic replacement of current local data with cloud data.
* Includes:
* Data validation before restore.
* Automatic rollback if restoration fails.
---
### 🔒 Data Safety Measures
* Backup key–based authentication ensures secure data access.
* Local data is backed up before restore to prevent accidental loss.
* Invalid or corrupted backup data is rejected automatically.
---
### 📌 Typical Usage Flow
1. Enable **Auto Backup** for continuous protection.
2. Use **Sync to Cloud** before switching devices.
3. Save your **Backup Key** securely.
4. Use **Restore from Backup Key** when reinstalling or changing devices.
## 📱 Mobile-First Design
* The application is specifically designed for **mobile devices**.
* Features responsive components, intuitive touch controls, and visually appealing UI optimized for small screens.
* Not intended for laptop or desktop usage (though it works as PWA).
---
## 🗃️ Data Storage
All user data is stored using the **browser’s LocalStorage API**, ensuring:
* ✅ No need for a backend or server
* ⚡ Fast read/write operations
* 🔒 Data stays on the user's device for privacy and control
---
## 📈 User Flow Summary
1. **Launch App** → View Expense Graphs (Toggle between Month/Day).
2. **Add Expenses** via the ➕ tab.
3. Navigate to:
* **Calendar** to view per-date expenses.
* **List** for detailed log with **search, filter, and sort** options.
* **Budget** to monitor spending.
* **Settings** for customization.
---
## 📄 Code Documentation
For developers and contributors, detailed code-level documentation is available here:
👉 [Documentation](https://devnamdev2003.github.io/angular-expense-tracker/documentation/)
---
## 🖼️ Screenshots