https://github.com/dhi/modelskill
Compare results from MIKE and other simulations with measurements
https://github.com/dhi/modelskill
comparer measurements mike model observations python skill validation
Last synced: 6 months ago
JSON representation
Compare results from MIKE and other simulations with measurements
- Host: GitHub
- URL: https://github.com/dhi/modelskill
- Owner: DHI
- License: mit
- Created: 2021-01-29T09:24:00.000Z (over 4 years ago)
- Default Branch: main
- Last Pushed: 2024-11-23T15:12:39.000Z (11 months ago)
- Last Synced: 2024-11-28T13:37:59.082Z (10 months ago)
- Topics: comparer, measurements, mike, model, observations, python, skill, validation
- Language: Python
- Homepage: https://dhi.github.io/modelskill
- Size: 138 MB
- Stars: 33
- Watchers: 6
- Forks: 8
- Open Issues: 33
-
Metadata Files:
- Readme: README.md
- Contributing: CONTRIBUTING.md
- License: LICENSE
Awesome Lists containing this project
README

# ModelSkill: Flexible Model skill evaluation.

 [](https://badge.fury.io/py/modelskill)

[ModelSkill](https://github.com/DHI/modelskill) is a python package for scoring [MIKE](https://www.mikepoweredbydhi.com) models (other models can be evaluated as well).
Contribute with new ideas in the [discussion](https://github.com/DHI/modelskill/discussions), report an [issue](https://github.com/DHI/modelskill/issues) or browse the [documentation](https://dhi.github.io/modelskill/). Access observational data (e.g. altimetry data) from the sister library [WatObs](https://github.com/DHI/watobs).
## Use cases
[ModelSkill](https://github.com/DHI/modelskill) would like to be your companion during the different phases of a MIKE modelling workflow.
* Model setup - exploratory phase
* Model calibration
* Model validation and reporting - communicate your final results
## Installation
From [pypi](https://pypi.org/project/modelskill/):
`> pip install modelskill`
Or the development version:
`> pip install https://github.com/DHI/modelskill/archive/main.zip`
## Example notebooks
* [Hydrology_Vistula_Catchment.ipynb](https://nbviewer.jupyter.org/github/DHI/modelskill/blob/main/notebooks/Hydrology_Vistula_Catchment.ipynb)
* [Metocean_multi_model_comparison.ipynb](https://nbviewer.jupyter.org/github/DHI/modelskill/blob/main/notebooks/Metocean_multi_model_comparison.ipynb)
* [Multi_variable_comparison.ipynb](https://nbviewer.jupyter.org/github/DHI/modelskill/blob/main/notebooks/Multi_variable_comparison.ipynb)
* [Metocean_track_comparison_global.ipynb](https://nbviewer.jupyter.org/github/DHI/modelskill/blob/main/notebooks/Metocean_track_comparison_global.ipynb)
* [Gridded_NetCDF_ModelResult.ipynb](https://nbviewer.jupyter.org/github/DHI/modelskill/blob/main/notebooks/Gridded_NetCDF_ModelResult.ipynb)
* [Directional_data_comparison.ipynb](https://nbviewer.jupyter.org/github/DHI/modelskill/blob/main/notebooks/Directional_data_comparison.ipynb)
* [Combine_comparers.ipynb](https://nbviewer.jupyter.org/github/DHI/modelskill/blob/main/notebooks/Combine_comparers.ipynb)
## Workflow
1. Define **ModelResults**
2. Define **Observations**
3. **Match** Observations and ModelResults
4. Do plotting, statistics, reporting using the **Comparer**
Read more about the workflow in the [getting started guide](https://dhi.github.io/modelskill/user-guide/getting-started.html).
## Example of use
Start by defining model results and observations:
```python
>>> import modelskill as ms
>>> mr = ms.DfsuModelResult("HKZN_local_2017_DutchCoast.dfsu", name="HKZN_local", item=0)
>>> HKNA = ms.PointObservation("HKNA_Hm0.dfs0", item=0, x=4.2420, y=52.6887, name="HKNA")
>>> EPL = ms.PointObservation("eur_Hm0.dfs0", item=0, x=3.2760, y=51.9990, name="EPL")
>>> c2 = ms.TrackObservation("Alti_c2_Dutch.dfs0", item=3, name="c2")
```
Then, connect observations and model results, and extract data at observation points:
```python
>>> cc = ms.match([HKNA, EPL, c2], mr)
```
With the comparer object, cc, all sorts of skill assessments and plots can be made:
```python
>>> cc.skill().round(2)
n bias rmse urmse mae cc si r2
observation
HKNA 385 -0.20 0.35 0.29 0.25 0.97 0.09 0.99
EPL 66 -0.08 0.22 0.20 0.18 0.97 0.07 0.99
c2 113 -0.00 0.35 0.35 0.29 0.97 0.12 0.99
```
### Overview of observation locations
```python
ms.plotting.spatial_overview([HKNA, EPL, c2], mr, figsize=(7,7))
```

### Scatter plot
```python
cc.plot.scatter()
```

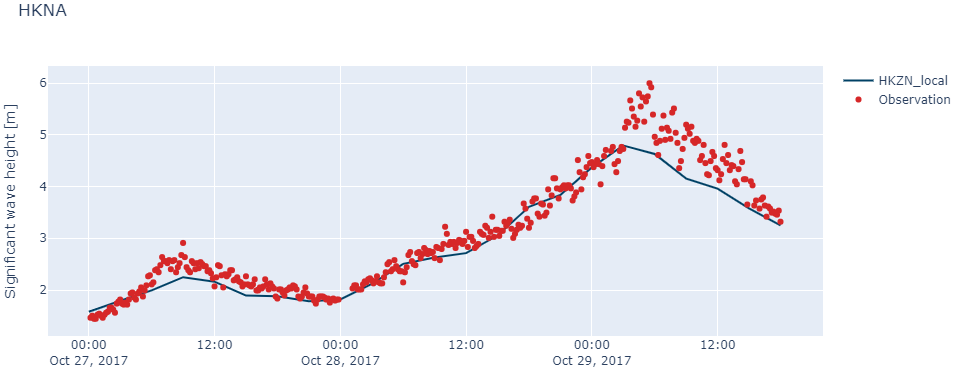
### Timeseries plot
Timeseries plots can either be static and report-friendly ([matplotlib](https://matplotlib.org/)) or interactive with zoom functionality ([plotly](https://plotly.com/python/)).
```python
cc["HKNA"].plot.timeseries(width=1000, backend="plotly")
```
