https://github.com/djay/covidthailand
Thailand Covid testing and case data gathered and combined from various sources for others to download or view
https://github.com/djay/covidthailand
ccsa-daily-briefing confirmed-cases covid-api covid19-data daily-situation-reports hacktoberfest hacktoberfest2021 health-district proactive-tests thailand
Last synced: about 1 year ago
JSON representation
Thailand Covid testing and case data gathered and combined from various sources for others to download or view
- Host: GitHub
- URL: https://github.com/djay/covidthailand
- Owner: djay
- Created: 2021-02-16T07:22:37.000Z (over 5 years ago)
- Default Branch: main
- Last Pushed: 2025-04-14T06:22:06.000Z (over 1 year ago)
- Last Synced: 2025-04-14T07:27:45.597Z (over 1 year ago)
- Topics: ccsa-daily-briefing, confirmed-cases, covid-api, covid19-data, daily-situation-reports, hacktoberfest, hacktoberfest2021, health-district, proactive-tests, thailand
- Language: Python
- Homepage:
- Size: 29.5 MB
- Stars: 126
- Watchers: 5
- Forks: 15
- Open Issues: 34
-
Metadata Files:
- Readme: README.md
Awesome Lists containing this project
- awesome-thai-library - covidthailand - 19 ของประเทศไทยจากหลายแหล่ง (Others)
README
# Thailand COVID-19 Data
*Note* Share via
Thailand COVID-19 case/test/vaccination data gathered and combined from various government sources for others to view or download.
- Updated daily 8-9am summary info, 1-3pm from full briefing. Testing data is updated every 1-3 weeks. [](https://github.com/djay/covidthailand/actions/workflows/main.yml).
## [Cases](#cases) | [Deaths](#deaths) | [Vaccinations](#vaccinations) | [Active Cases](#active-cases) | [Testing](#testing) | [Downloads](downloads.md) | [About](#about)
**NEW** [Excess Deaths](#excess-deaths)
## Disclaimer
*Data offered here is offered as is with no guarantees. As much as possible government reports
and data feeds have been used effort has gone into making this data collection accurate and timely.
This sites only intention is to give an accurate representation of all the available Covid data for Thailand in one place.*
Links to all data sources are including in [Downloads](downloads.md)
# Questions?
Got a question about covid in Thailand? Try asking it in [Q&A discussion](https://github.com/djay/covidthailand/discussions/categories/q-a)
# Weekly data from Oct 1st
From Oct 1st 2022 all covid data from the DDC has been released in weekly chunks. Data here will be
displayed as daily averages and updates will be once per week (mondays?). In addition many of the data
sources have stopped being published so many plots will no longer be change.
# Trends
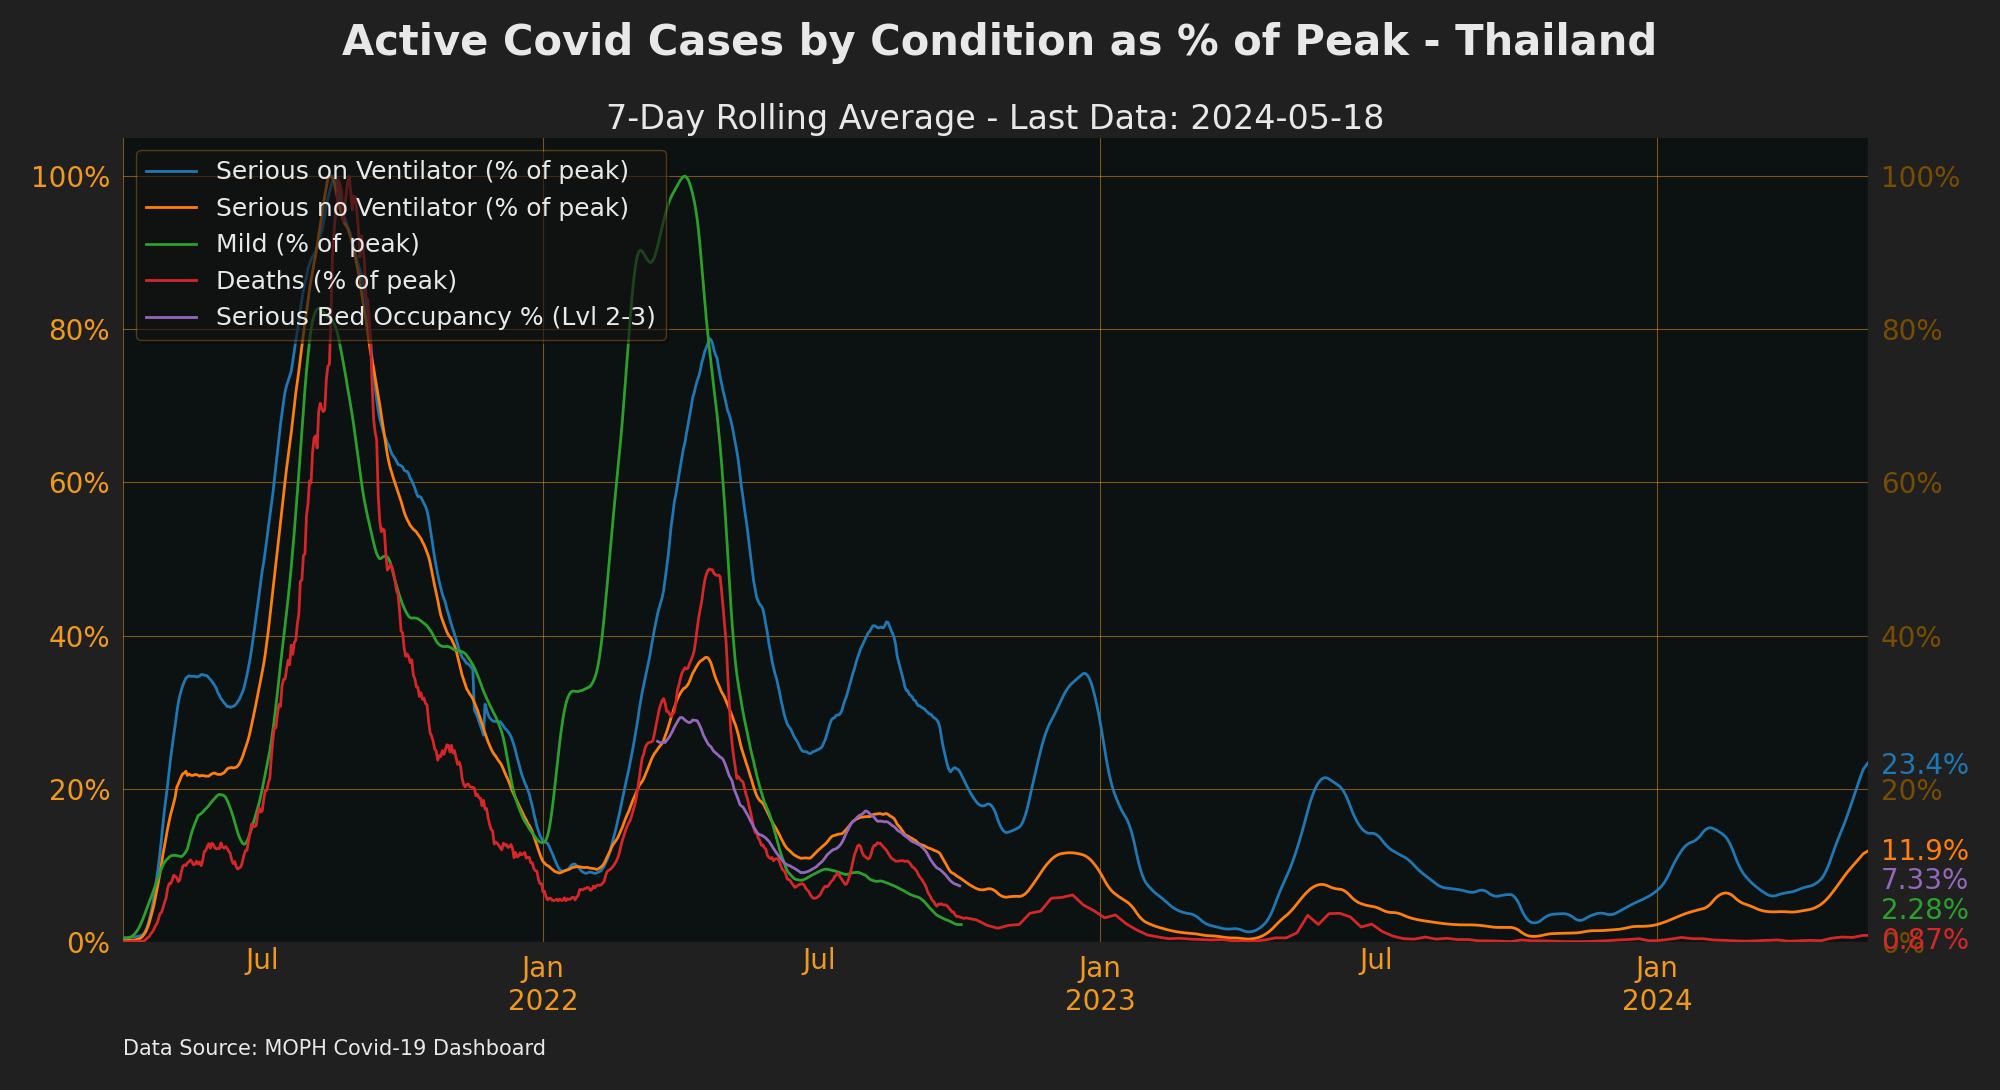
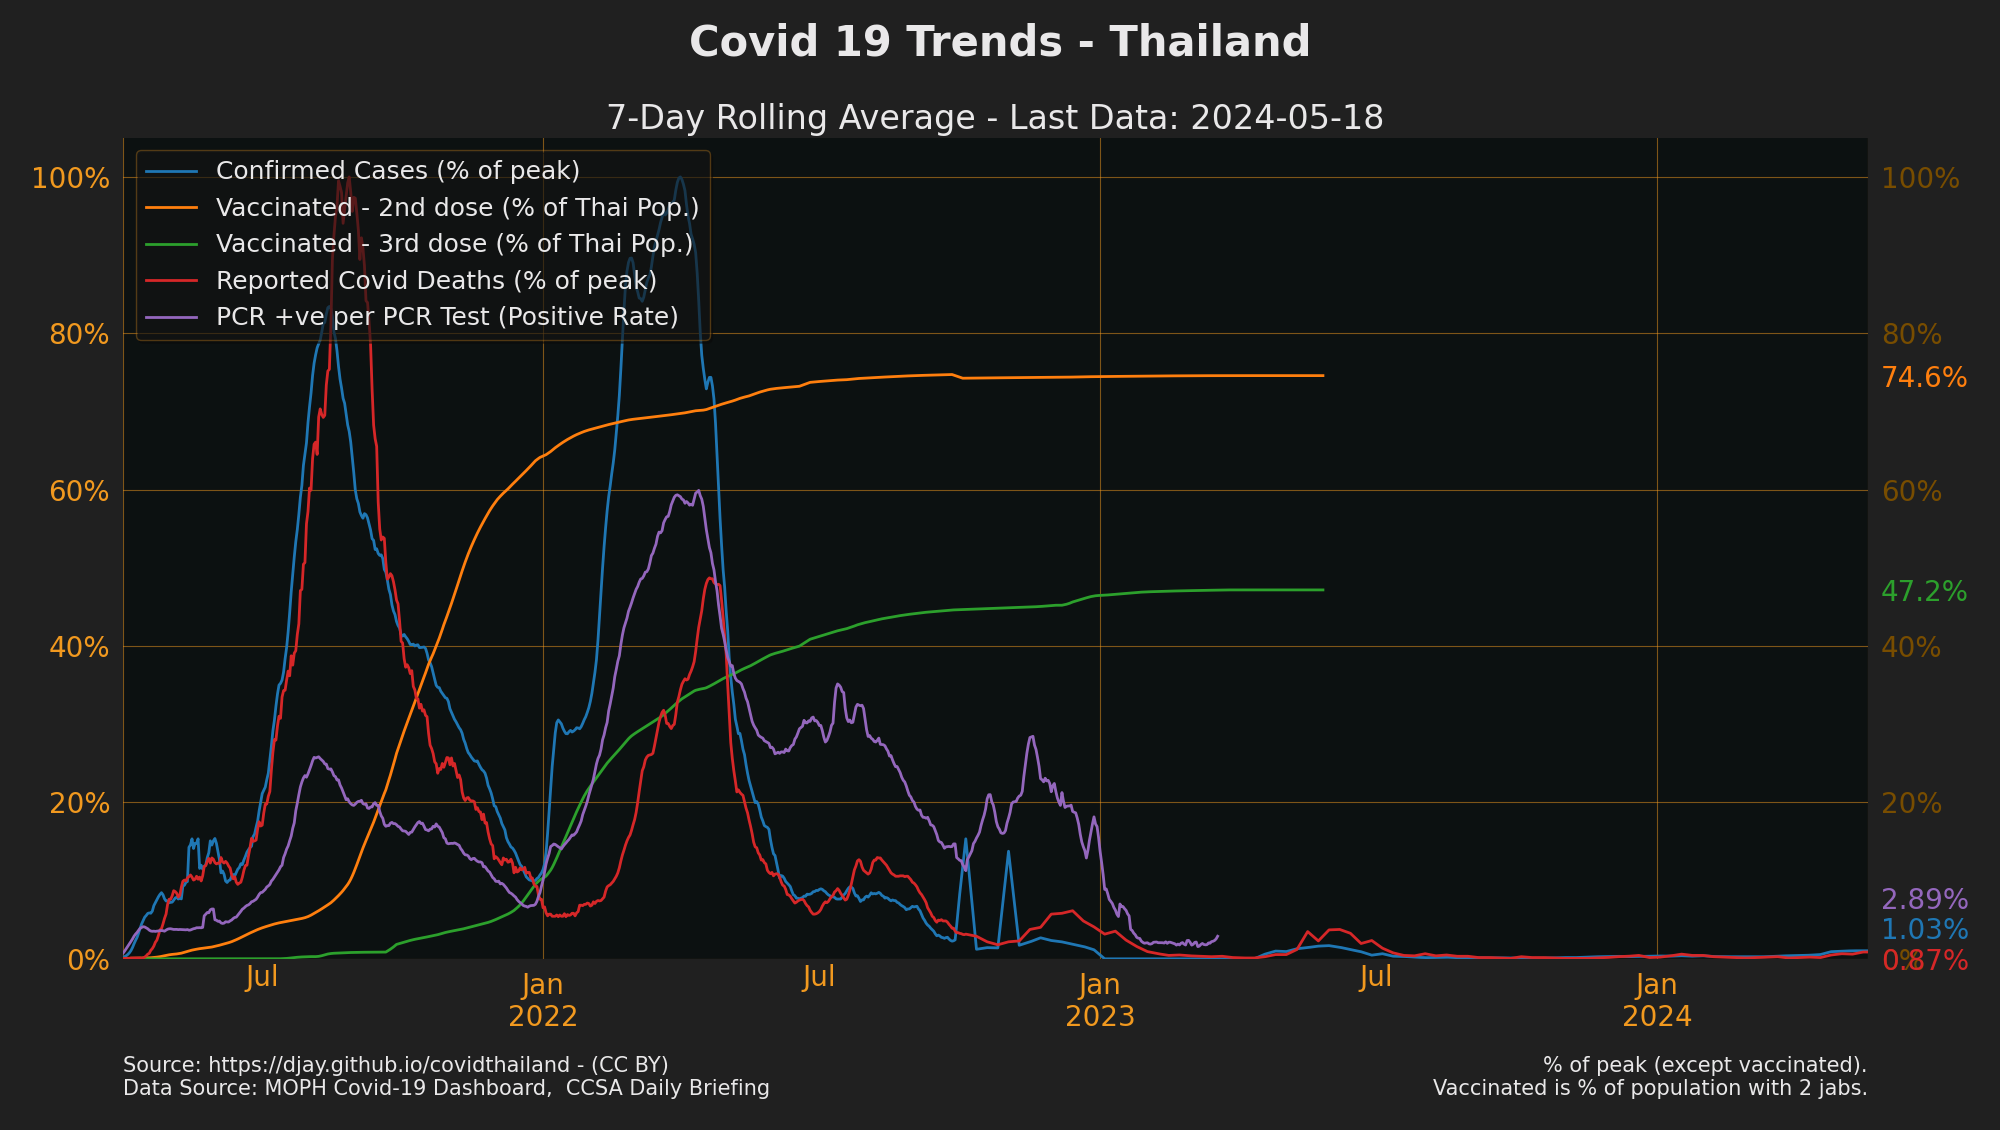
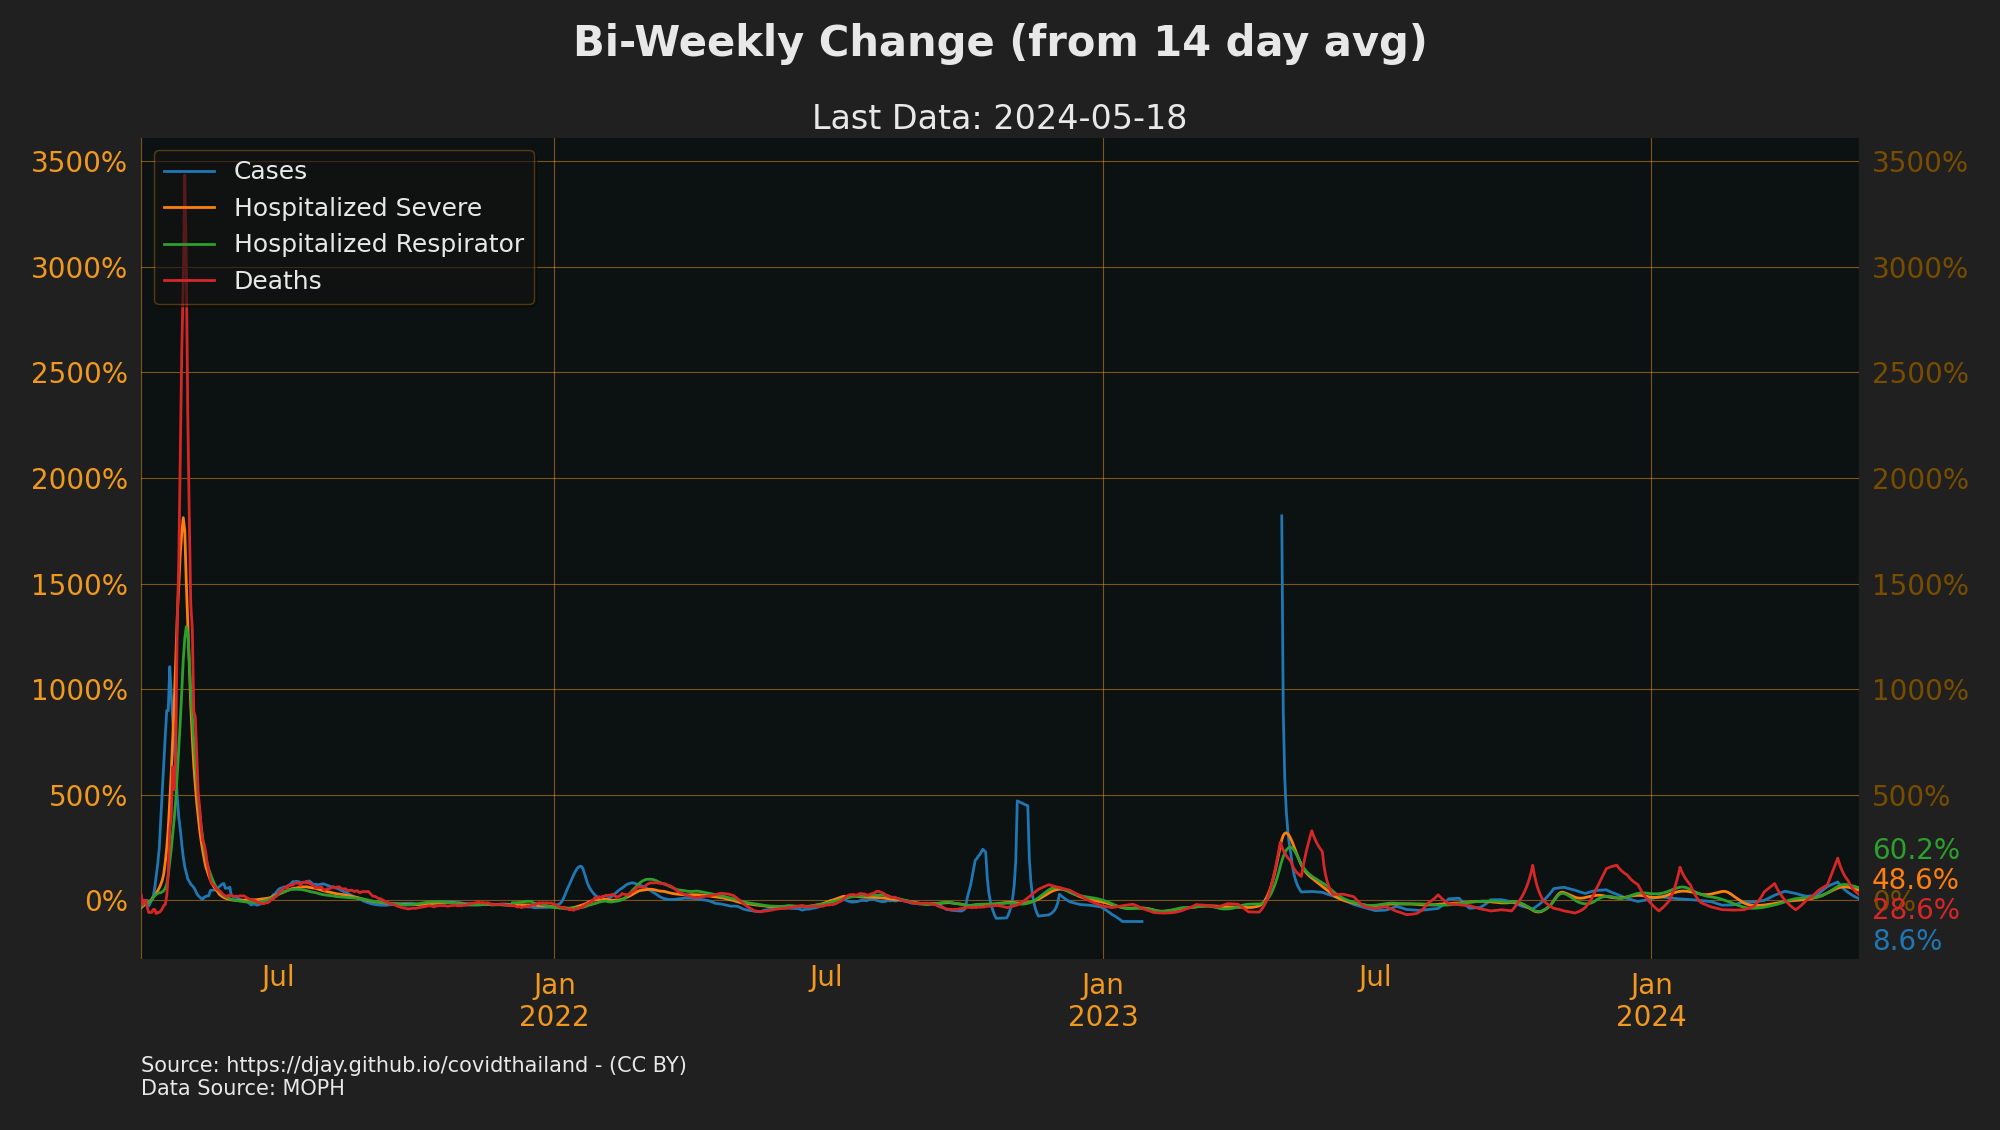
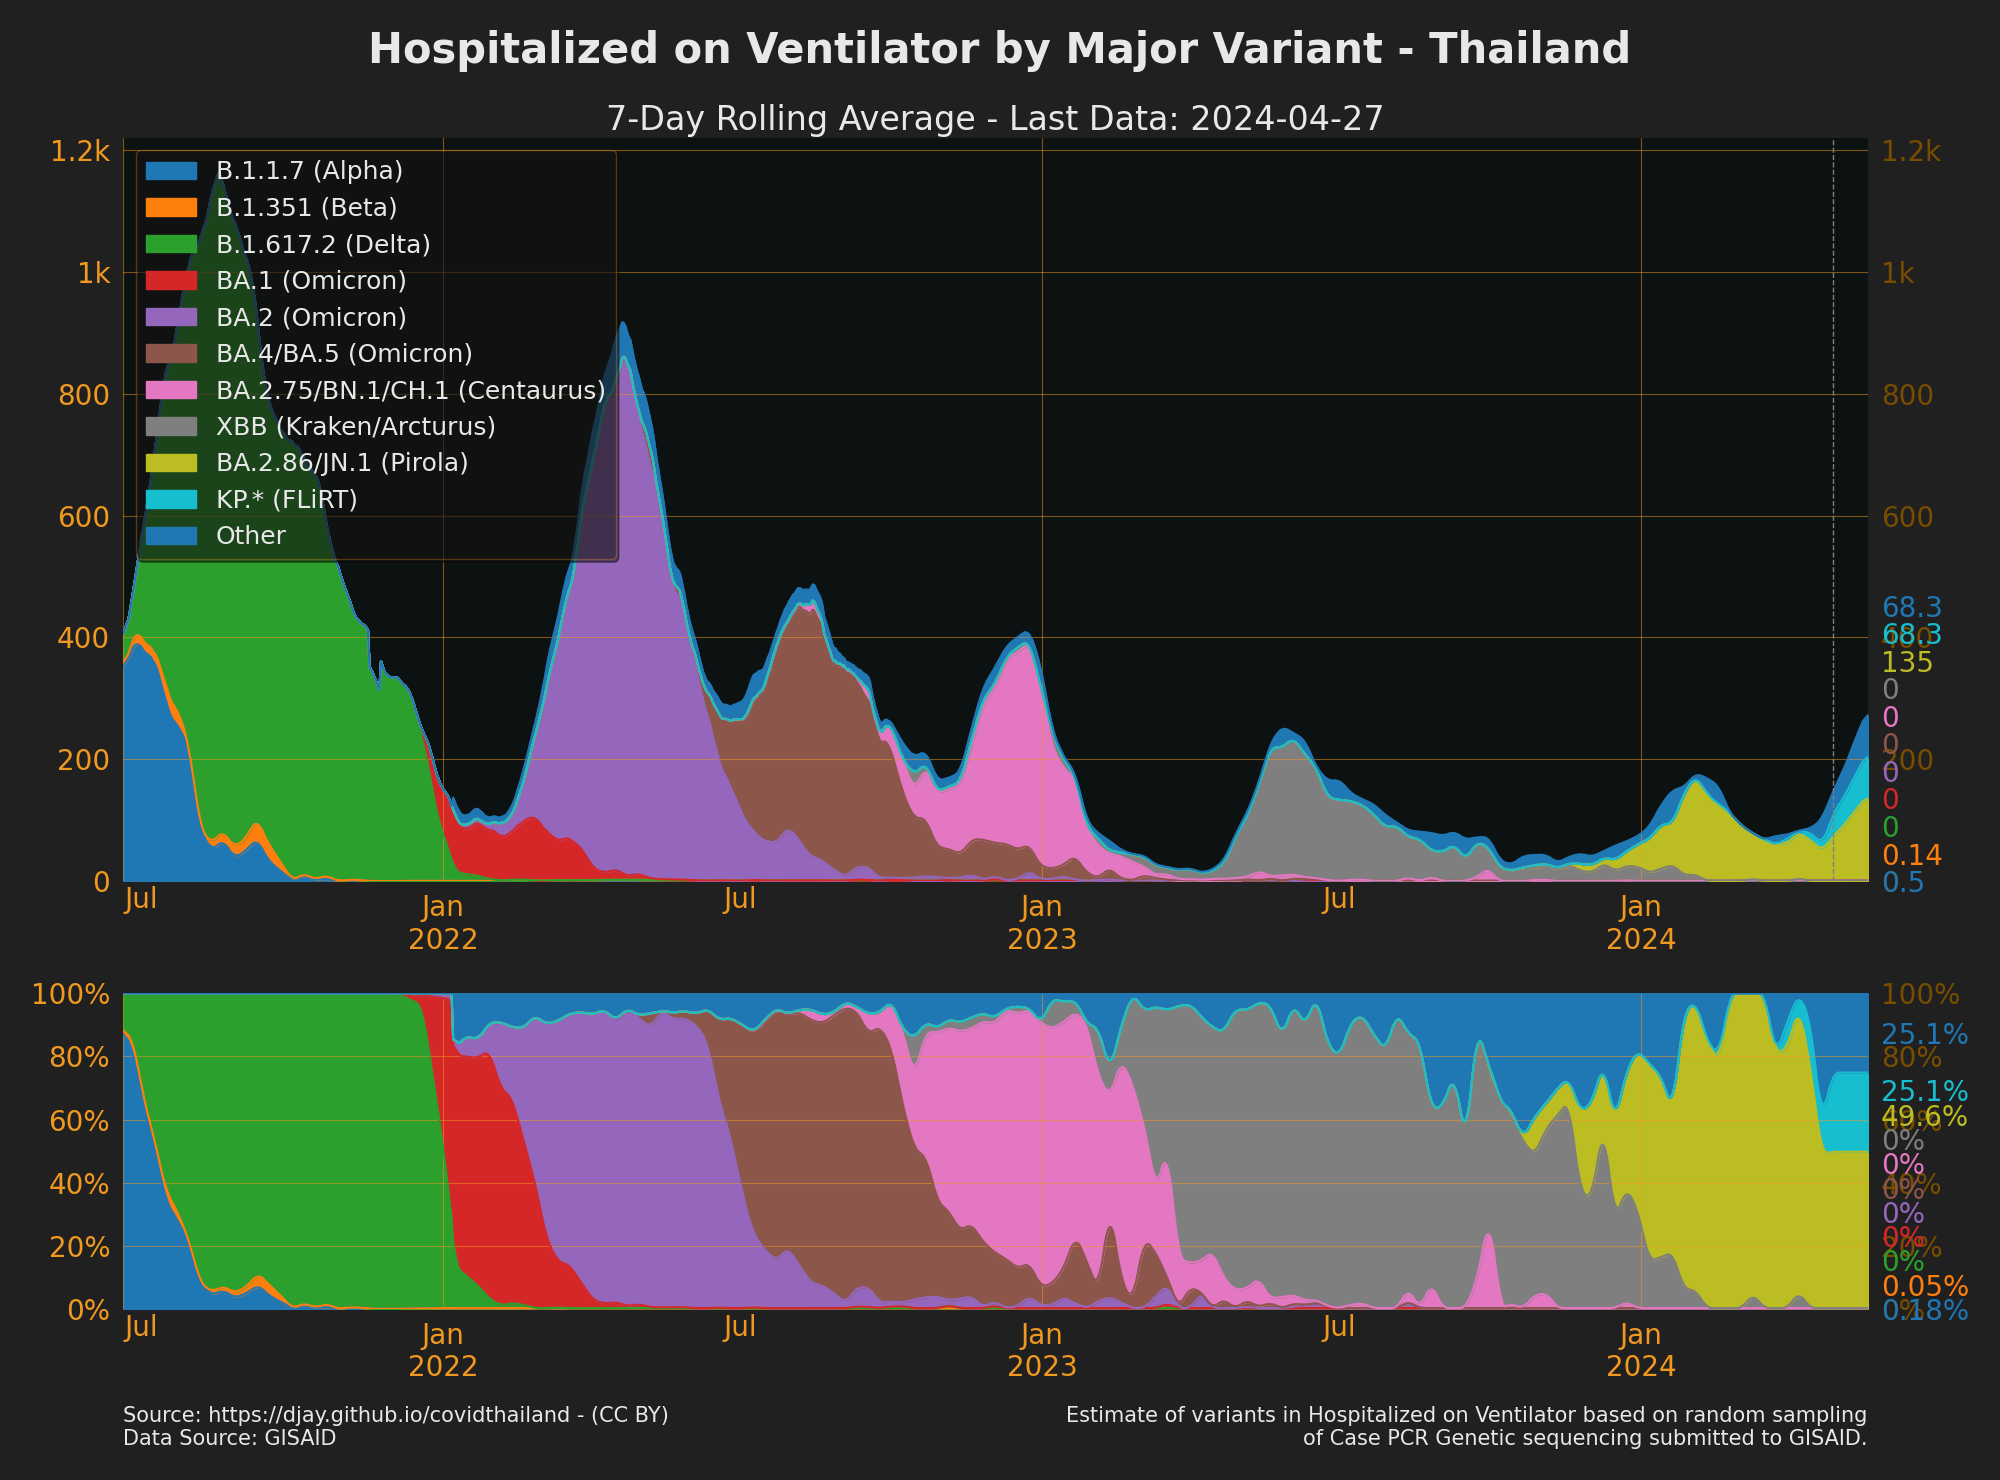
- source: [Outbreak.info](https://outbreak.info/location-reports?loc=THA&dark=true), [DMSc Variant Report](downloads.md#dl-variant)
- Sources: [CCSA Daily Briefing](downloads.md#dl-briefings),
[MOPH daily situation report](downloads.md#dl-situation-reports), [DMSC: Thailand Laboratory testing data](downloads.md#dl-testing)
## Deaths by Major Variant (Extrapolated from Surviellance)
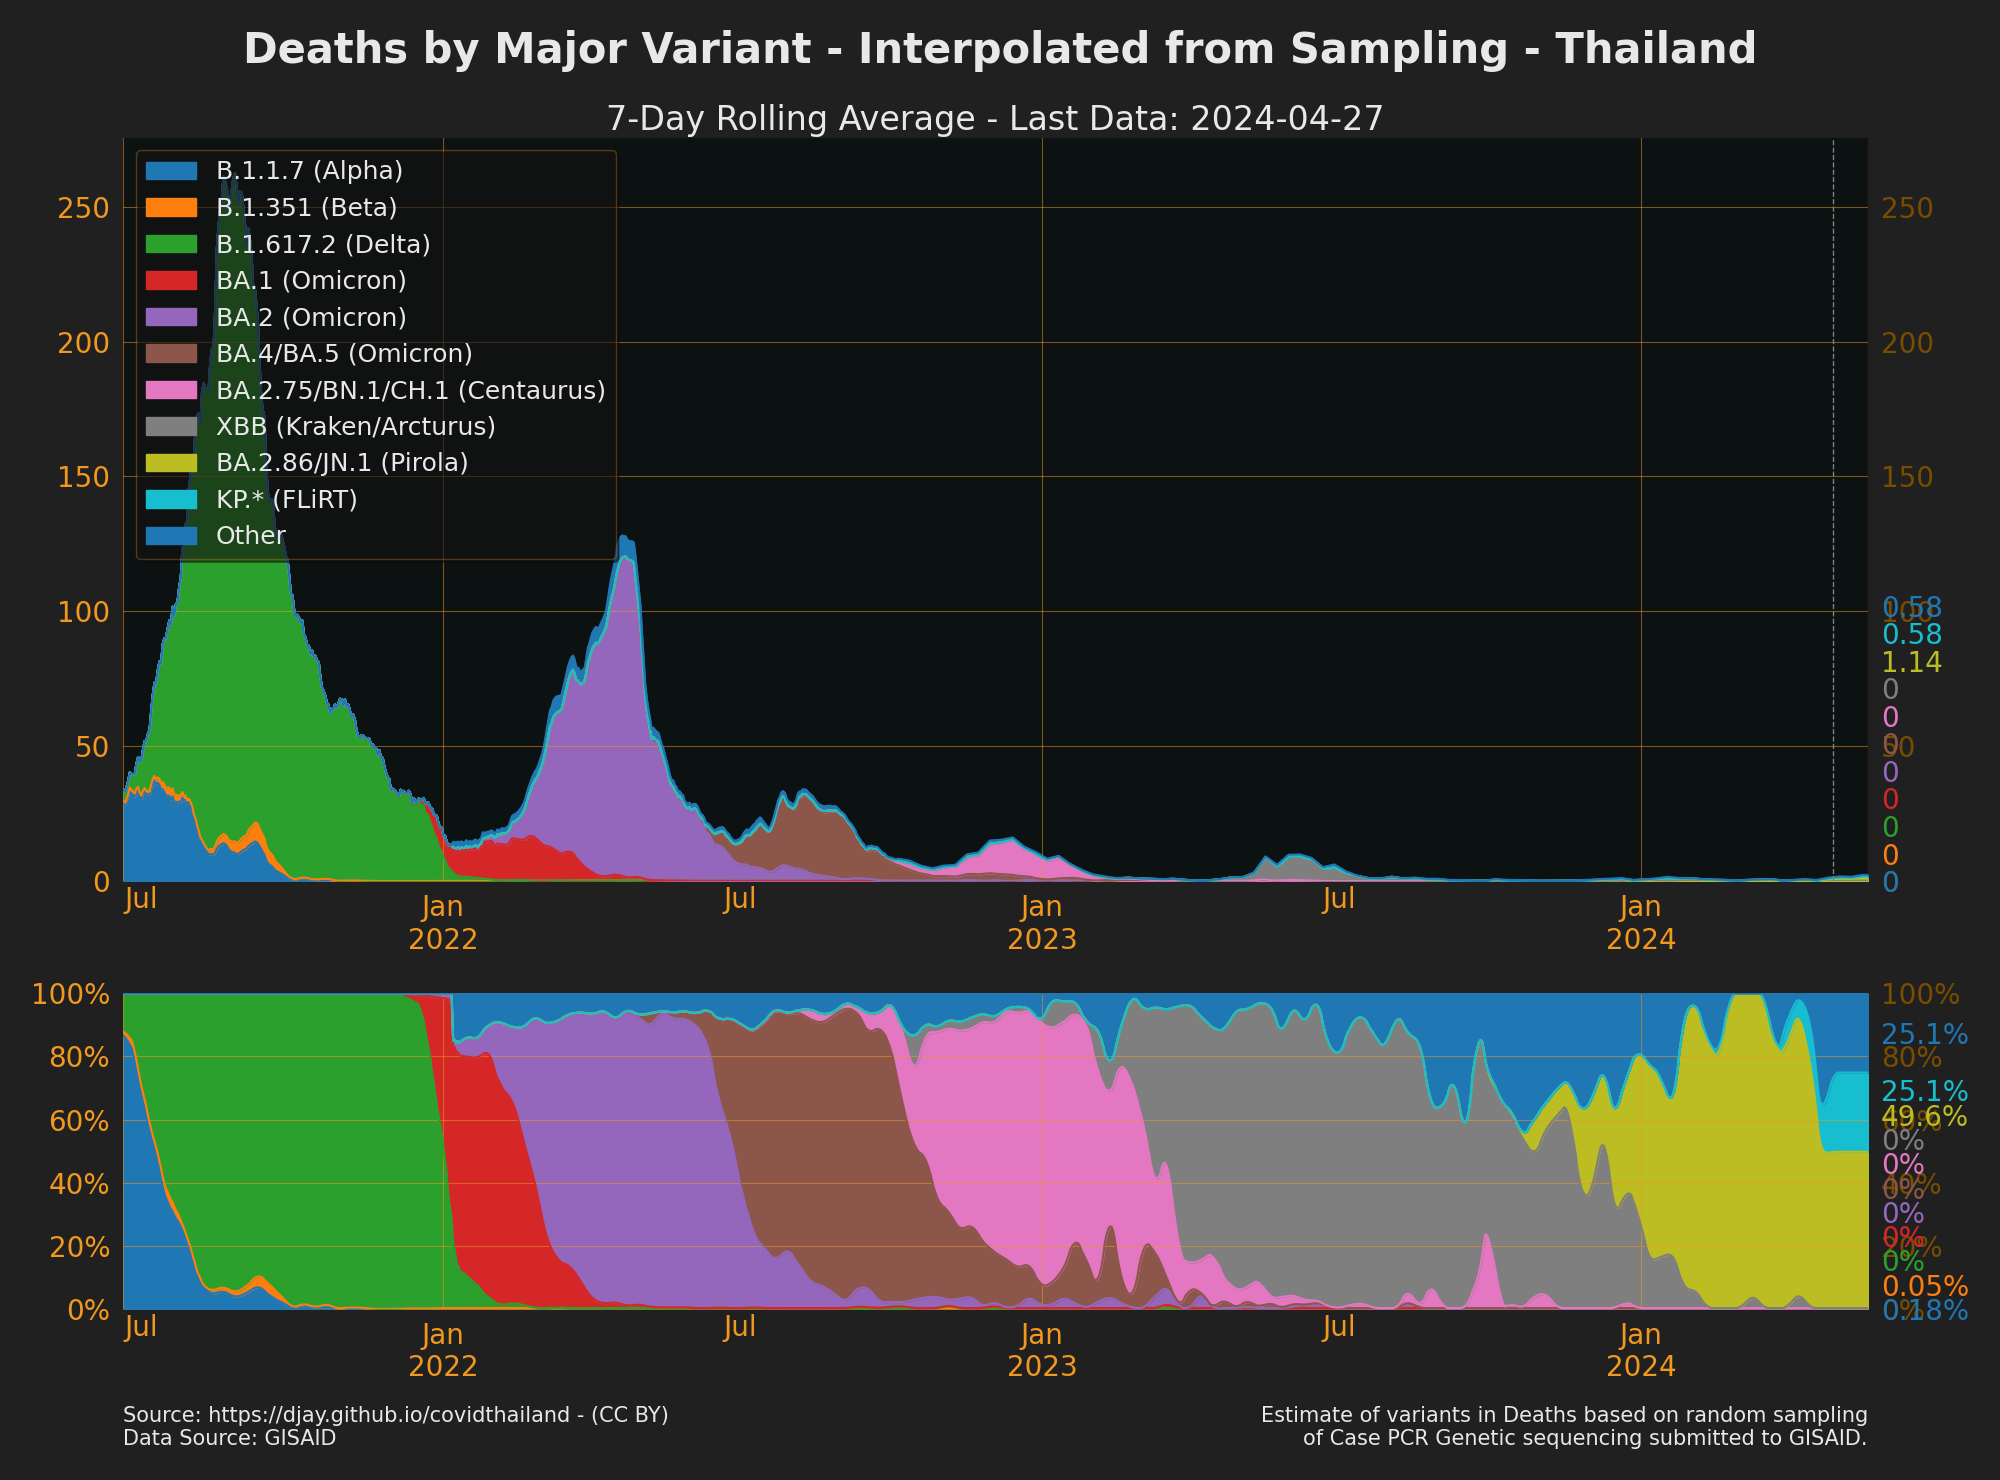
- source: [Outbreak.info](https://outbreak.info/location-reports?loc=THA&dark=true), [DMSc Variant Report](downloads.md#dl-variant)
## COVID-19 Deaths
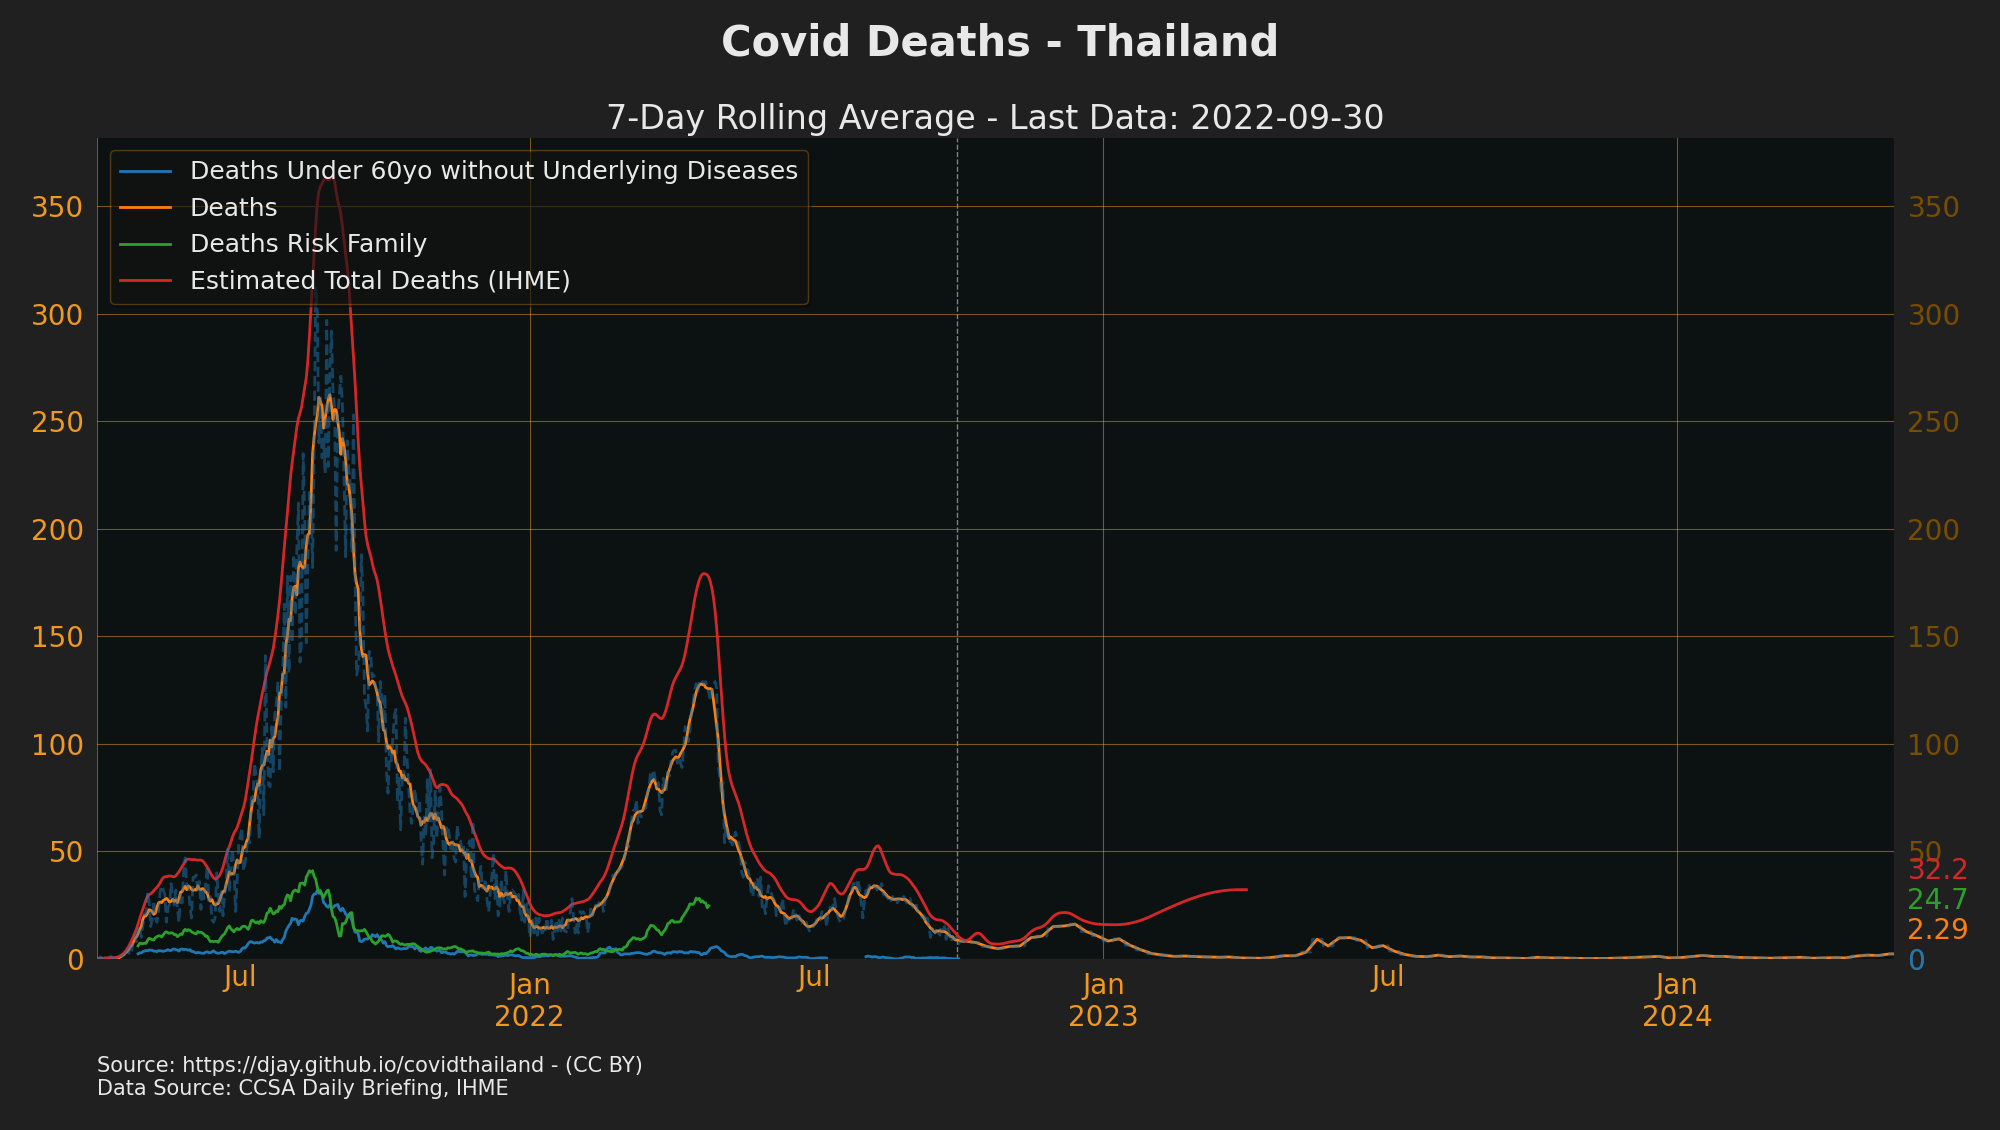
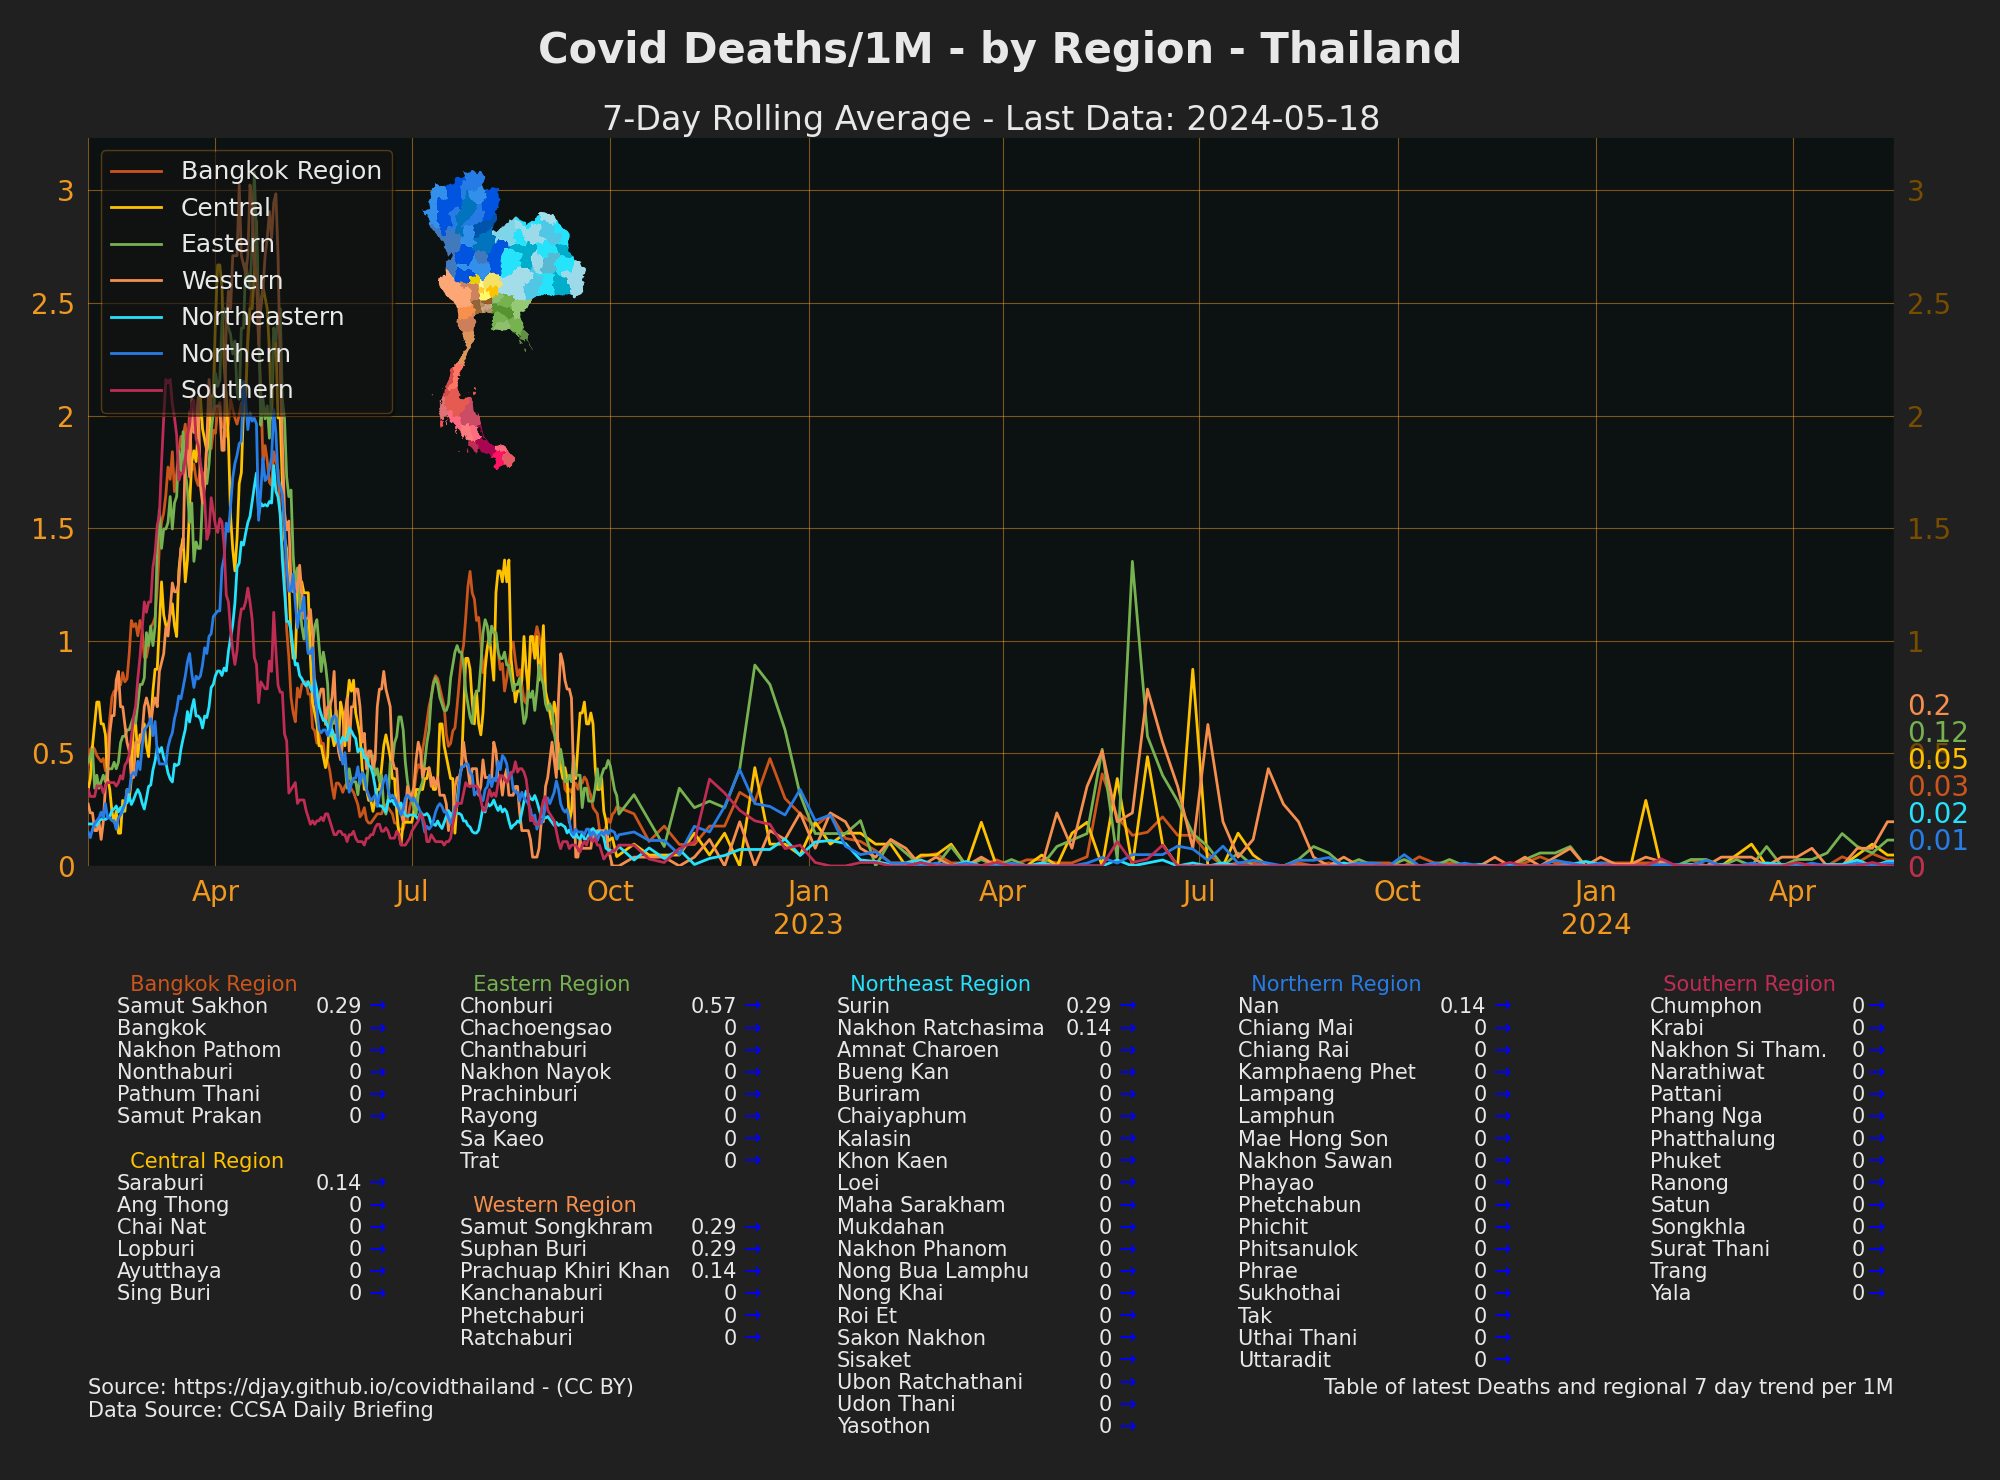
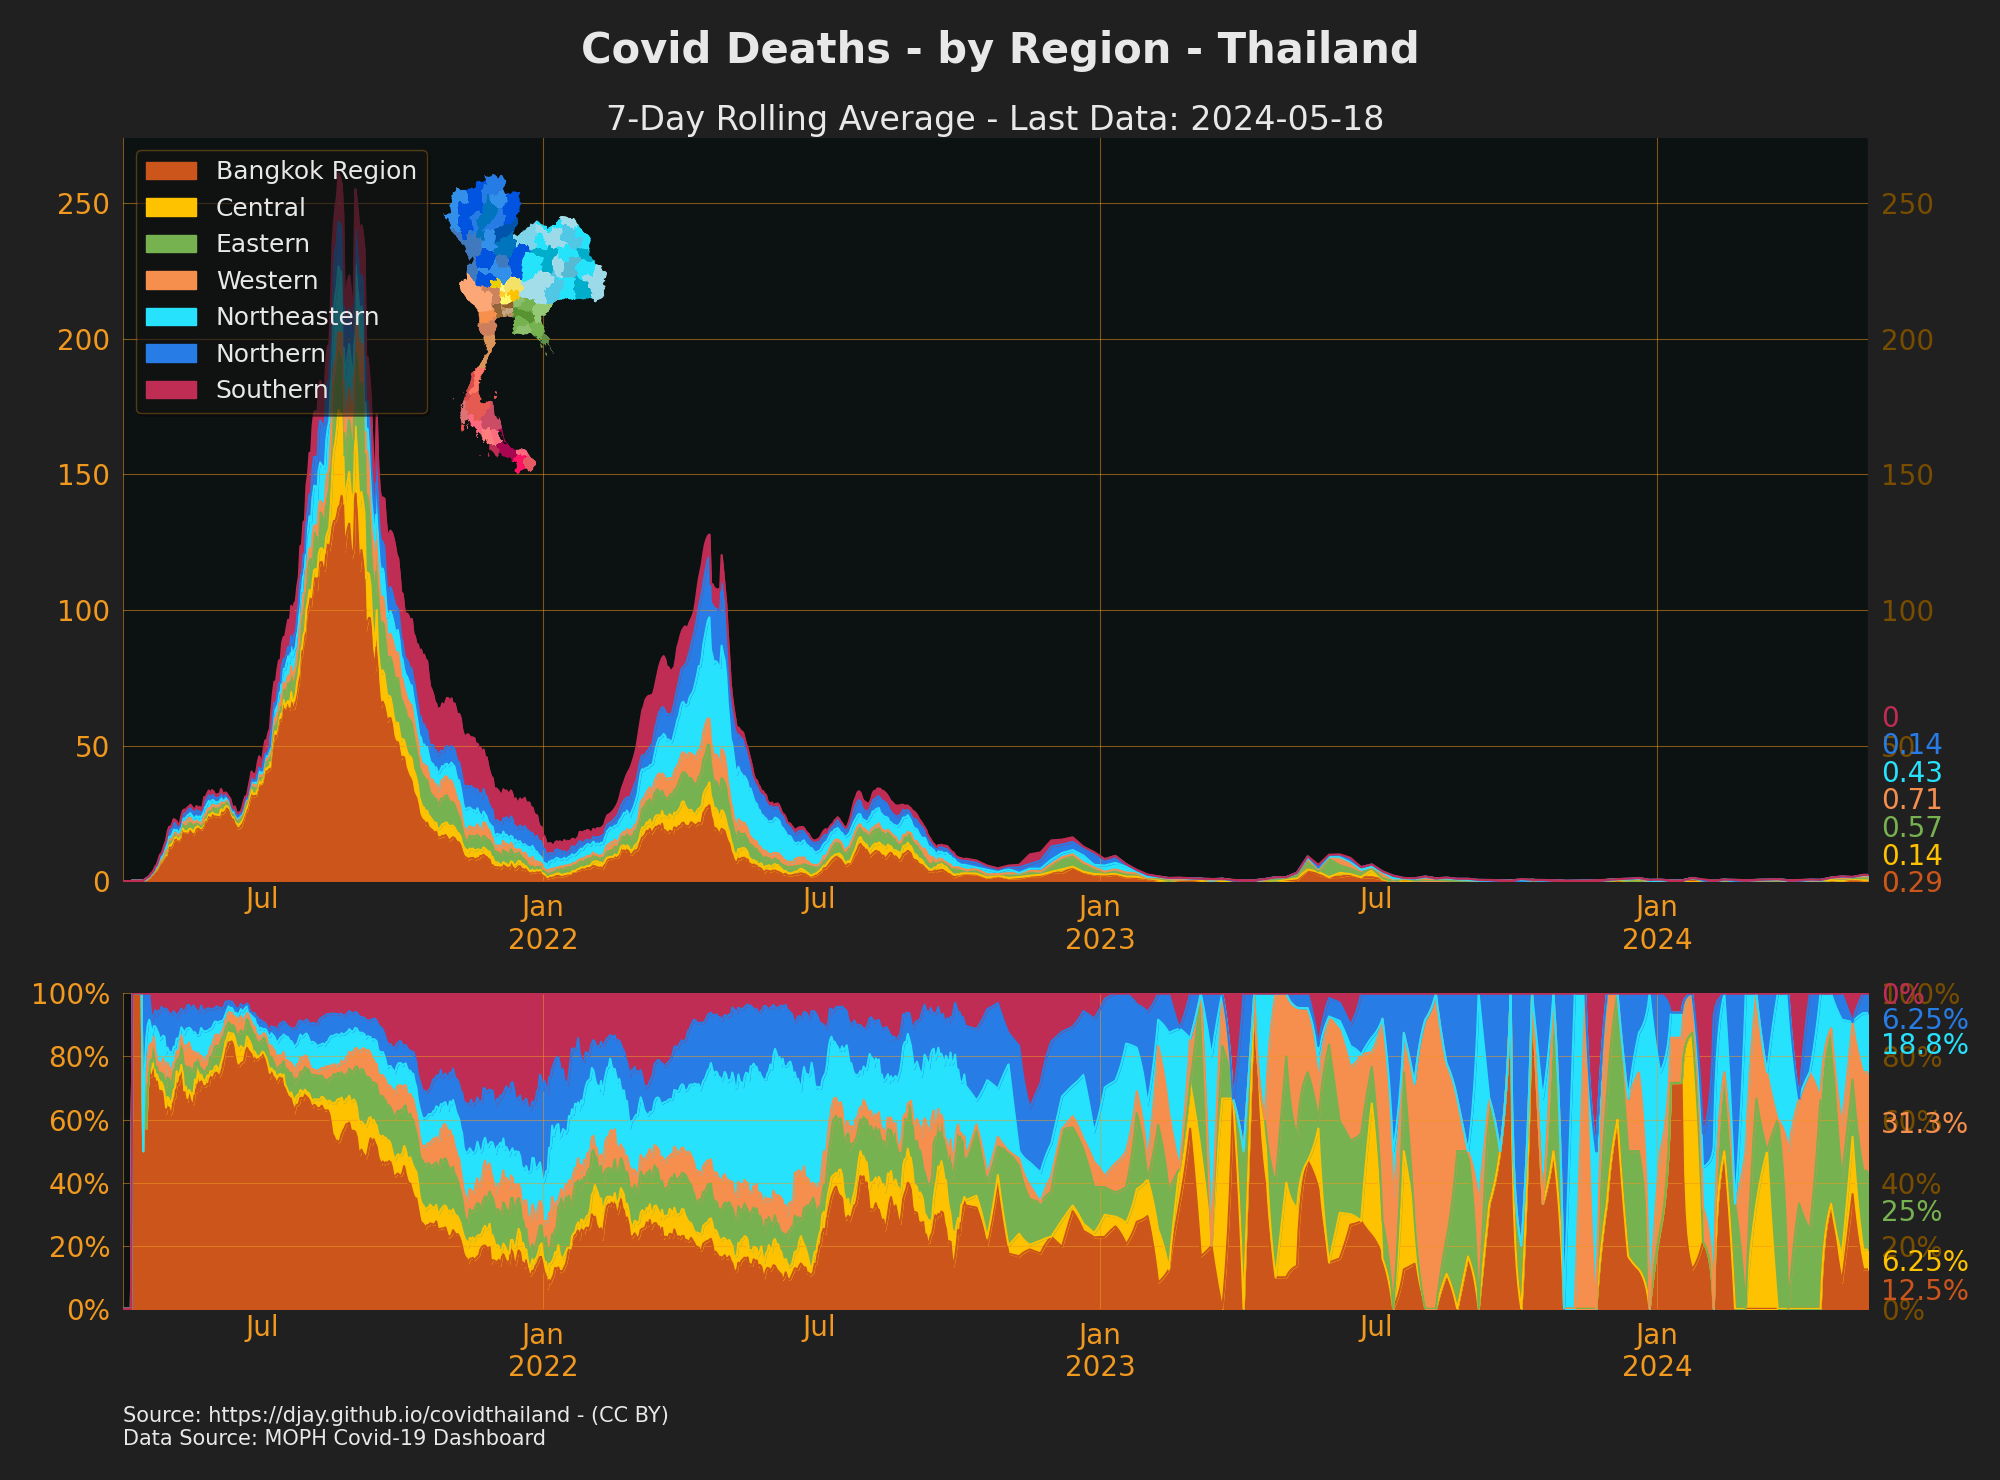
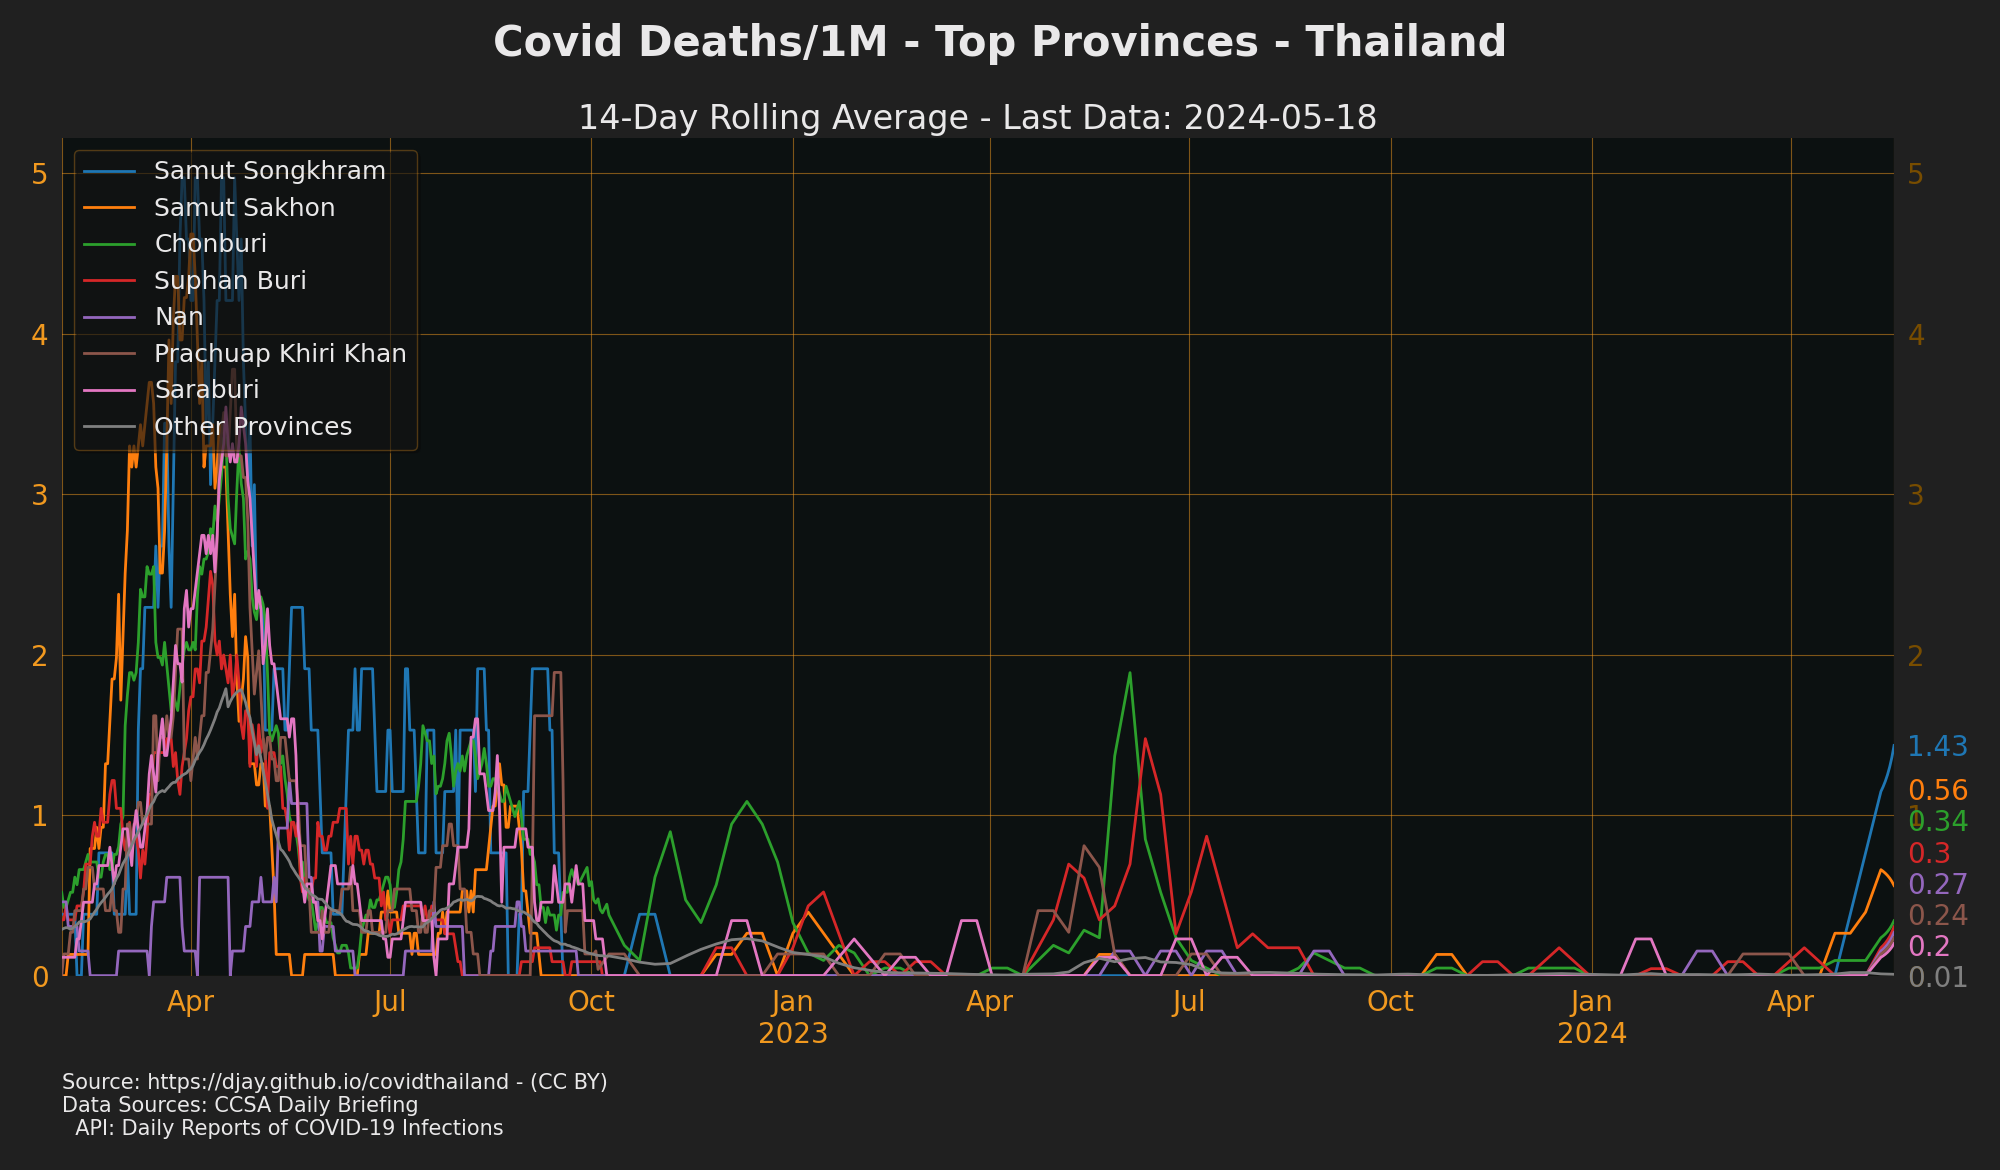
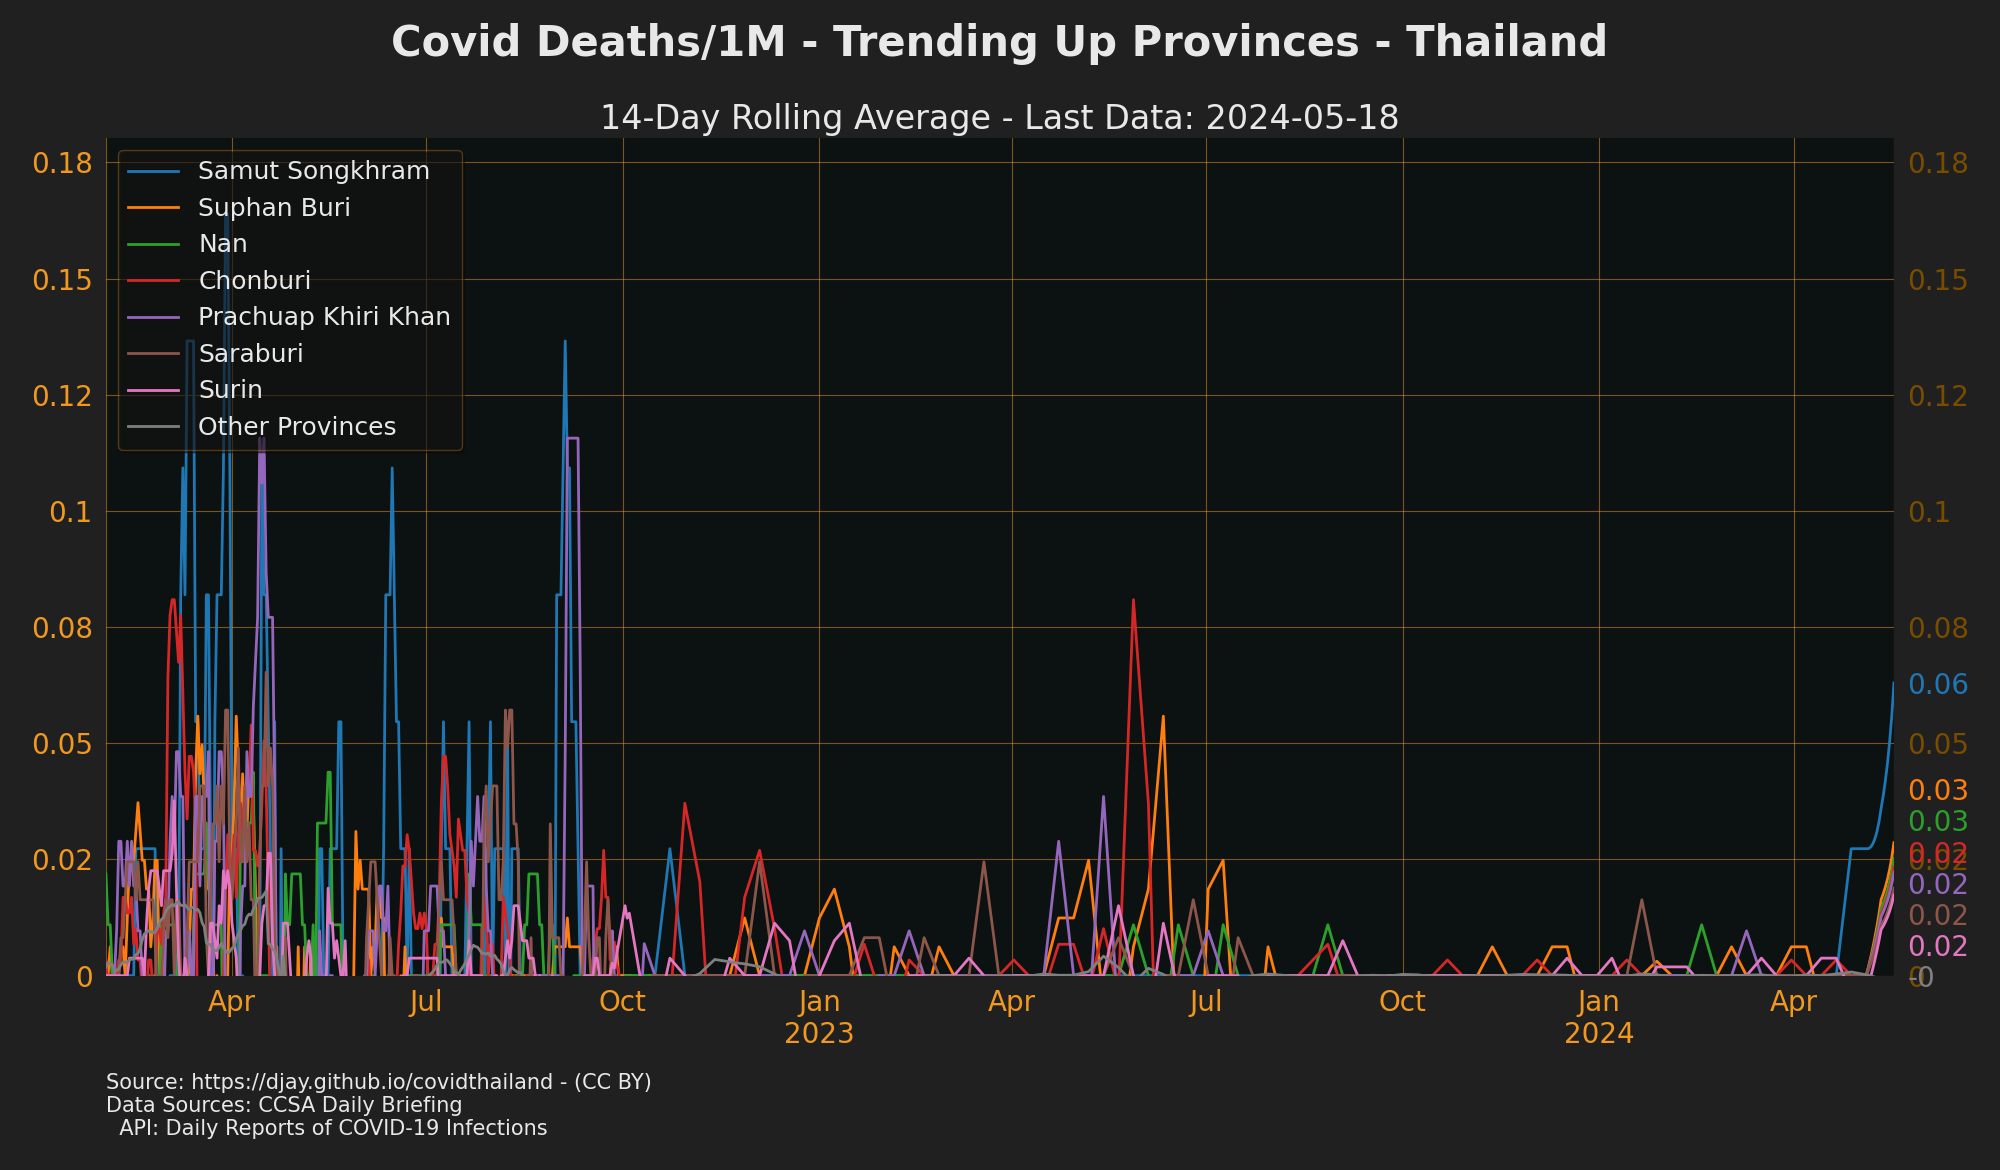
- source: [CCSA Daily Briefing](downloads.md#dl-briefings)
## COVID-19 Deaths Age Range
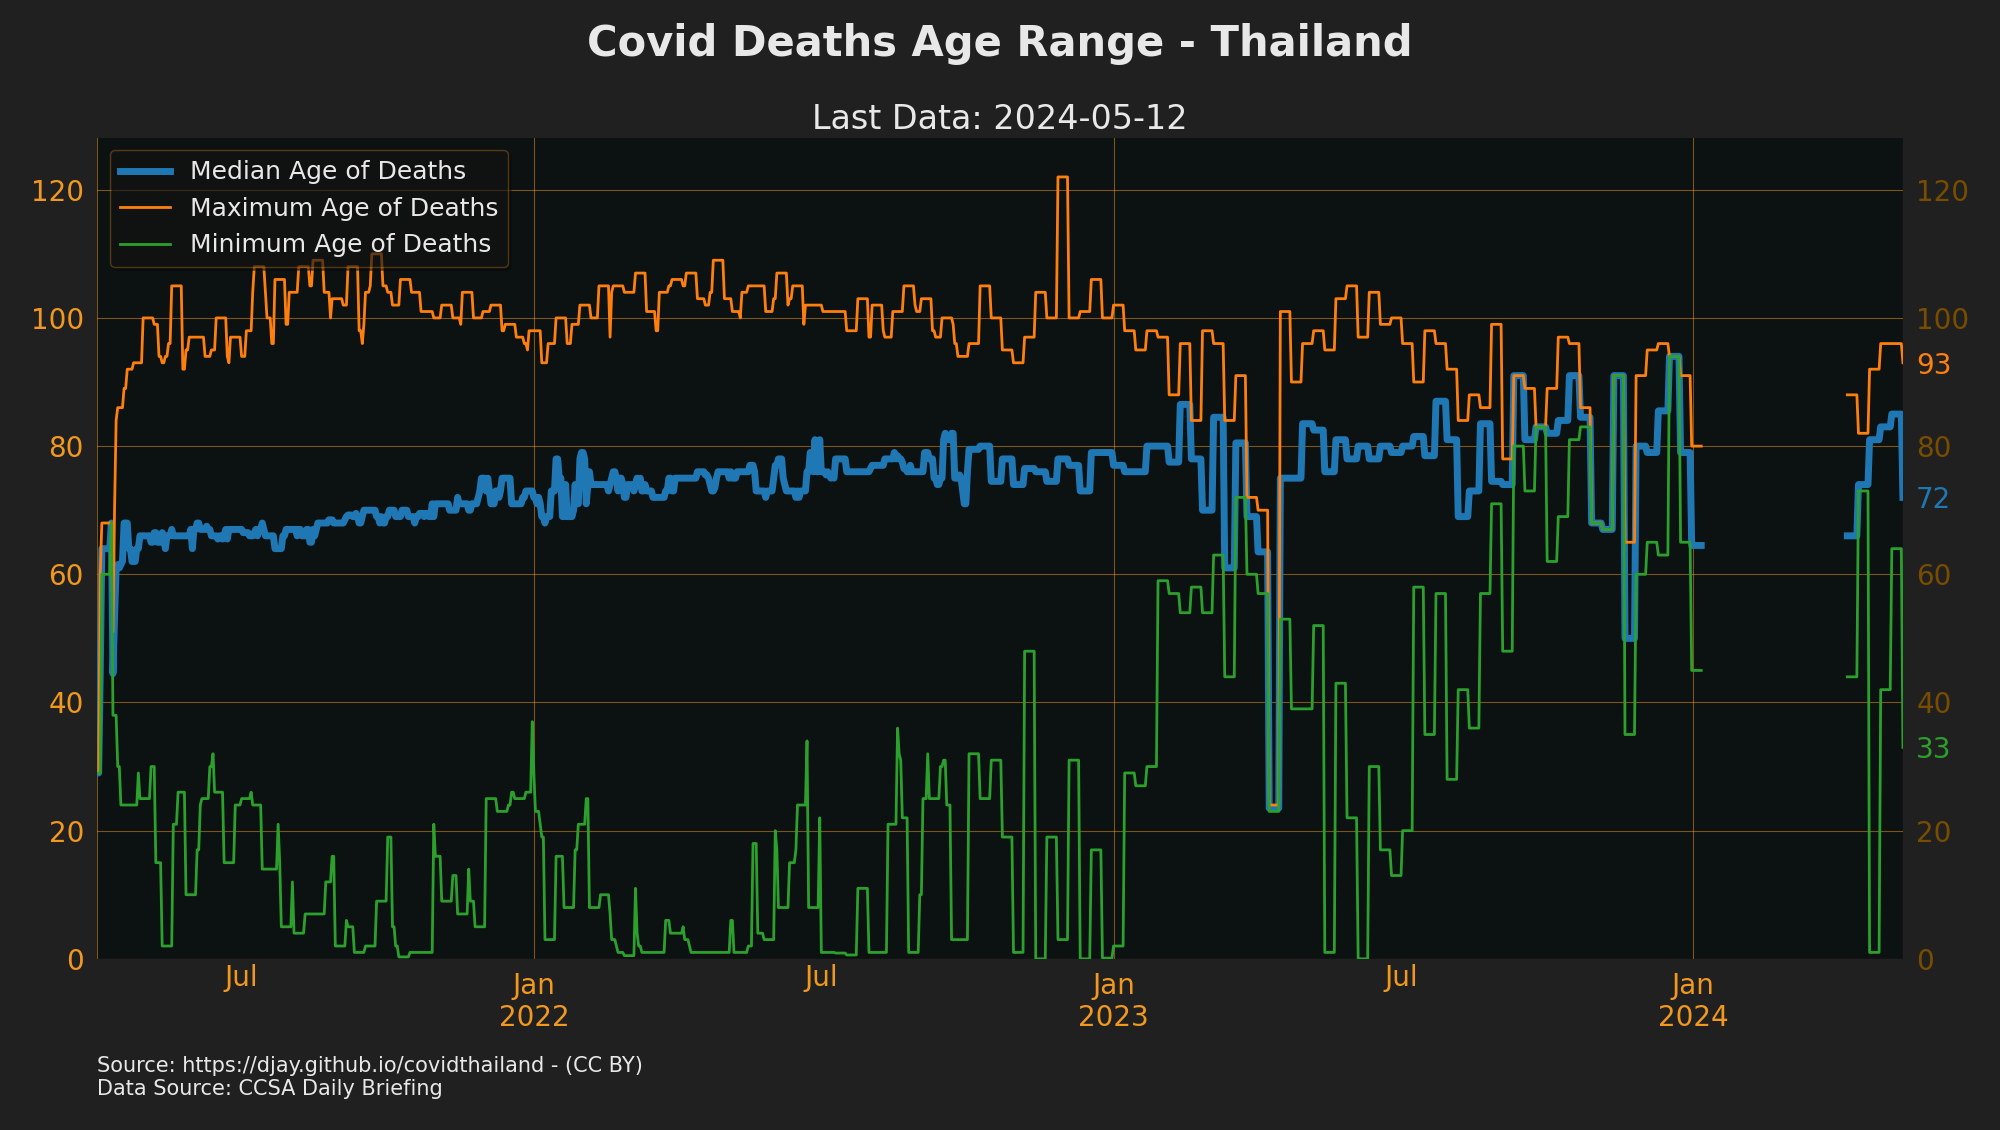
- Source: [CCSA Daily Briefing](downloads.md#dl-briefings)
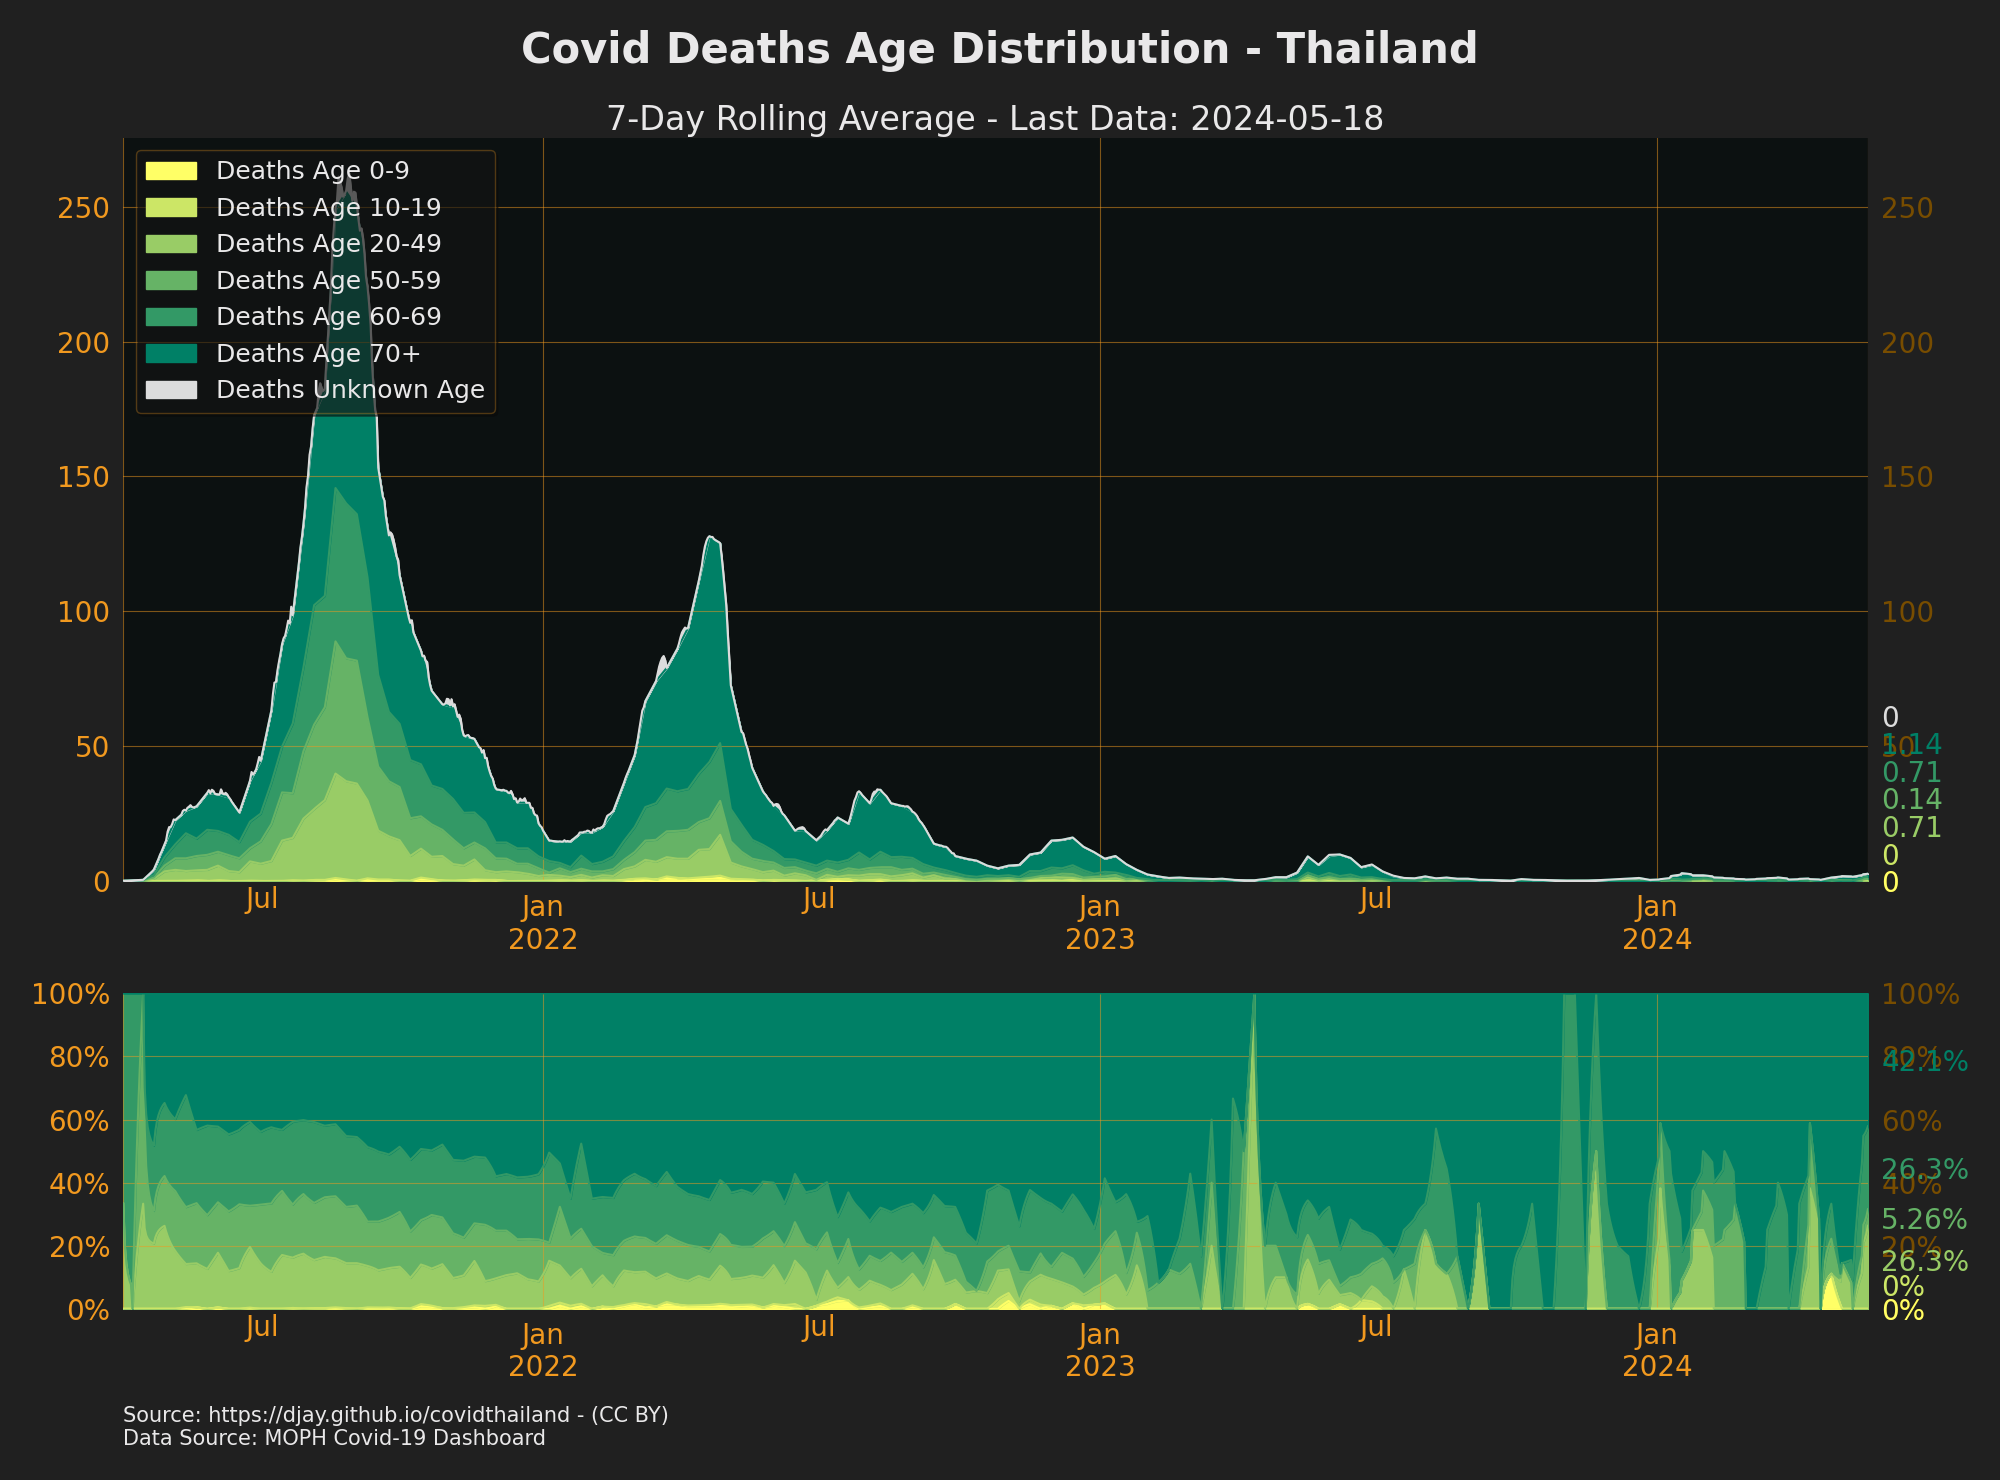
## COVID-19 Death Comorbidities and Risks
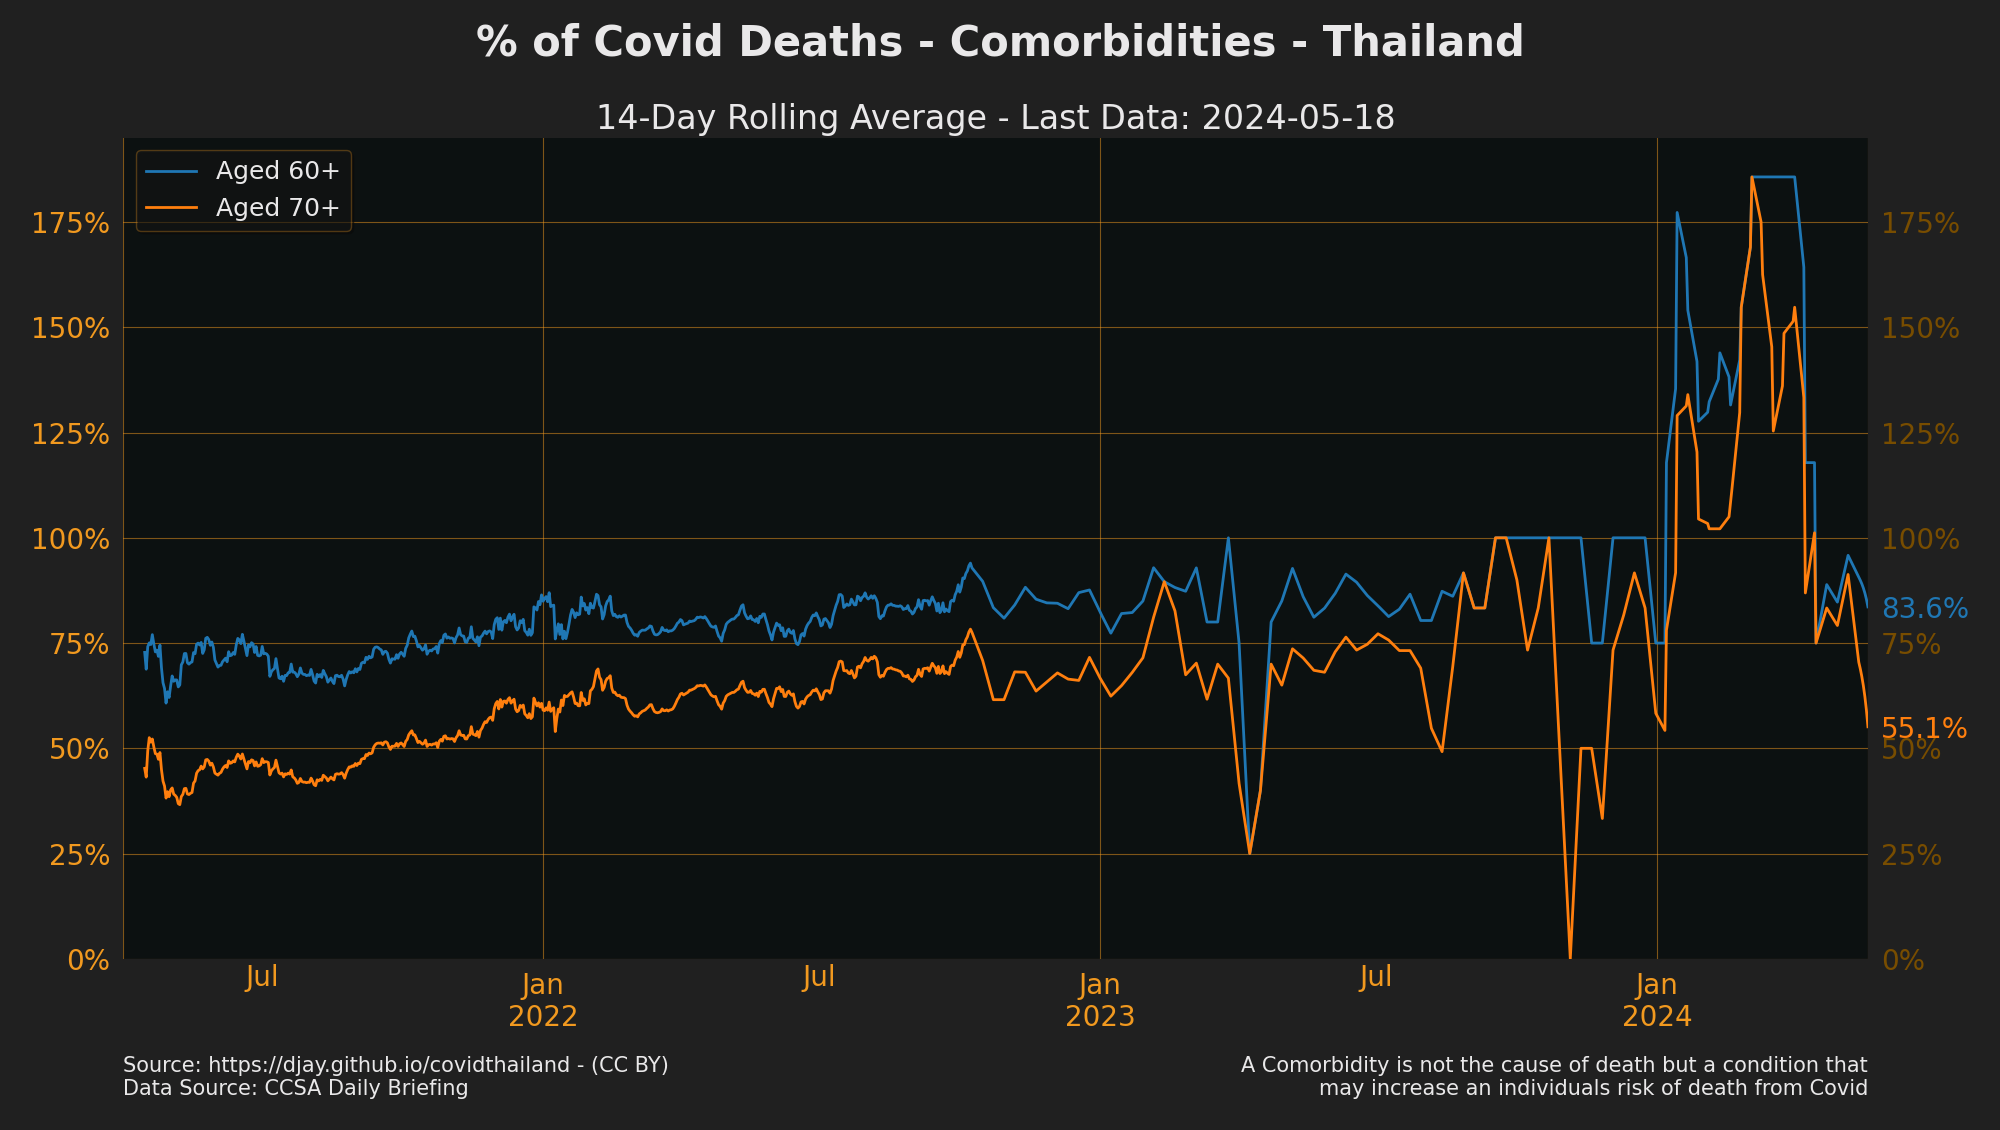
- [The existance of Comorbidities still means the cause of death was Covid](https://github.com/djay/covidthailand/discussions/251) and doesn't imply that these conditions were likely to cause death in that individual in the near future.

- Source: [MOPH Covid-19 Dashboard](downloads.md#dl-moph-dashboard)
## Estimated Daily Infections
*No longer updated so model is inaccurate*

- IHME: stopped updating predictions from 2022-12-16 so estimates become less reliable the further past that date.
- Note: no country tests everyone so modelling is needed to estimate the real number
of infections in the community including asymtematic infections. Modelling includes
many factors such as the estimated deaths, immunity and fatality rate of the variants for a given demographic.
- ATK+ from the DDC Dashboard is not clear if this is an estimate or some measure of reported infections to MOPH. Interpoloated from weekly figure.
- ATK (Probable Cases) has stopped being reported
- As of 1st June 2022, only severe cases are tested for PCR and report cases only includes PCR results so the trend of cases doesn't indicate
infections as well as it did previously.
- For forecasts of total infections/deaths/hospitalisations see
[IHME Thailand](https://covid19.healthdata.org/thailand) |
[IHME Thailand Report](http://www.healthdata.org/covid/updates) |
[ICL Thailand](https://mrc-ide.github.io/global-lmic-reports/THA/) |
[LSHTM Thailand](https://epiforecasts.io/covid/posts/national/thailand/) |
[OWID Covid Models for Thailand](https://ourworldindata.org/grapher/daily-new-estimated-infections-of-covid-19?country=~THA) |
[Google mobility data](https://ourworldindata.org/grapher/changes-visitors-covid?time=2021-04-01..latest&country=~THA)
- Source: [IHME COVID estimates](http://www.healthdata.org/covid/data-downloads), [MOPH Covid-19 Dashboard](downloads.md#dl-moph-dashboard), [CCSA Daily Briefing](downloads.md#dl-briefings)
## Cases by Region
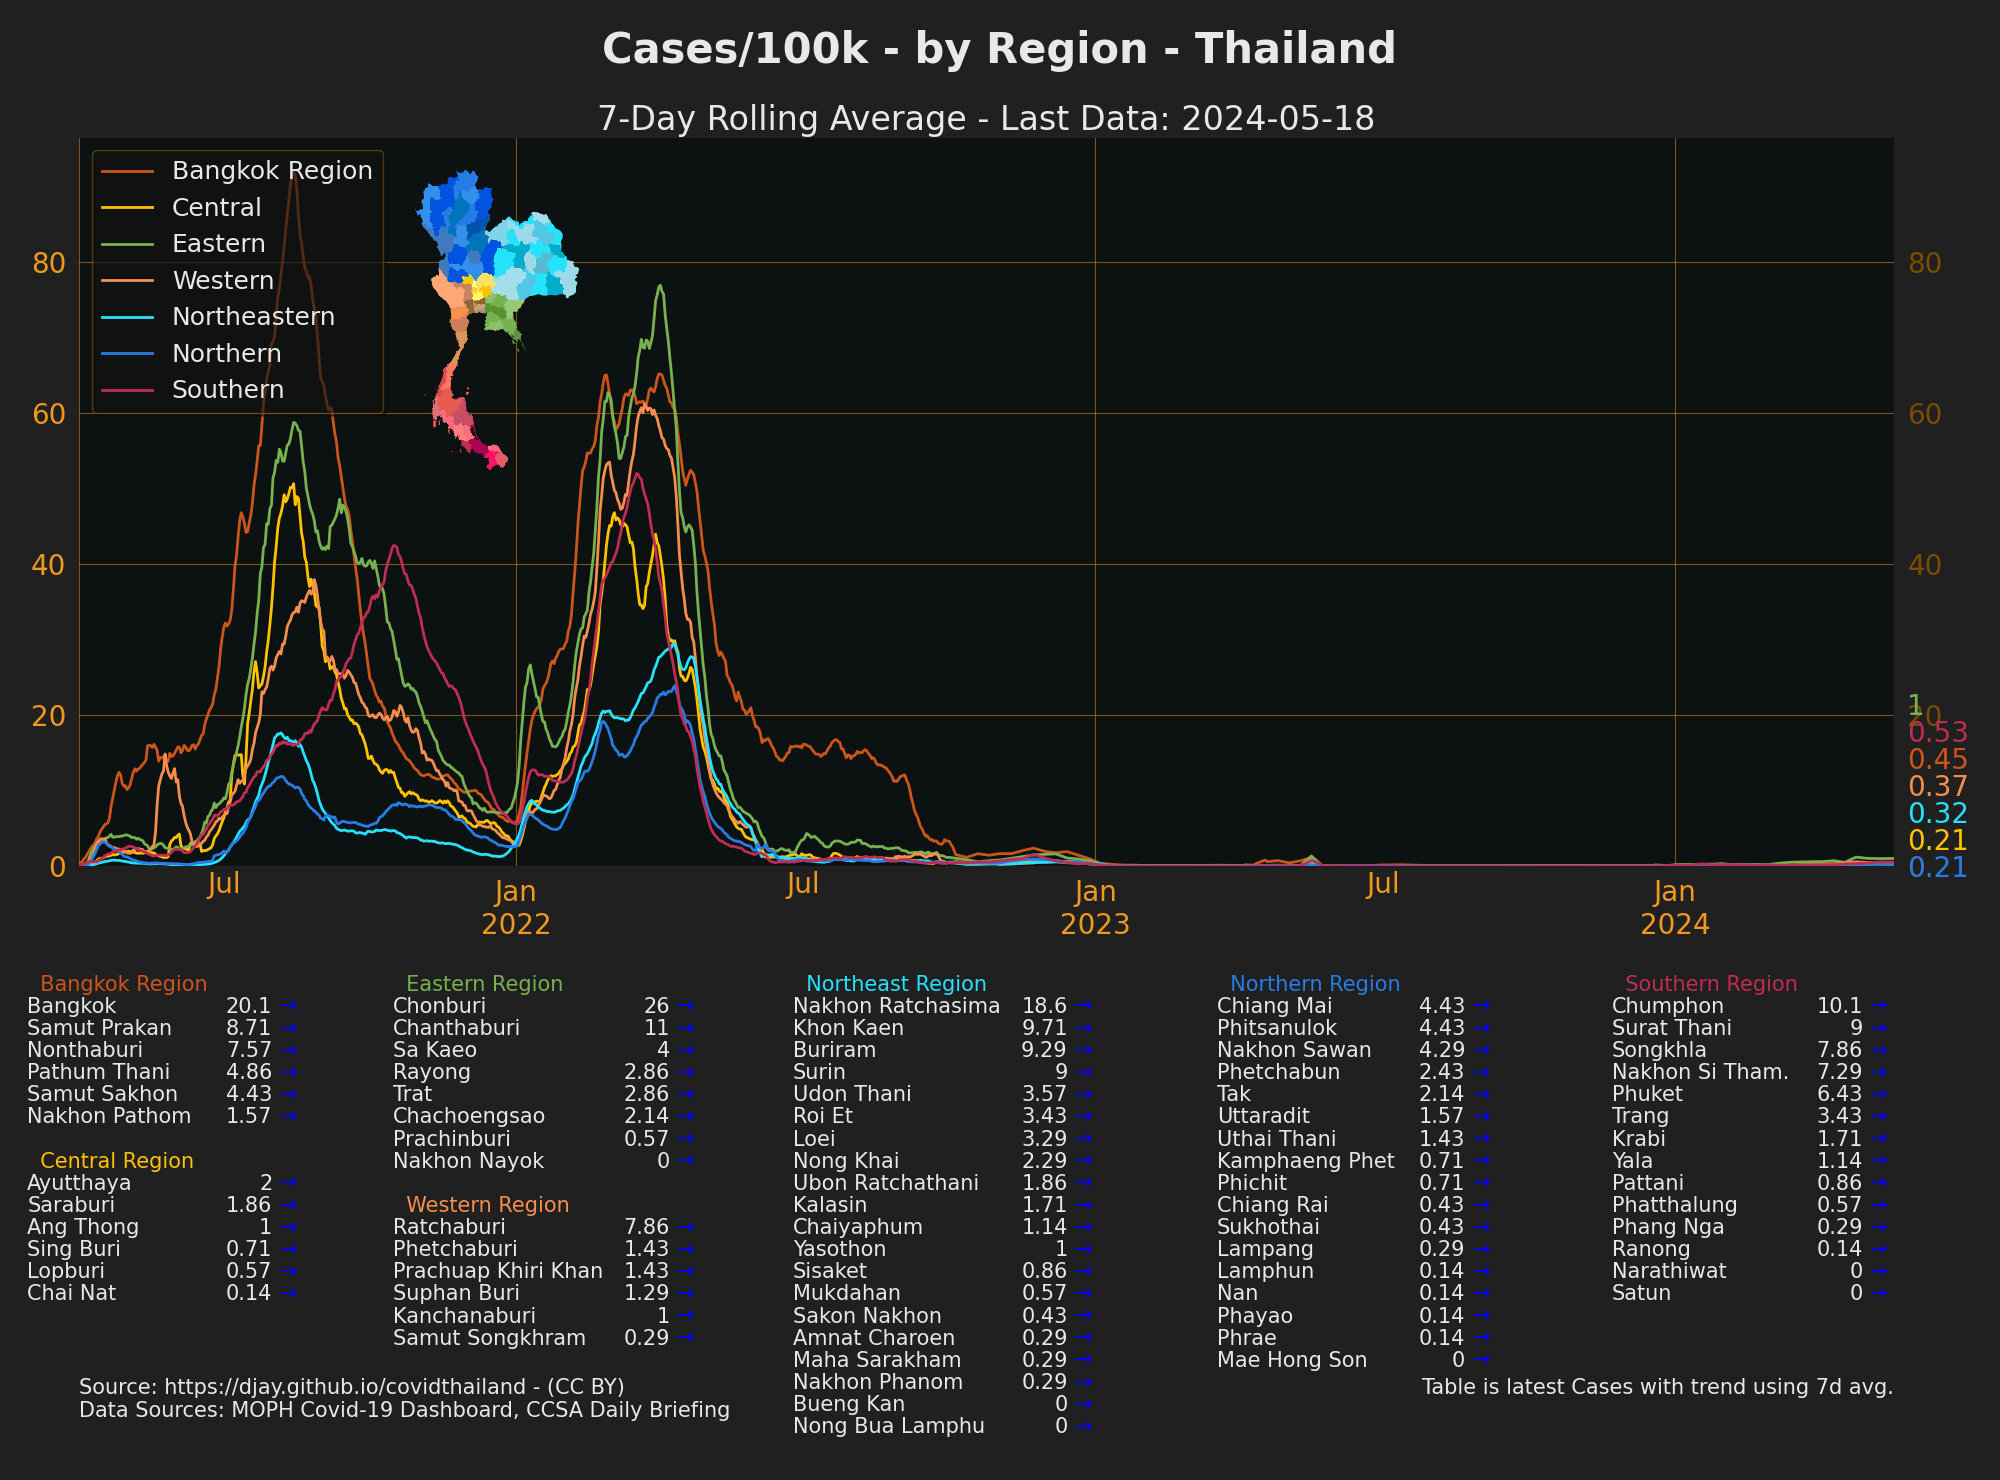
[Bangkok Region](https://practical-ritchie-cca141.netlify.app/outputs/cases_prov_bangkokmetropolitanregion_4.png) - [Central](https://practical-ritchie-cca141.netlify.app/outputs/cases_prov_central_4.png) - [Eastern](https://practical-ritchie-cca141.netlify.app/outputs/cases_prov_eastern_4.png) - [Western](https://practical-ritchie-cca141.netlify.app/outputs/cases_prov_western_4.png) - [Northeast A-N](https://practical-ritchie-cca141.netlify.app/outputs/cases_prov_northeastern1_4.png) - [Northeast N-Y](https://practical-ritchie-cca141.netlify.app/outputs/cases_prov_northeastern2_4.png) - [Northern C-N](https://practical-ritchie-cca141.netlify.app/outputs/cases_prov_northern1_4.png) - [Northern P-U](https://practical-ritchie-cca141.netlify.app/outputs/cases_prov_northern2_4.png) - [Southern C-P](https://practical-ritchie-cca141.netlify.app/outputs/cases_prov_southern1_4.png) - [Southern R-Y](https://practical-ritchie-cca141.netlify.app/outputs/cases_prov_southern2_4.png)
- [Cases by Region: Full Year](https://practical-ritchie-cca141.netlify.app/outputs/cases_region_all.png)
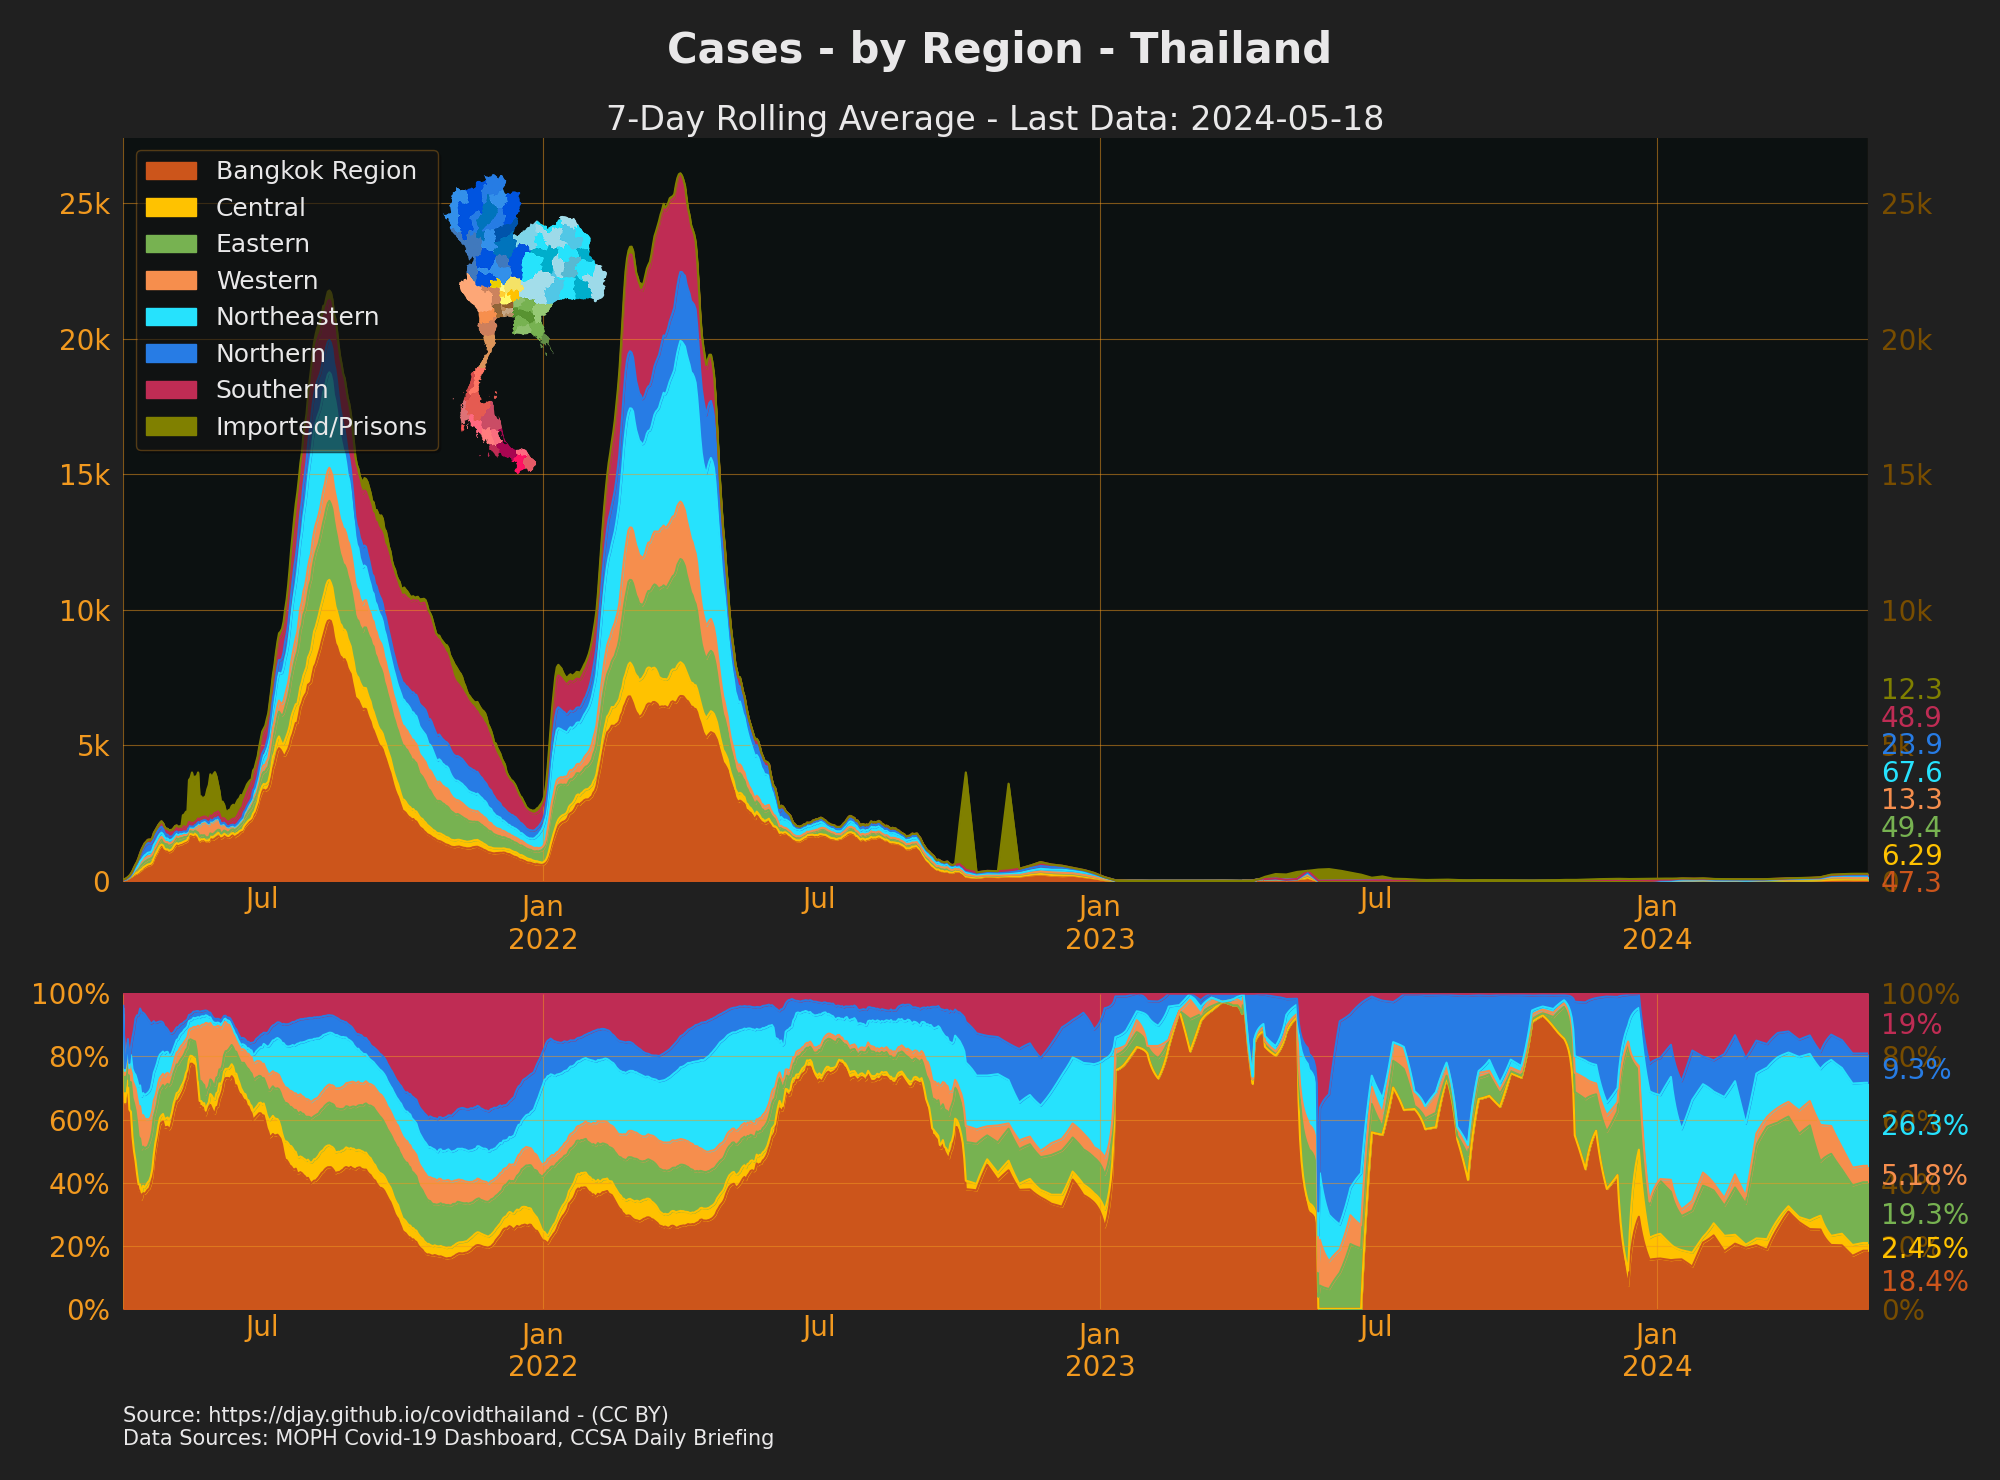
- Sources: [CCSA Daily Briefing](downloads.md#dl-briefings)
## Cases by Province
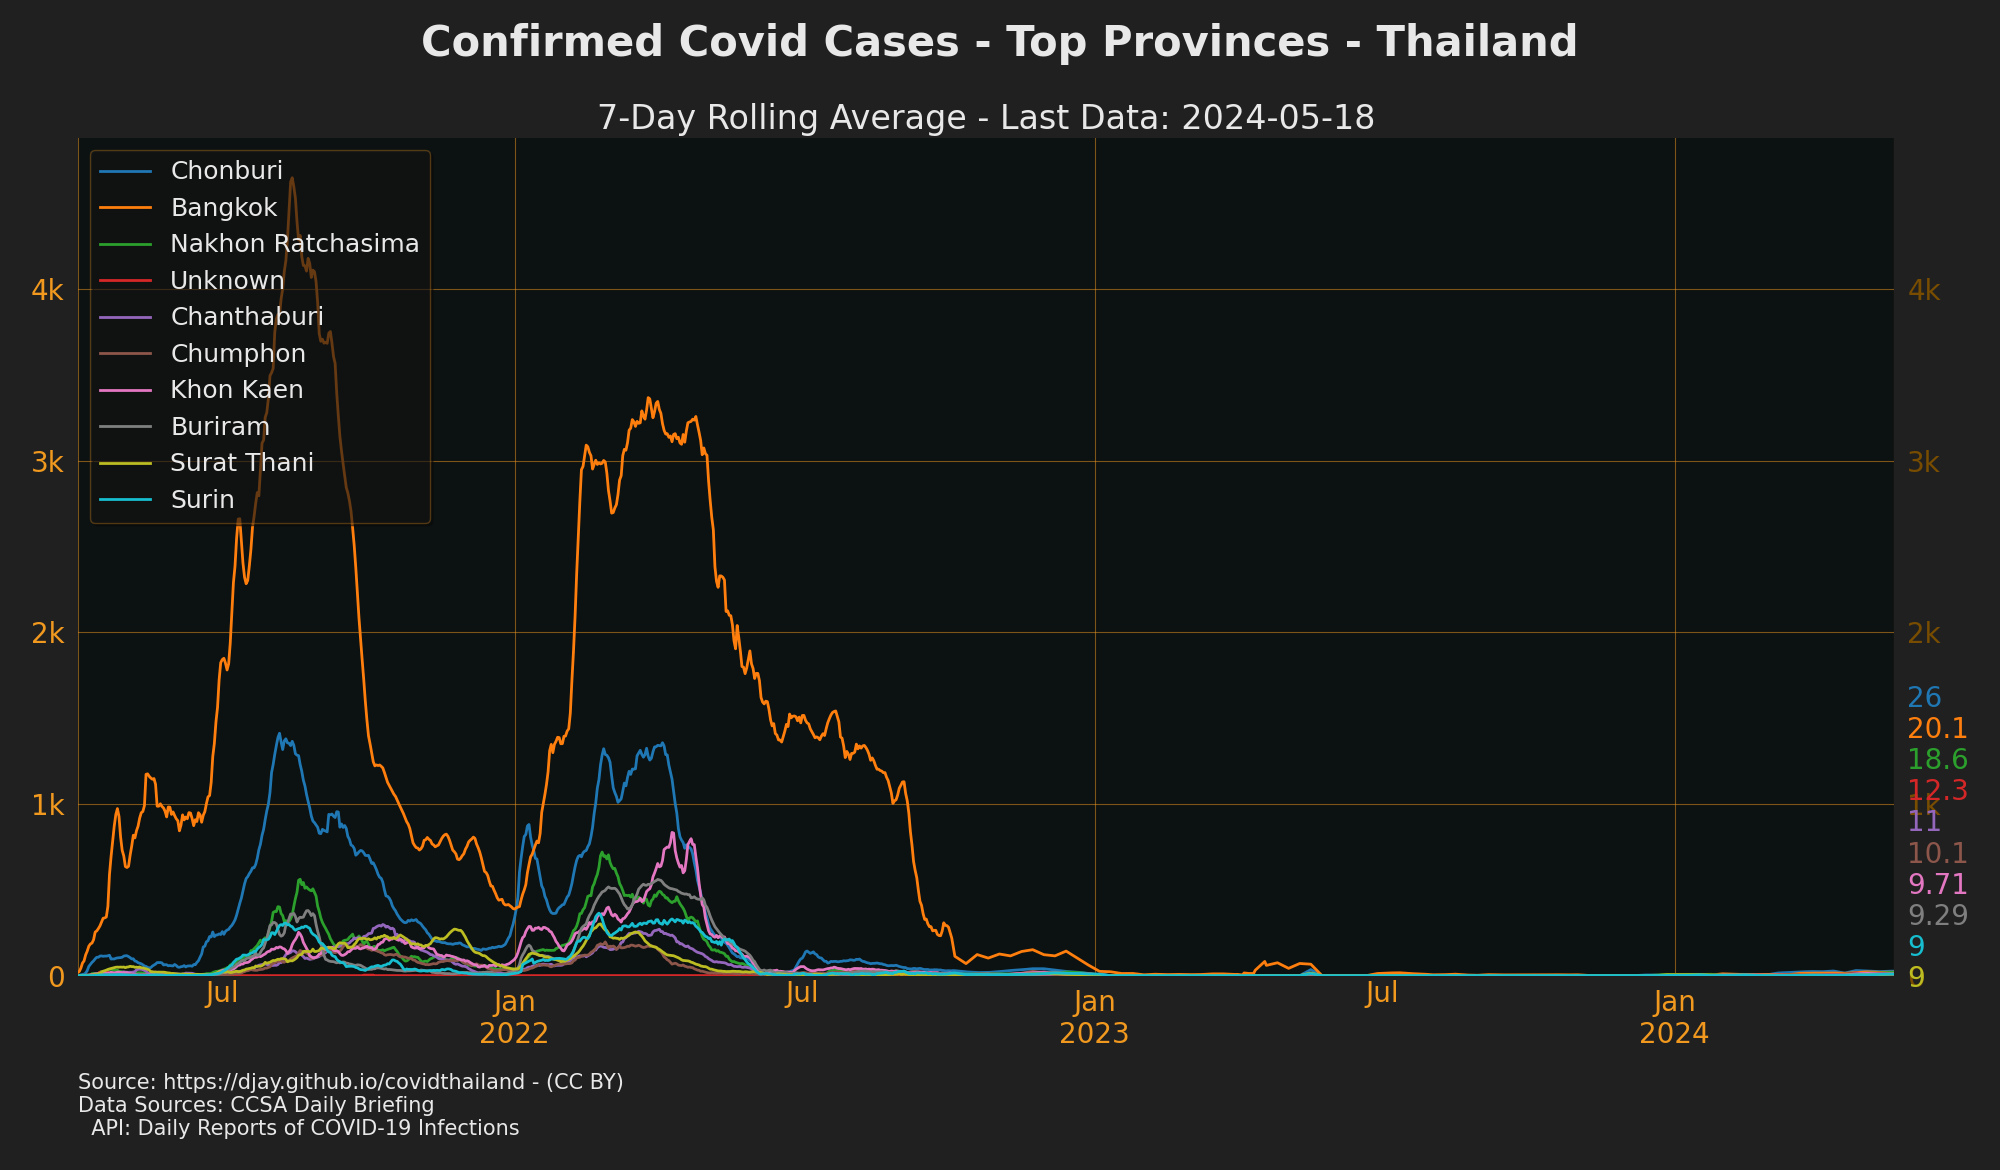
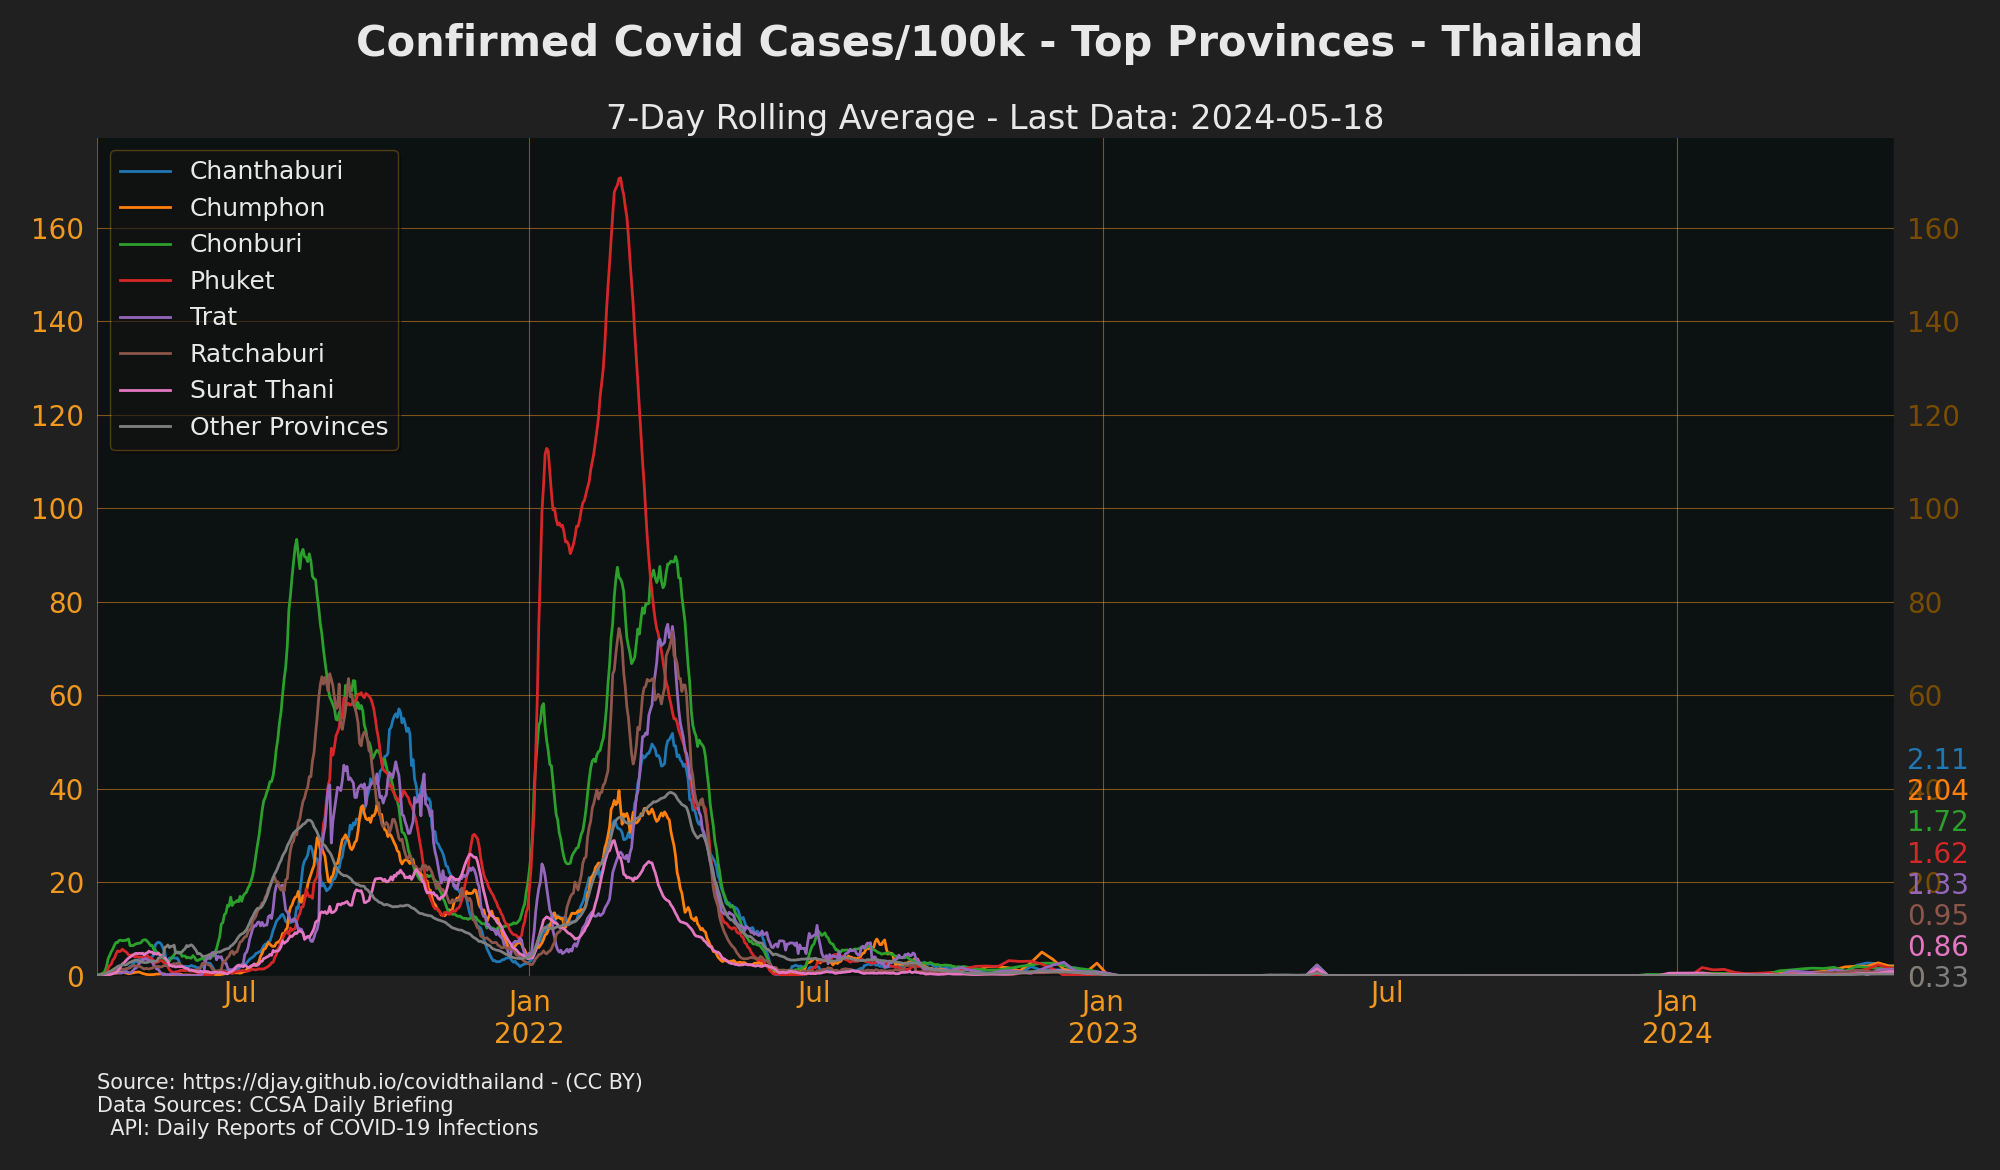
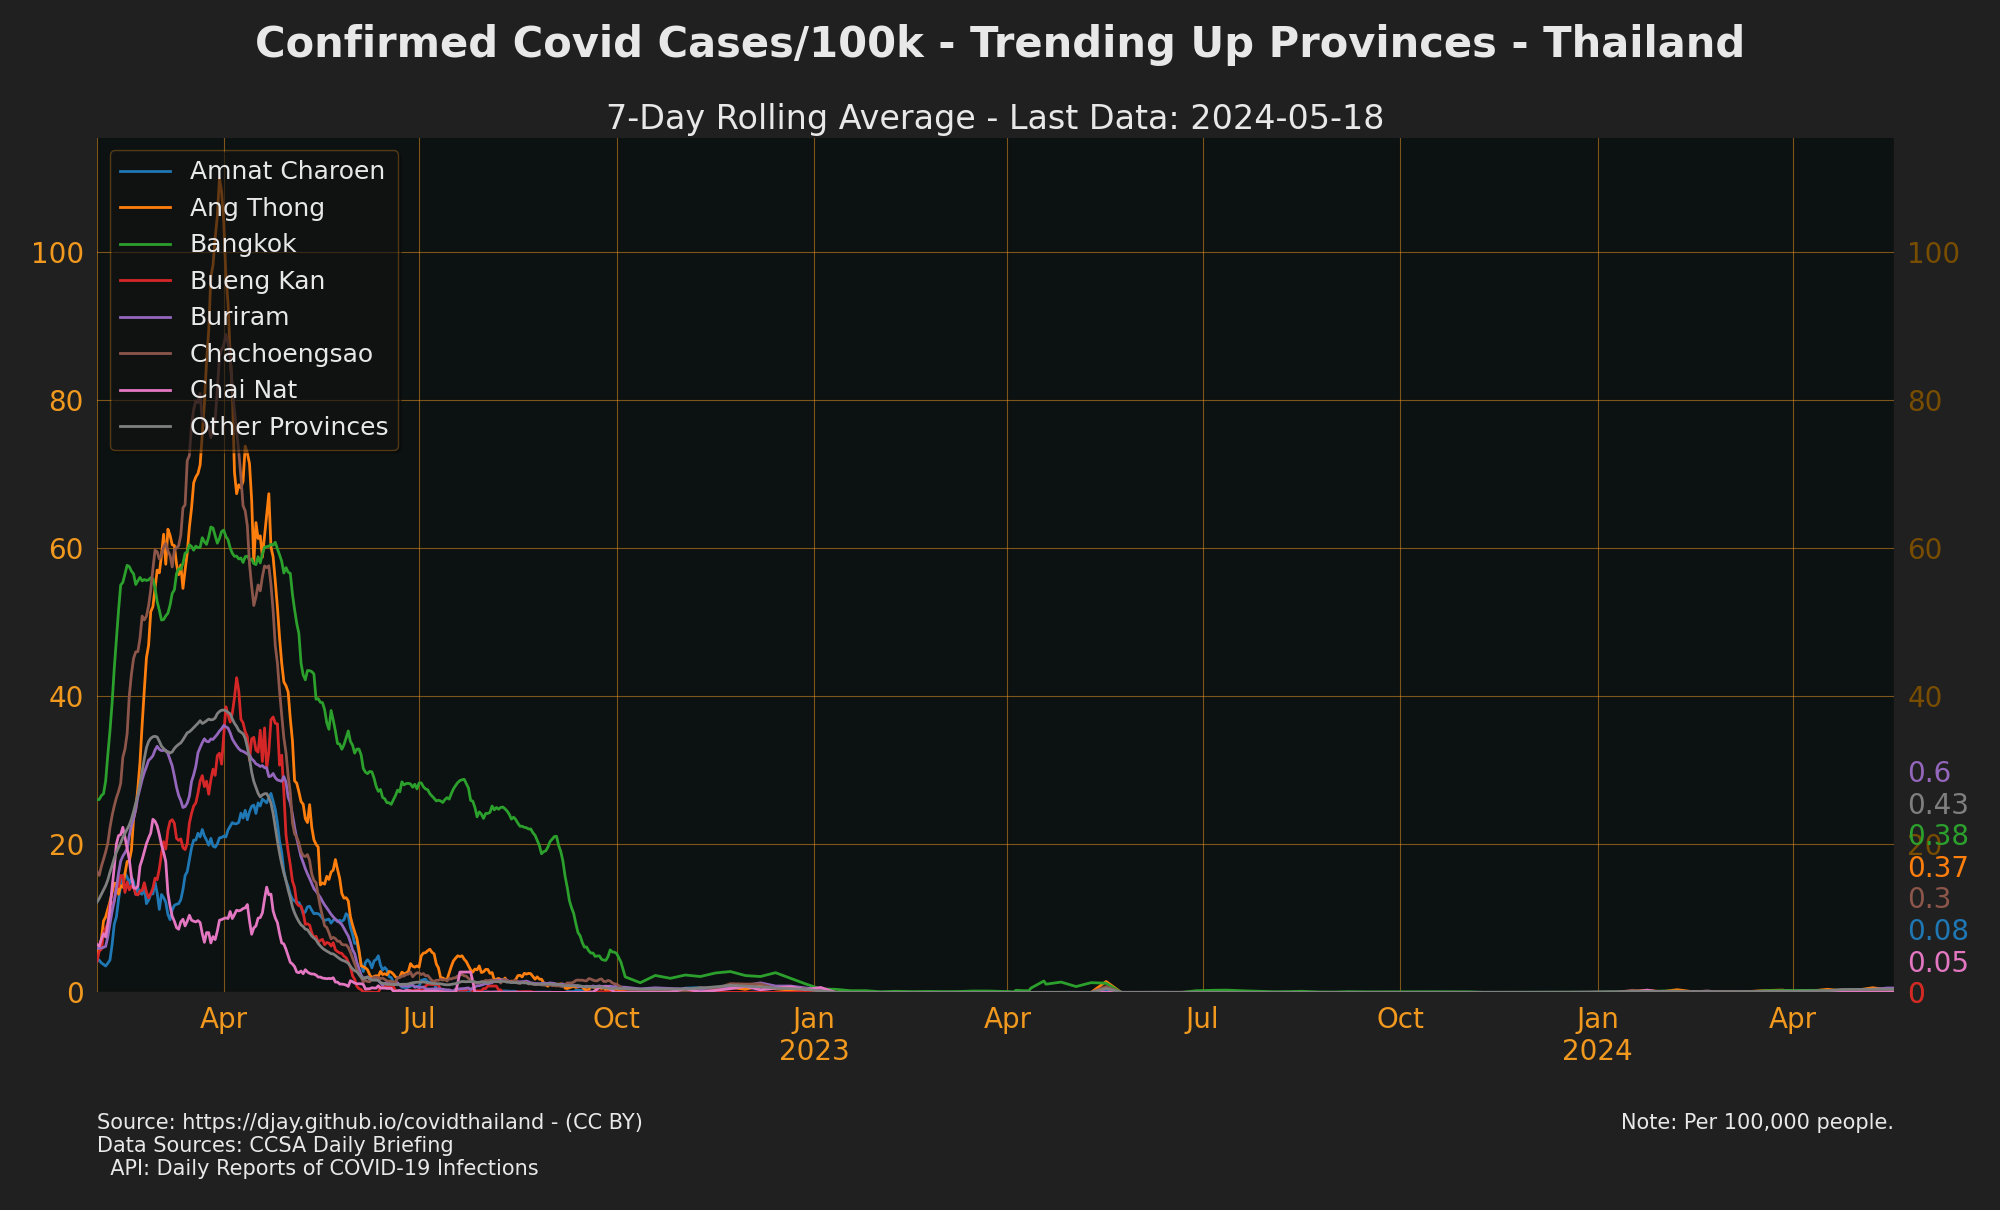
- [Trending Down Confirmed Cases](https://practical-ritchie-cca141.netlify.app/outputs/cases_prov_decreasing_3.png)
- Sources: [CCSA Daily Briefing](downloads.md#dl-briefings), [API: Daily reports of COVID-19 infections](https://data.go.th/dataset/covid-19-daily)
## Cases by Patient Type
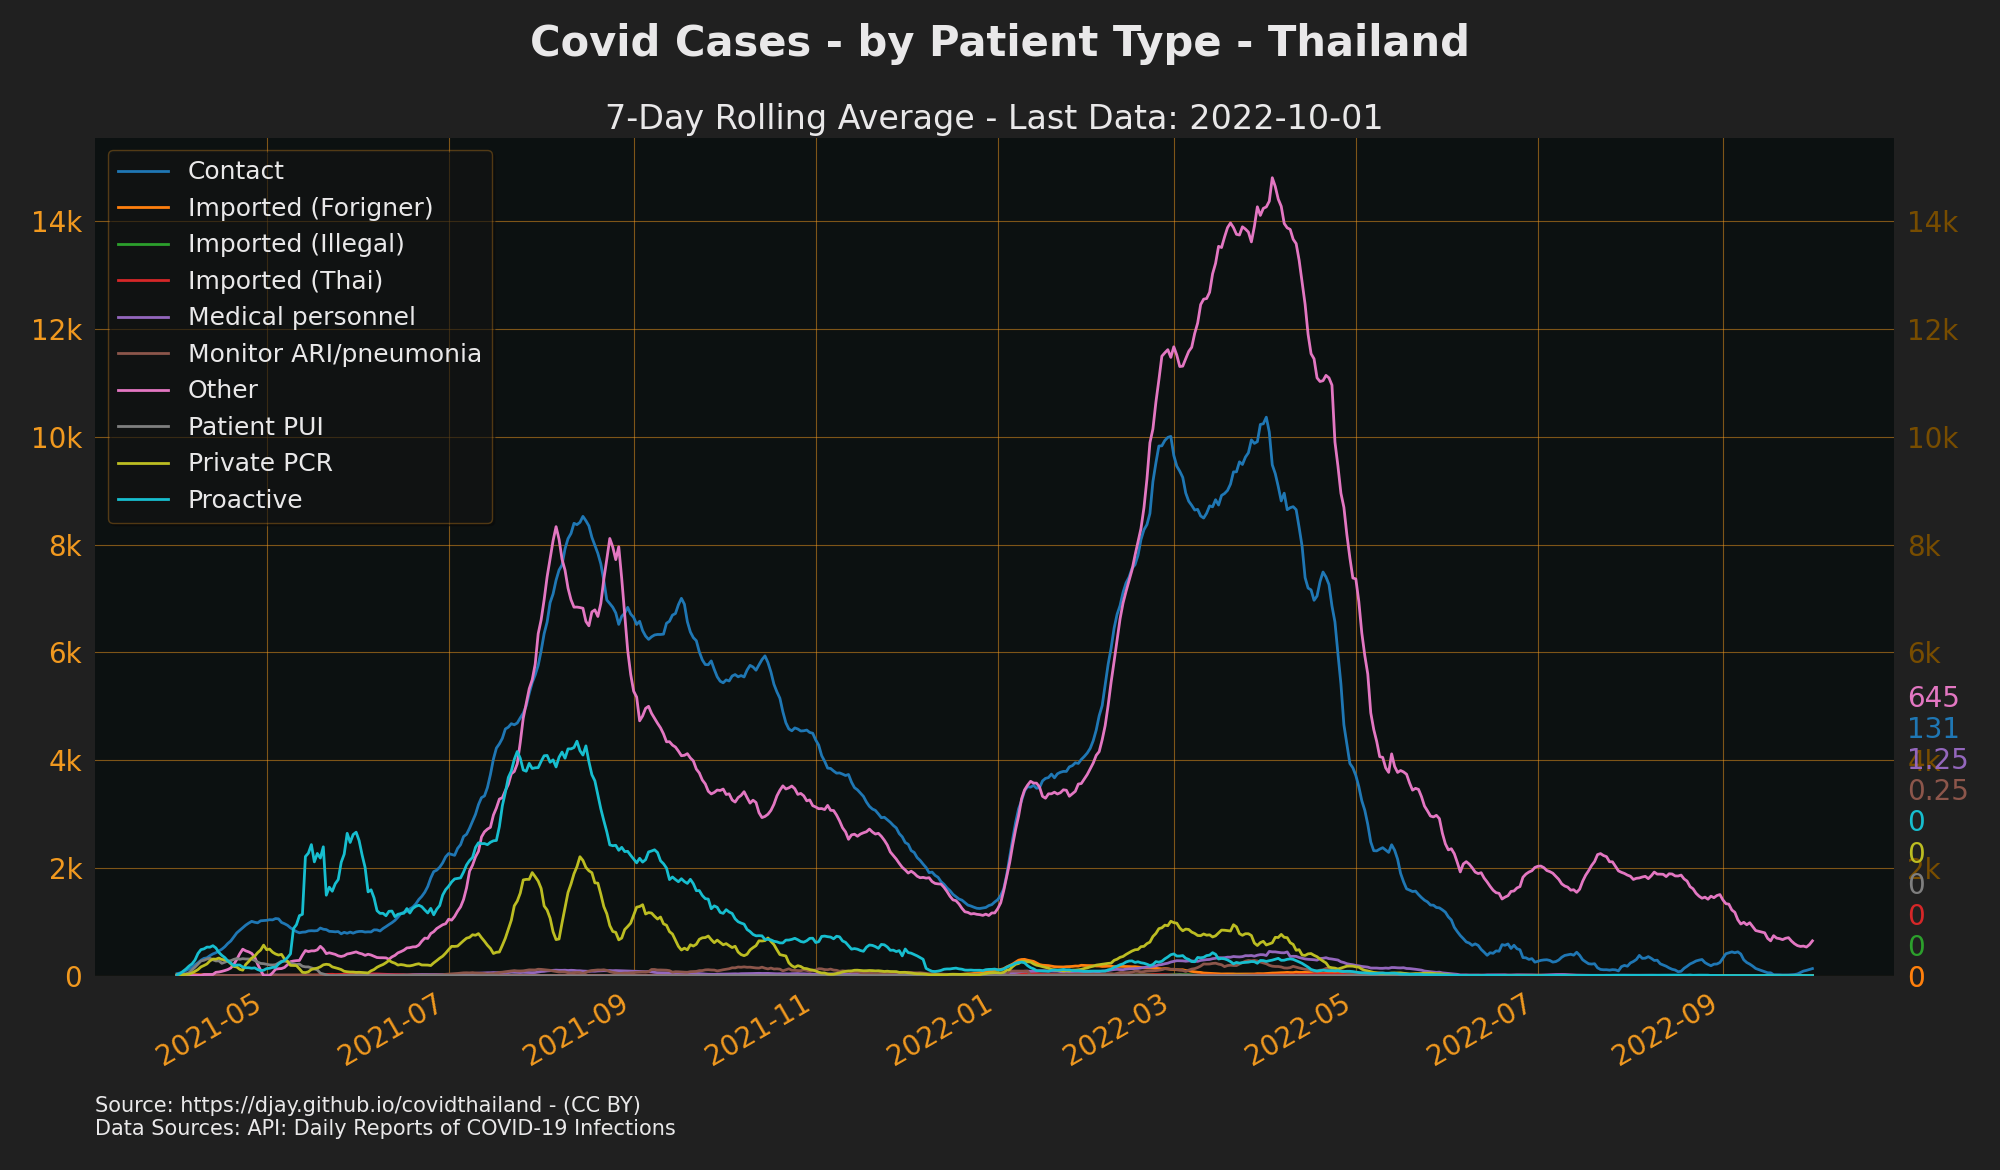
- Source: [API: Daily reports of COVID-19 infections](https://data.go.th/dataset/covid-19-daily)
## Cases by Risk Classification
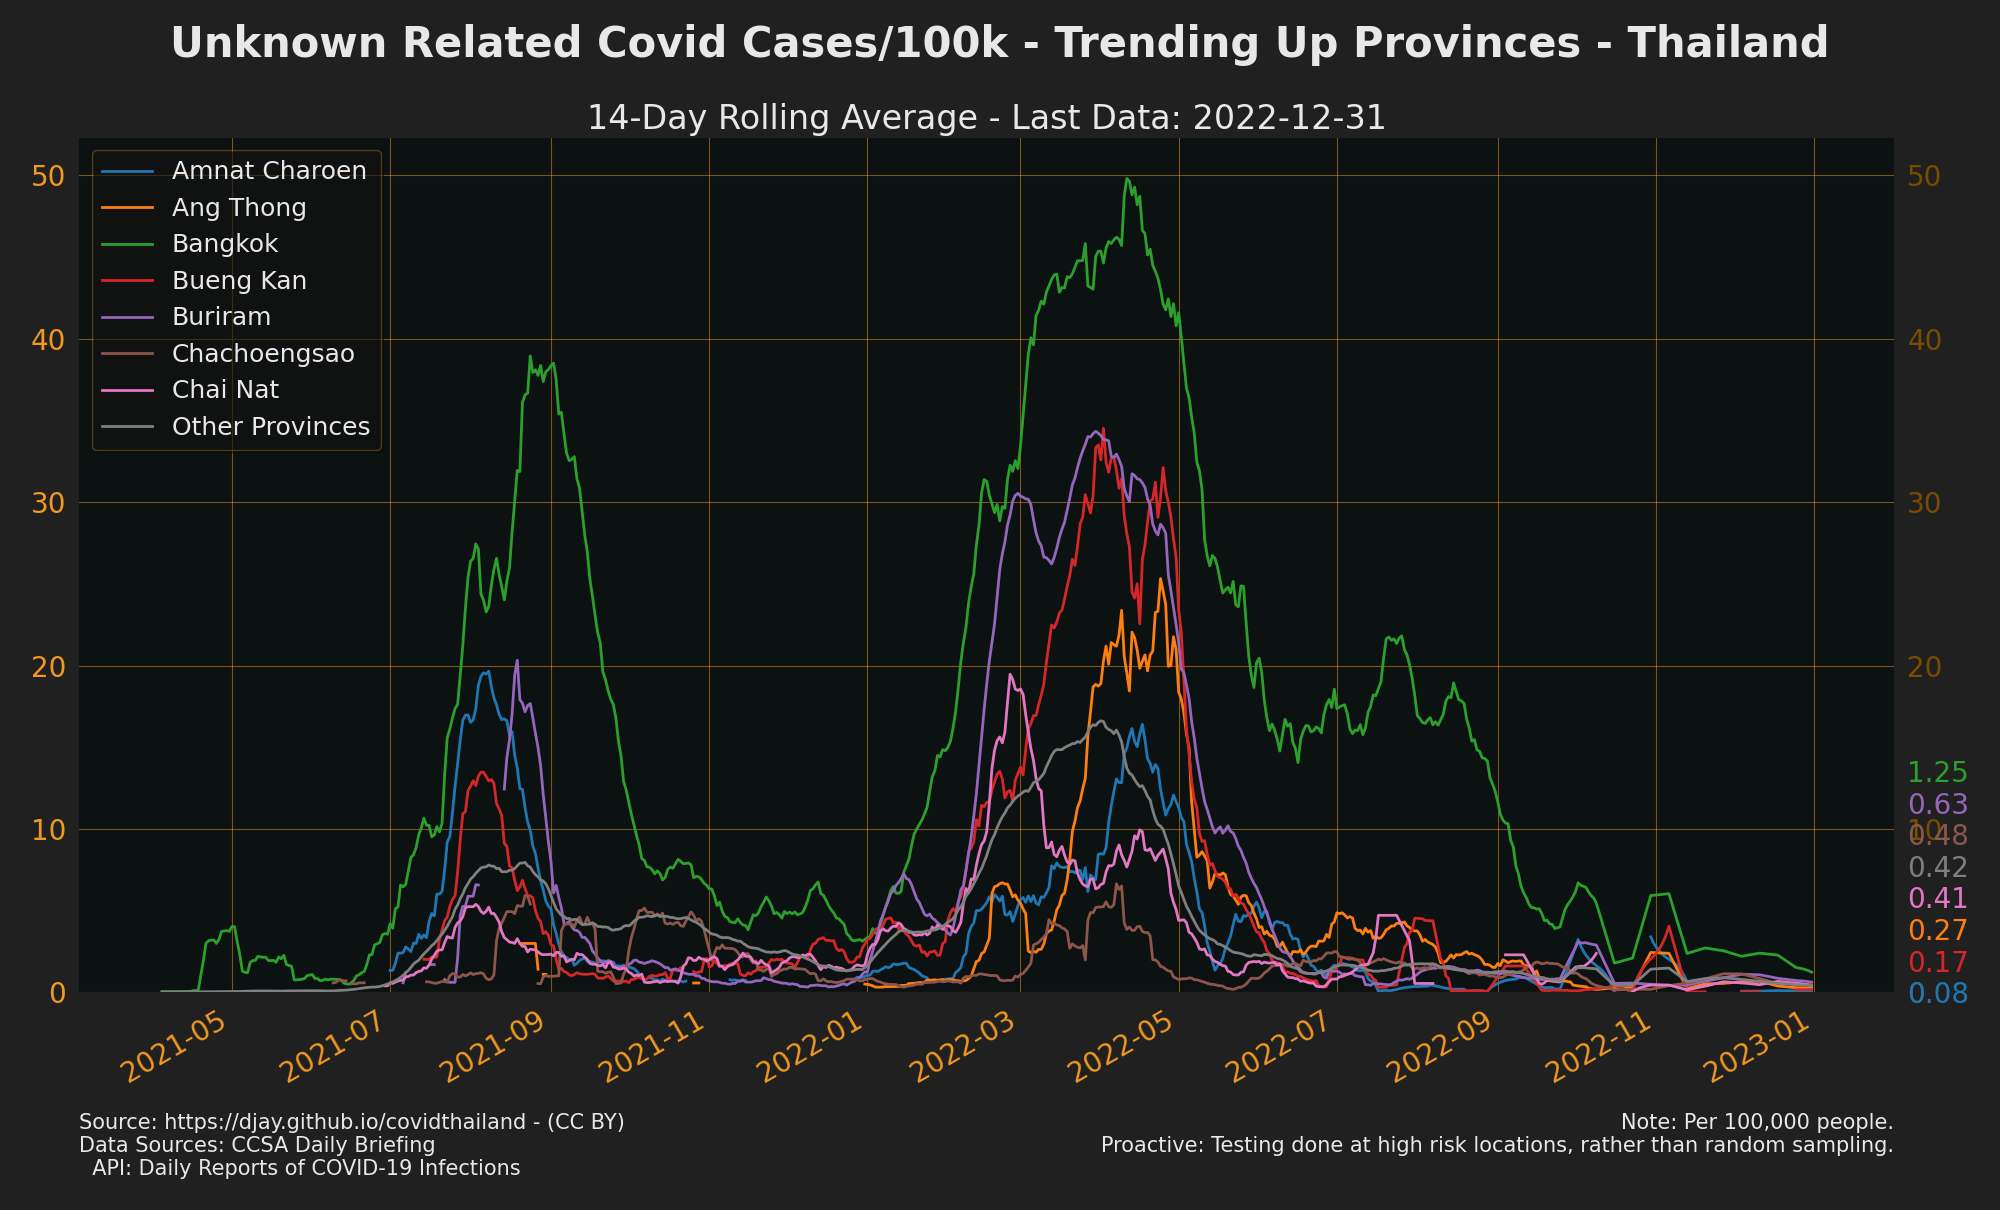 |
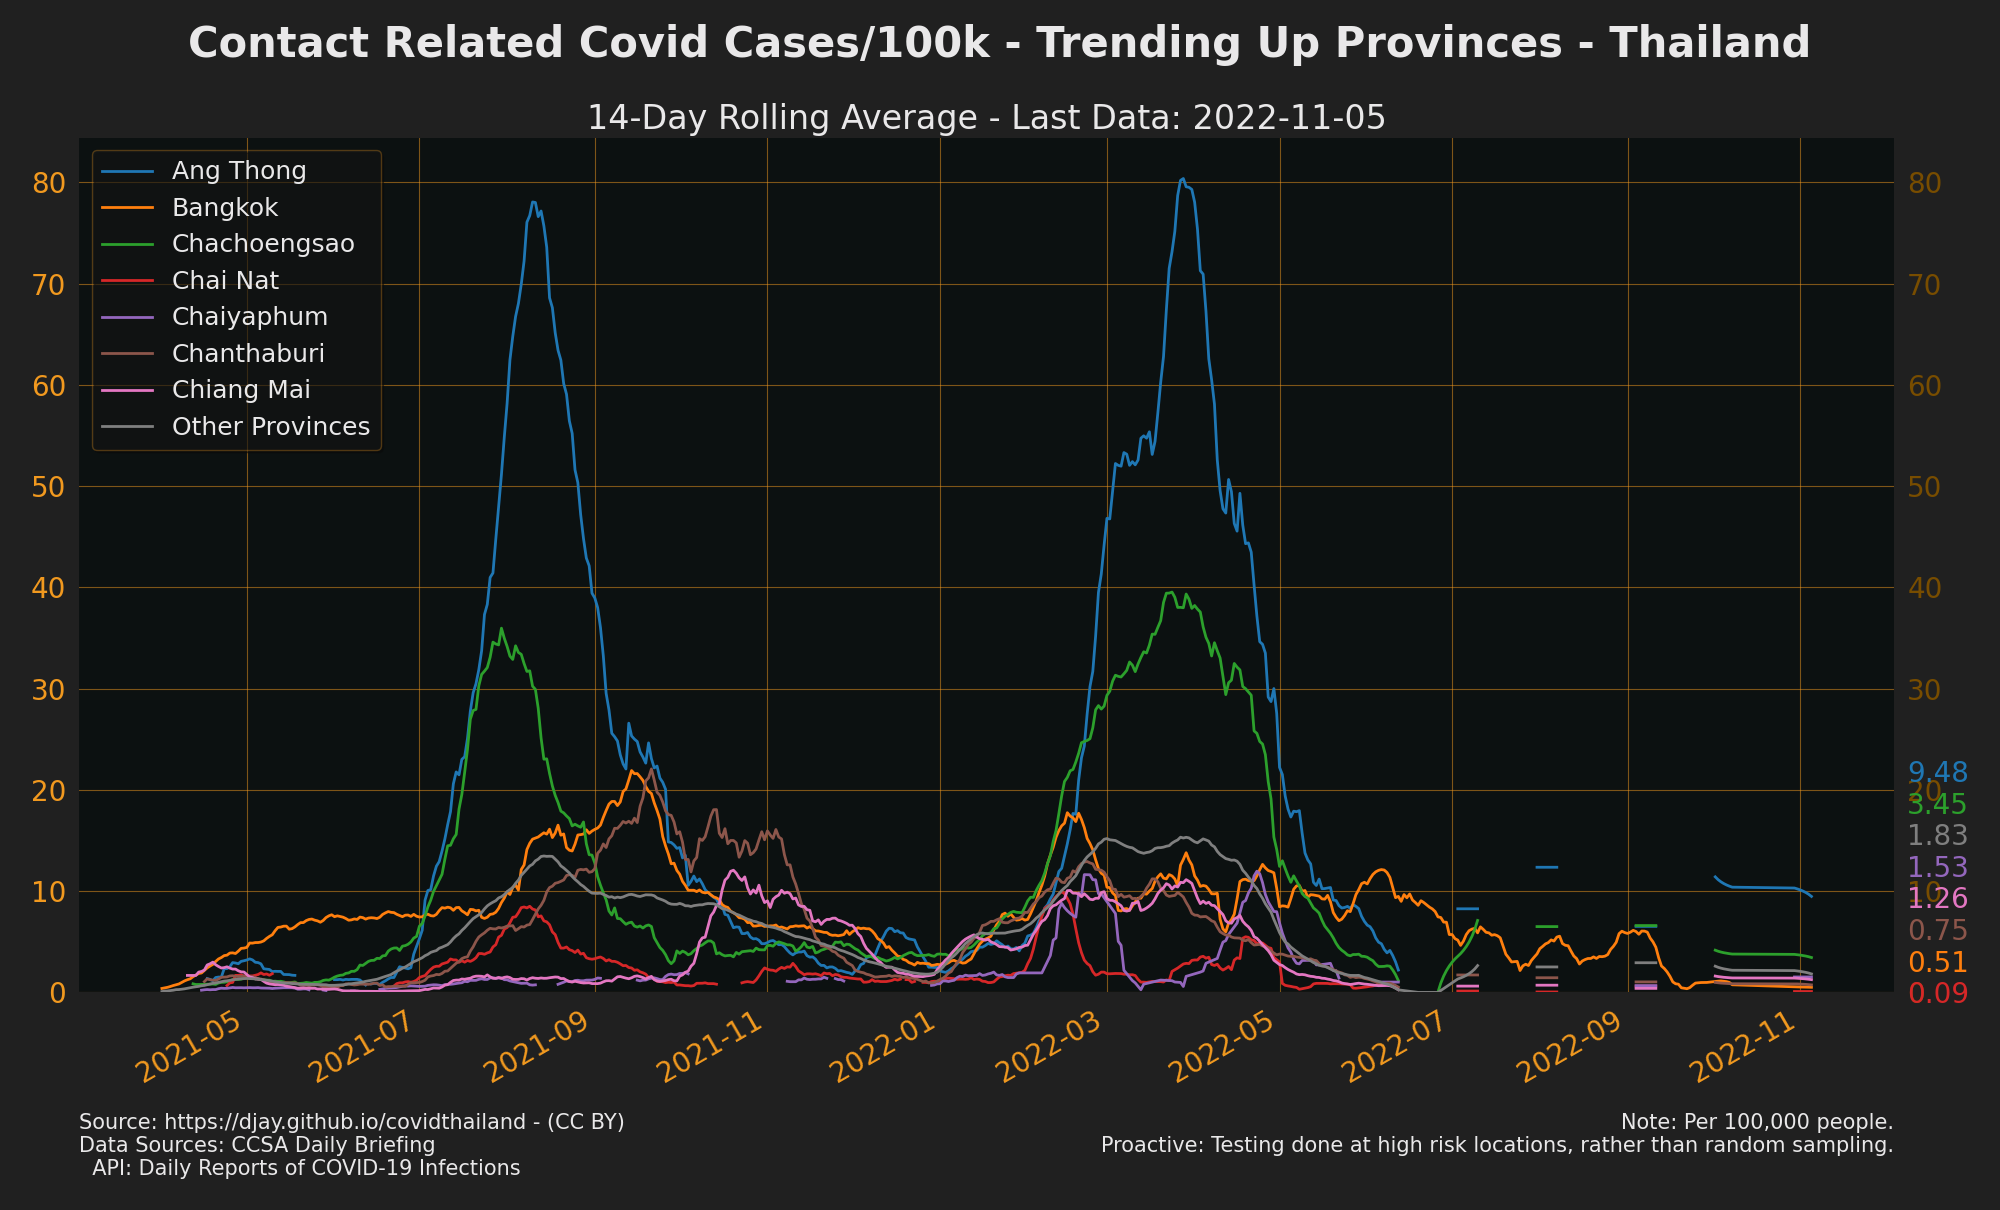
- Provinces Trending Up Cases from
[Community](https://practical-ritchie-cca141.netlify.app/outputs/cases_community_increasing_3.png) |
[Work](https://practical-ritchie-cca141.netlify.app/outputs/cases_work_increasing_3.png) |
[Proactive](https://practical-ritchie-cca141.netlify.app/outputs/cases_proactive_increasing_3.png)
- Provinces Trending Down Cases from
[Unknown](https://practical-ritchie-cca141.netlify.app/outputs/cases_unknown_decreasing_3.png) |
[Contact](https://practical-ritchie-cca141.netlify.app/outputs/cases_contact_decreasing_3.png) |
[Comunity](https://practical-ritchie-cca141.netlify.app/outputs/cases_community_decreasing_3.png) |
[Work](https://practical-ritchie-cca141.netlify.app/outputs/cases_work_decreasing_3.png) |
[Proactive](https://practical-ritchie-cca141.netlify.app/outputs/cases_proactive_decreasing_3.png)
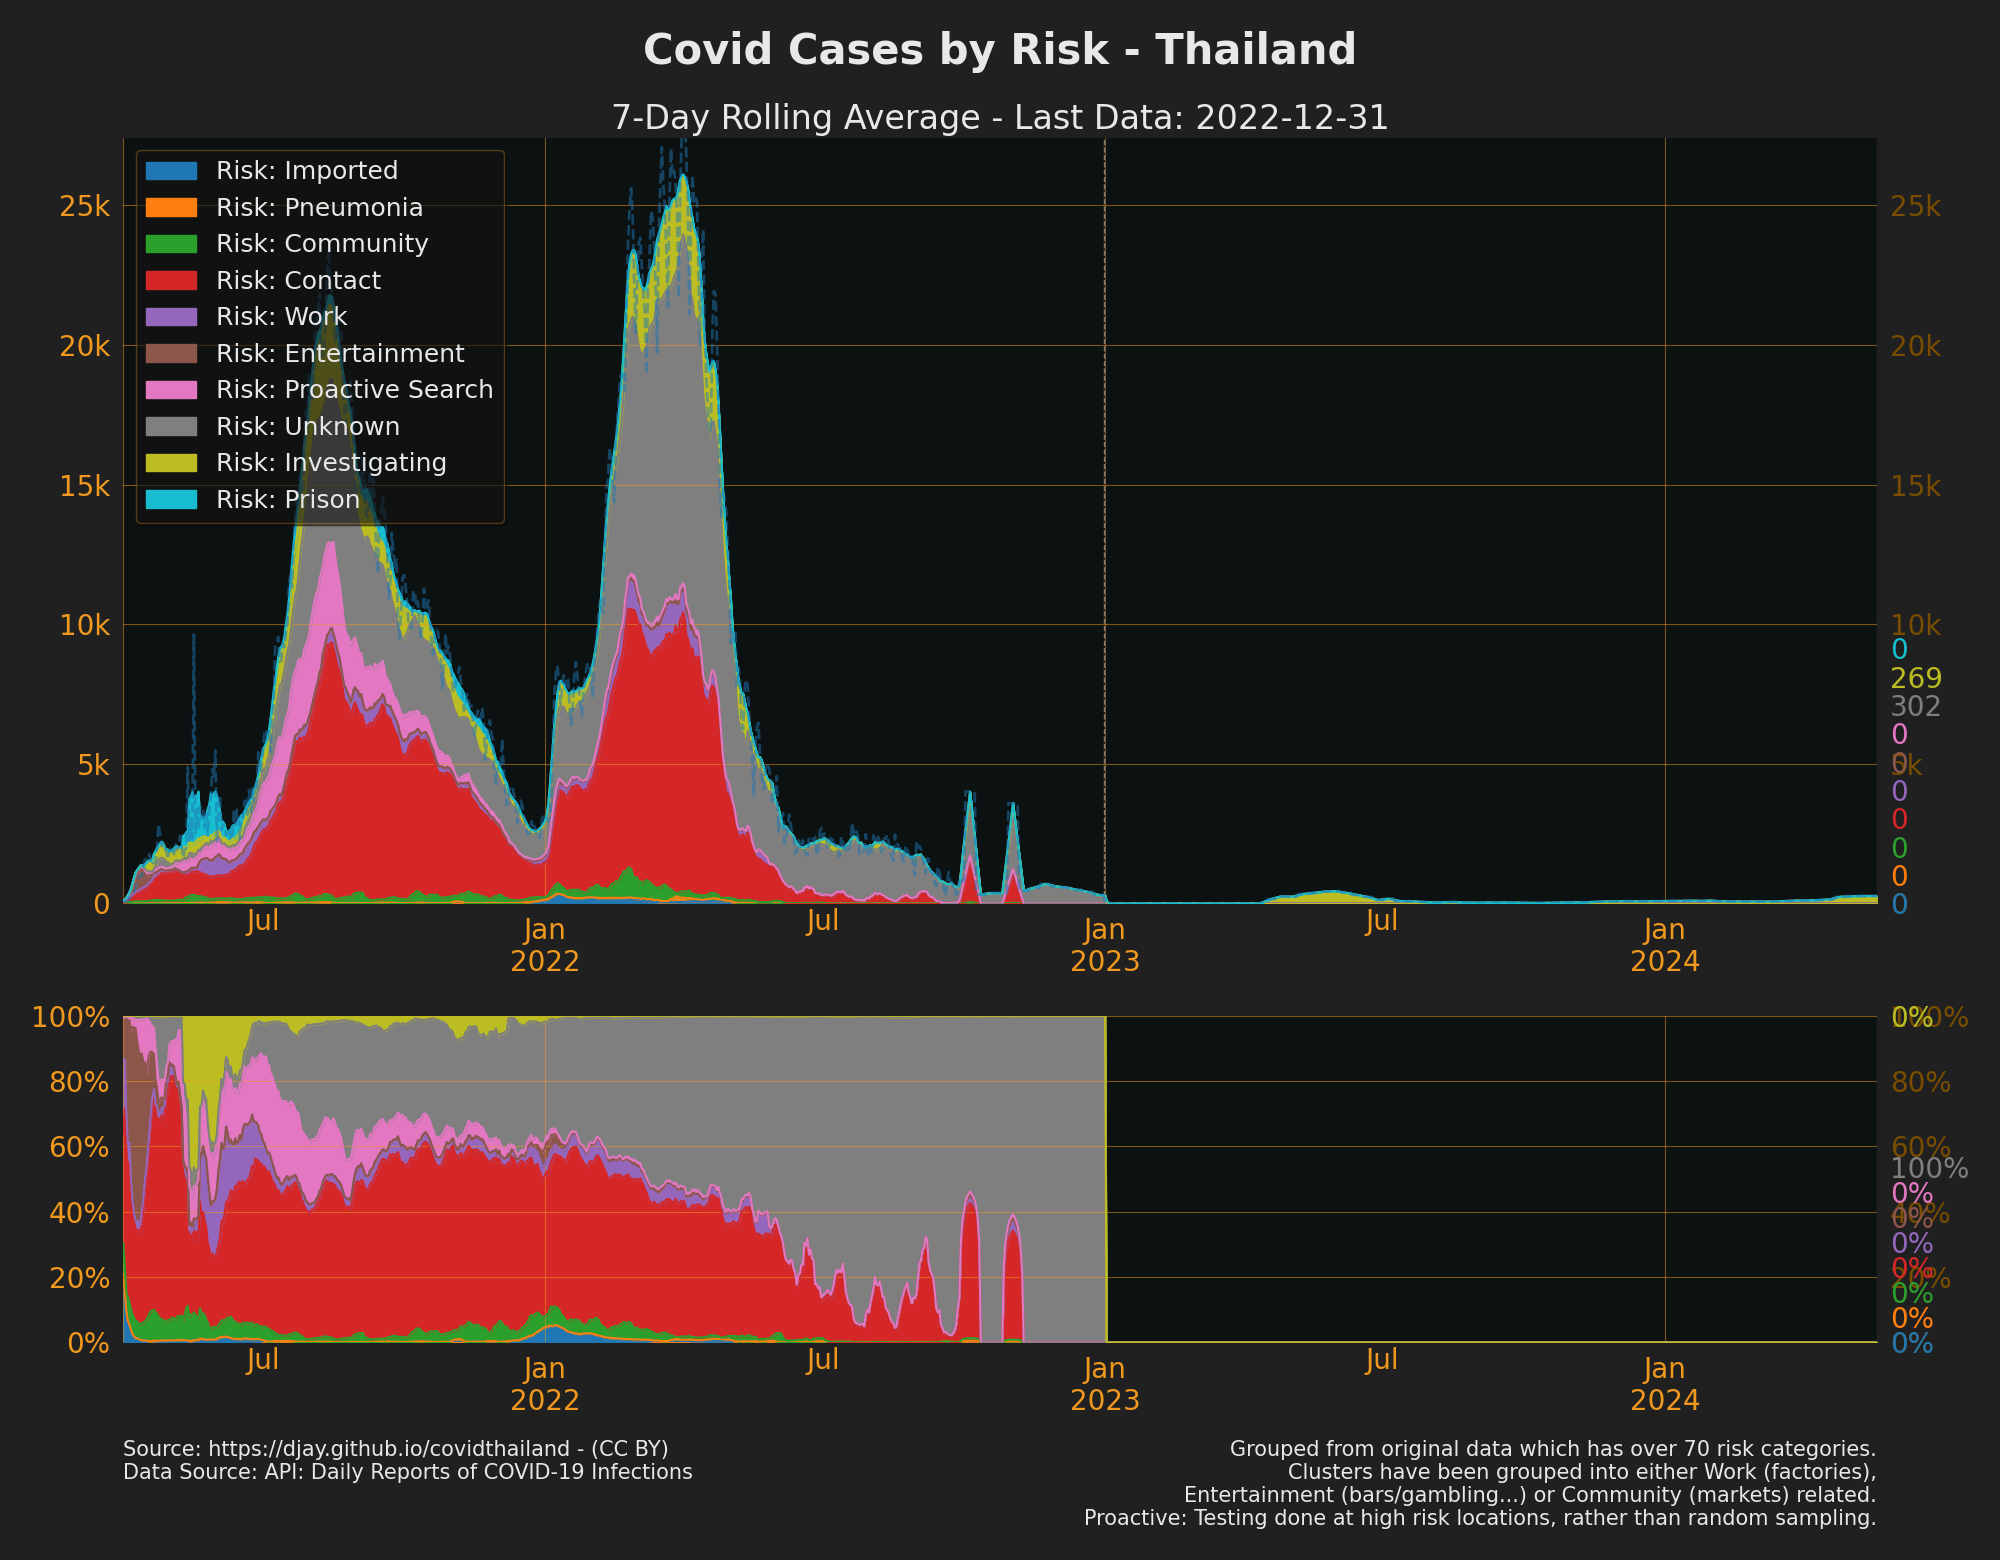
- Grouped from original data using this
[mapping from risk description to 10 classifcation](https://practical-ritchie-cca141.netlify.app/api/risk_groups.csv).
- [Cases by Risk: Full Year](https://practical-ritchie-cca141.netlify.app/outputs/cases_causes_all.png)
- Source: [API: Daily reports of COVID-19 infections](https://data.go.th/dataset/covid-19-daily)
## Cases by Where Tested
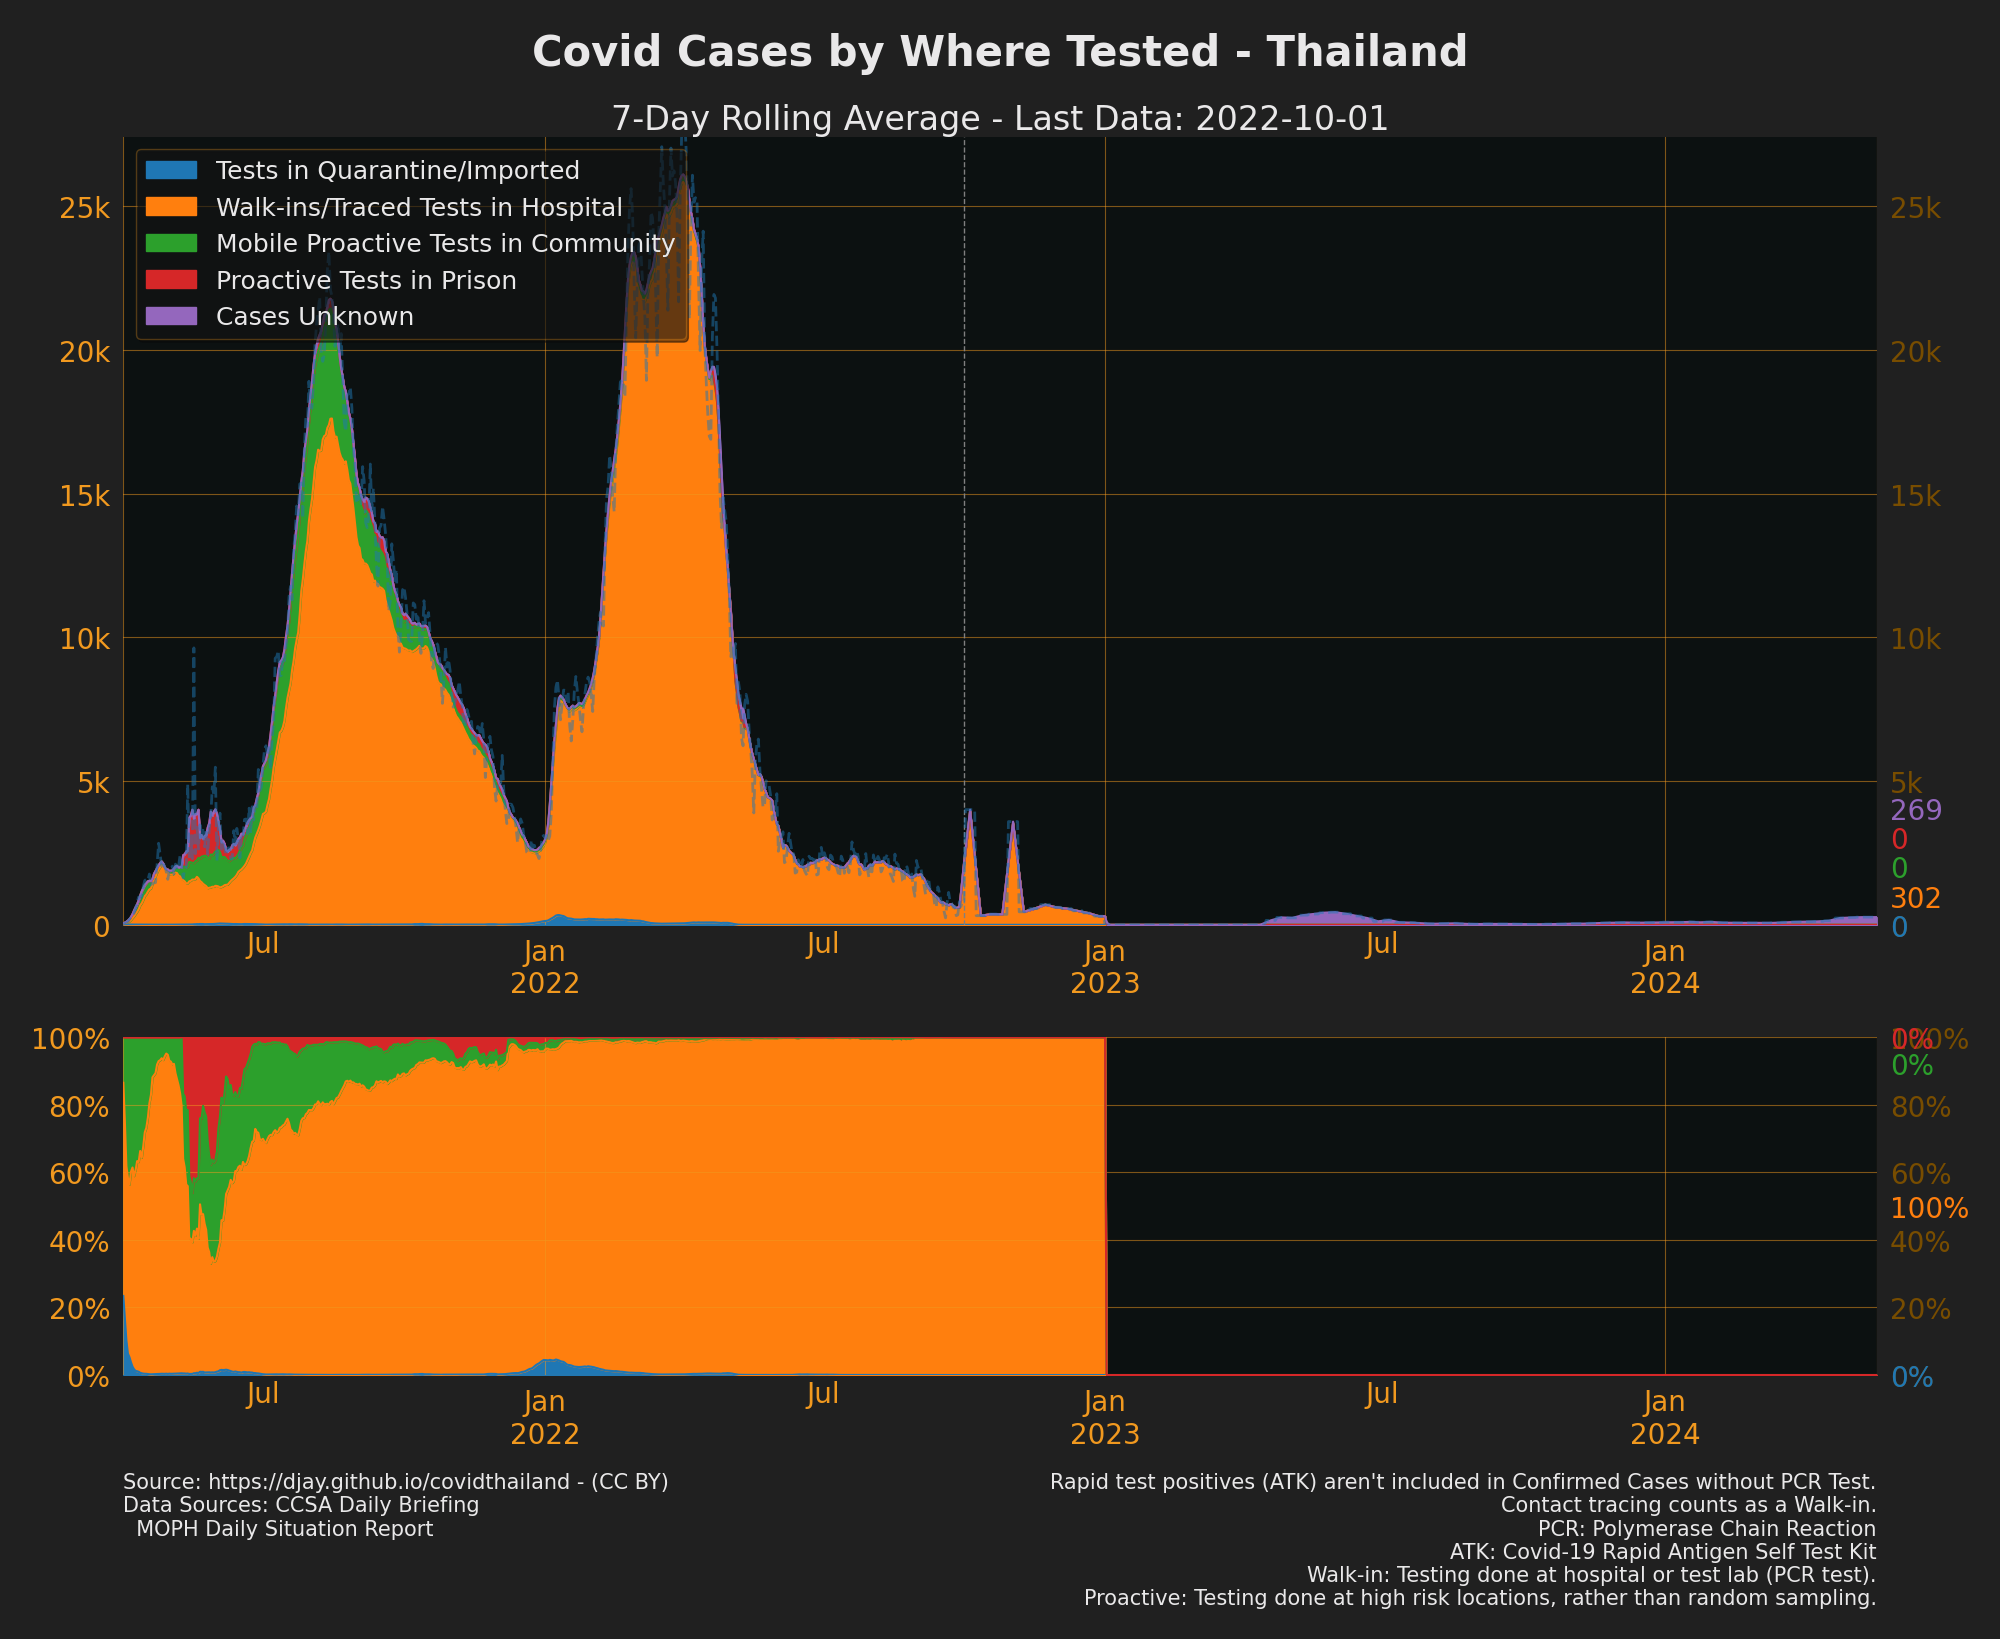
- see also [Provinces with Most Walkin Cases](https://practical-ritchie-cca141.netlify.app/outputs/cases_walkins_increasing_3.png) | [2020-2021](https://practical-ritchie-cca141.netlify.app/outputs/cases_types_all.png)
- Contact tracing normally counts as a "Walk-in"
- Proactive tests are normally done at specific high risk locations or places of known cases, rather than random sampling (but it's possible random sampling may also be included).
- Sources: [CCSA Daily Briefing](downloads.md#dl-briefings),
[MOPH daily situation report](downloads.md#dl-situation-reports)
## Cases by Age
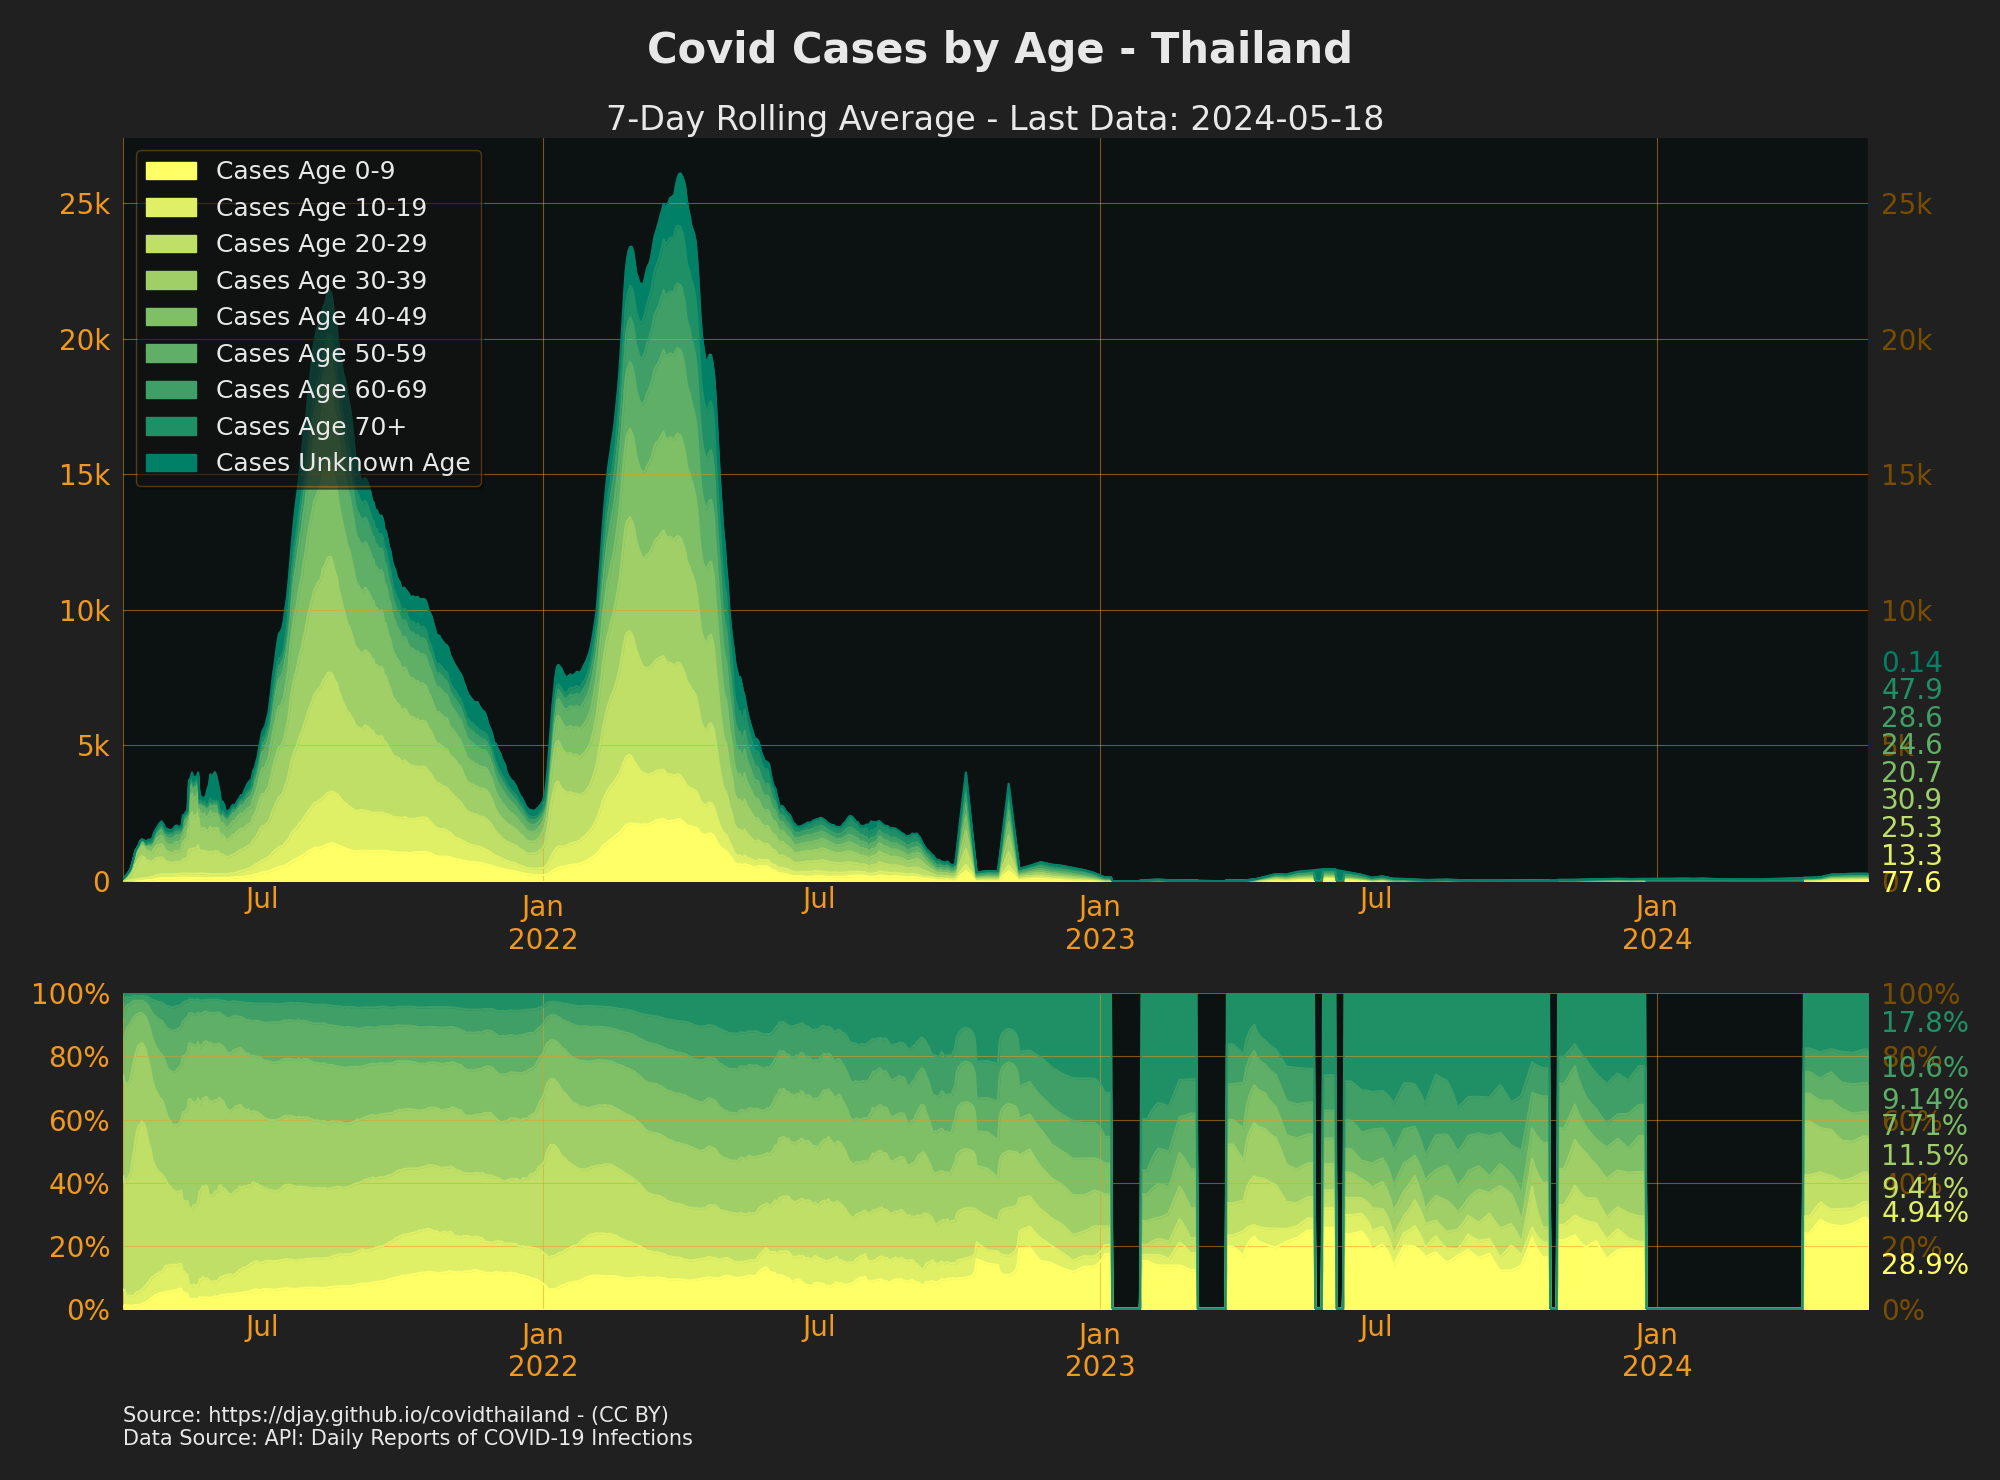
- see [Ages of confirmed cases 2020-2021]((https://practical-ritchie-cca141.netlify.app/outputs/cases_ages_all.png))
- Source: [API: Daily reports of COVID-19 infections](https://data.go.th/dataset/covid-19-daily)
## Cases and Social Distancing

- see also [Cases and people movement from April 2021]((https://practical-ritchie-cca141.netlify.app/outputs/mobility_3.png))
- Mobility (based on mobile phone data) estimates are from IHME dataset. The data is transformed and scaled to show relative social distancing (reduced mobility) compared to peak.
- The chart then shows how reduced mobility and number of new cases progresses in time.
- Source: [IHME COVID estimates](http://www.healthdata.org/covid/data-downloads)
## Cases in Non-Thai
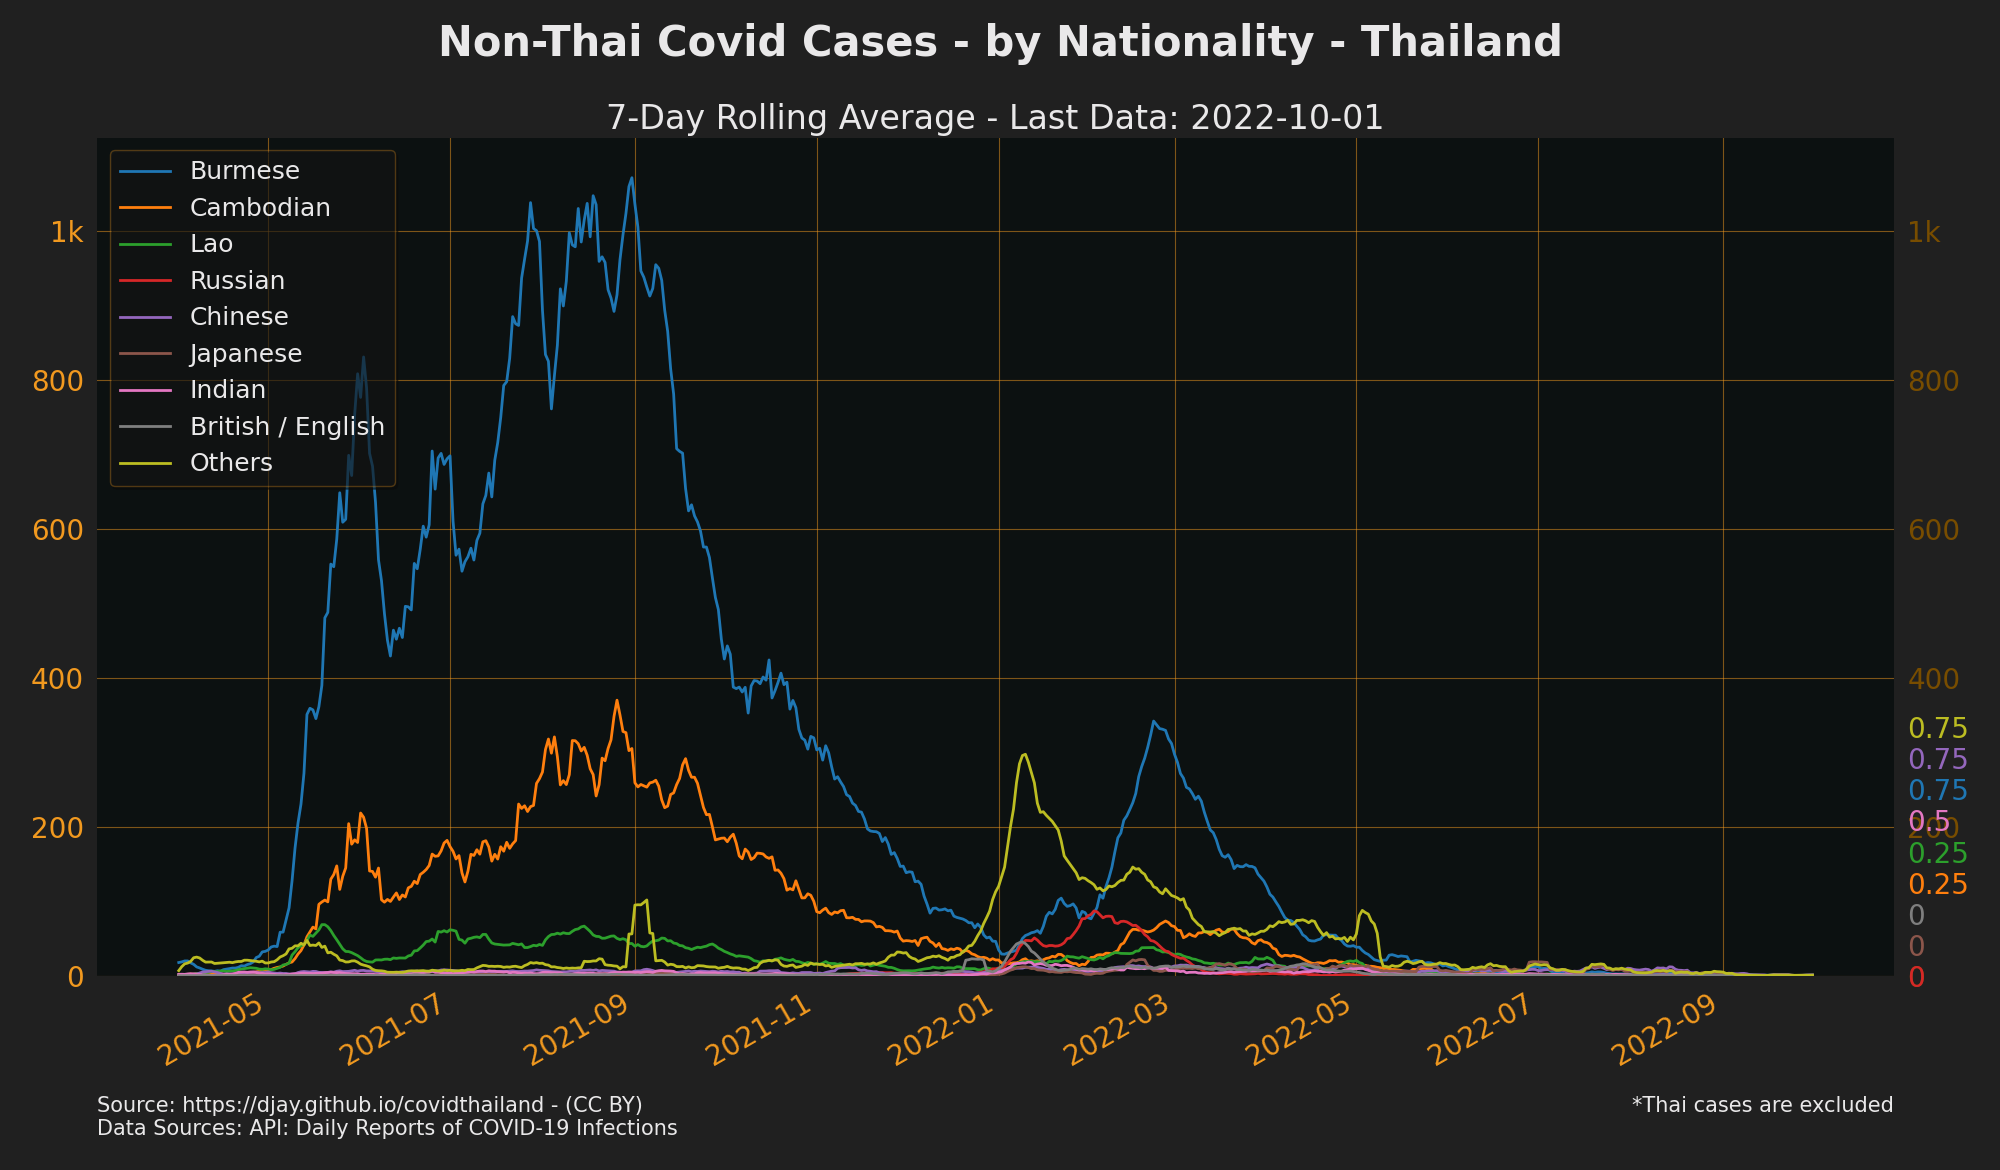
- Source: [API: Daily reports of COVID-19 infections](https://data.go.th/dataset/covid-19-daily)
## Case Fatality Rate
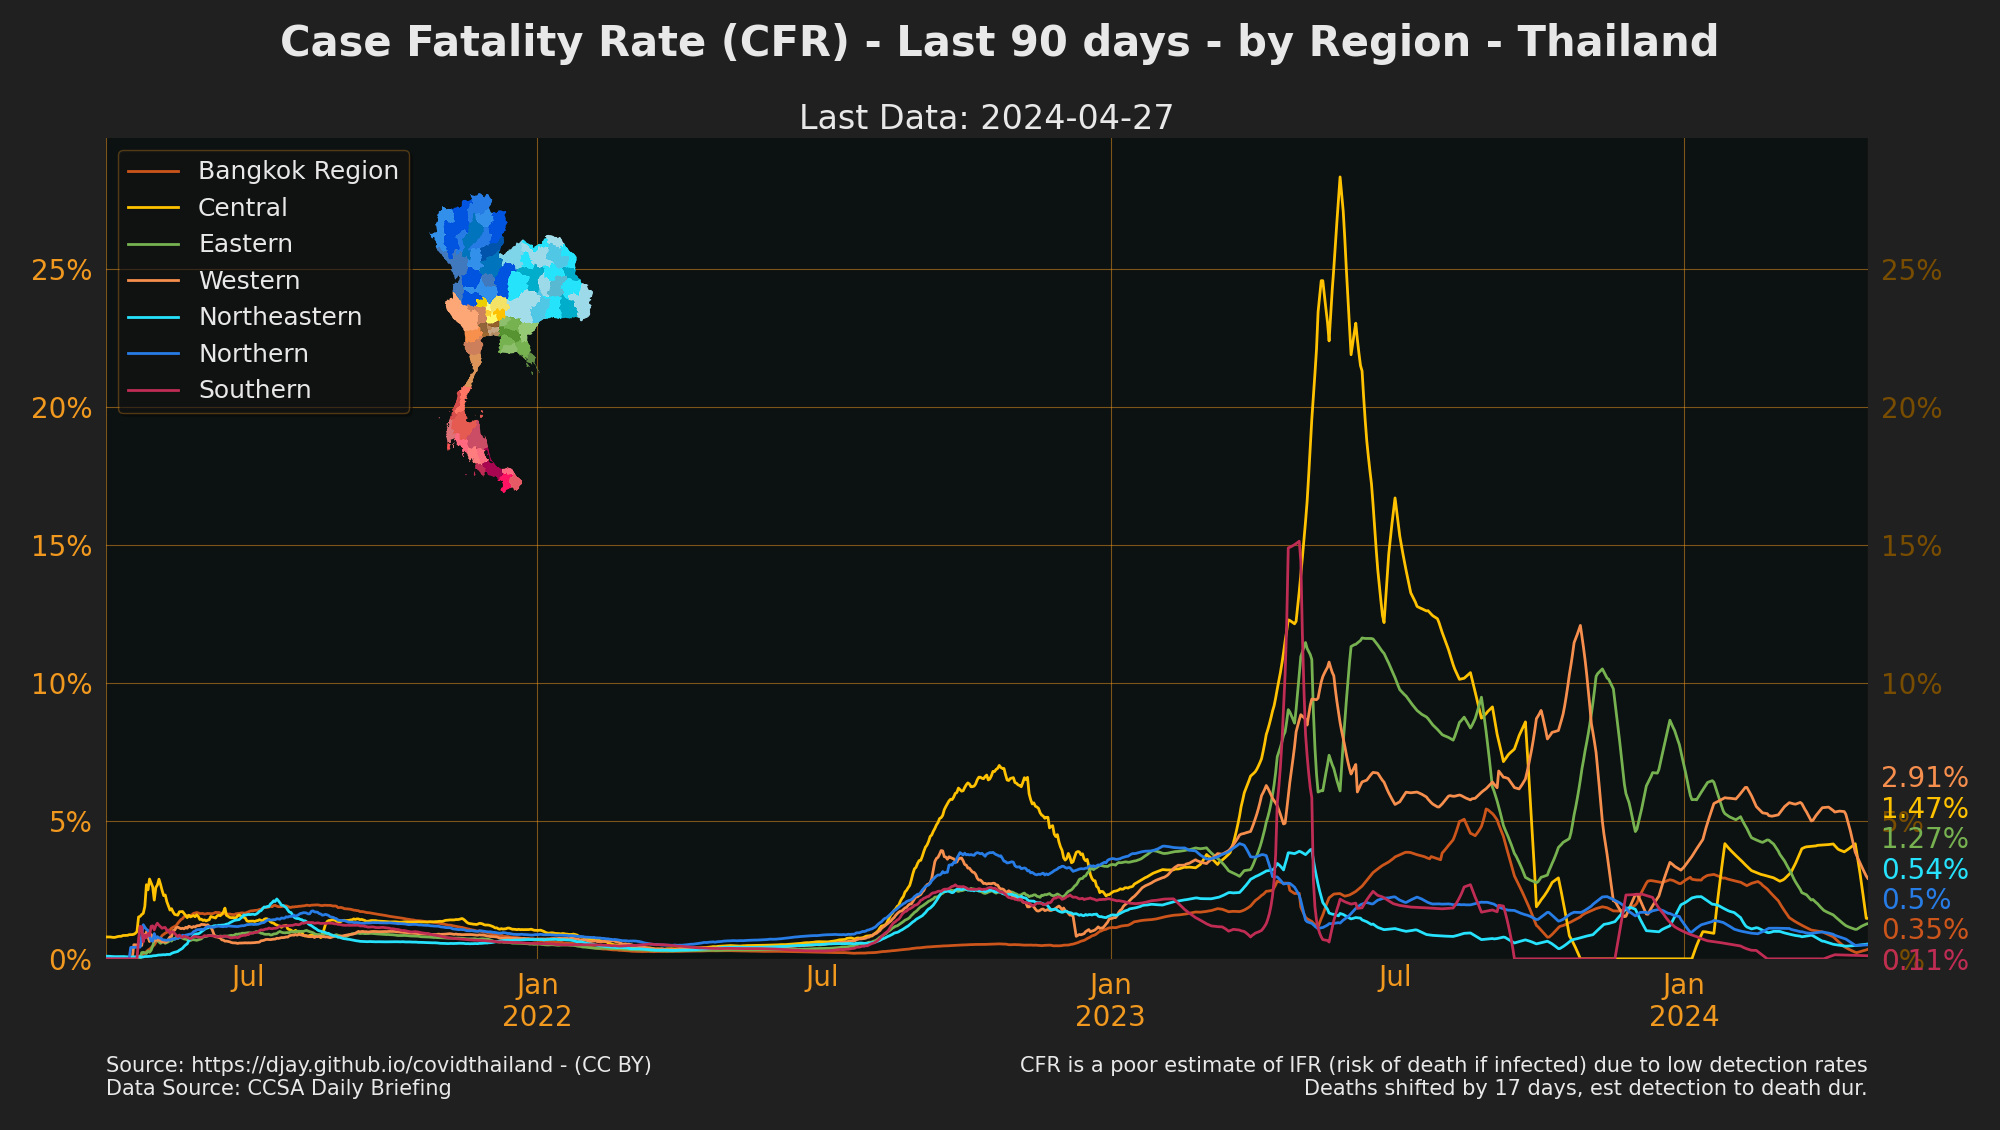
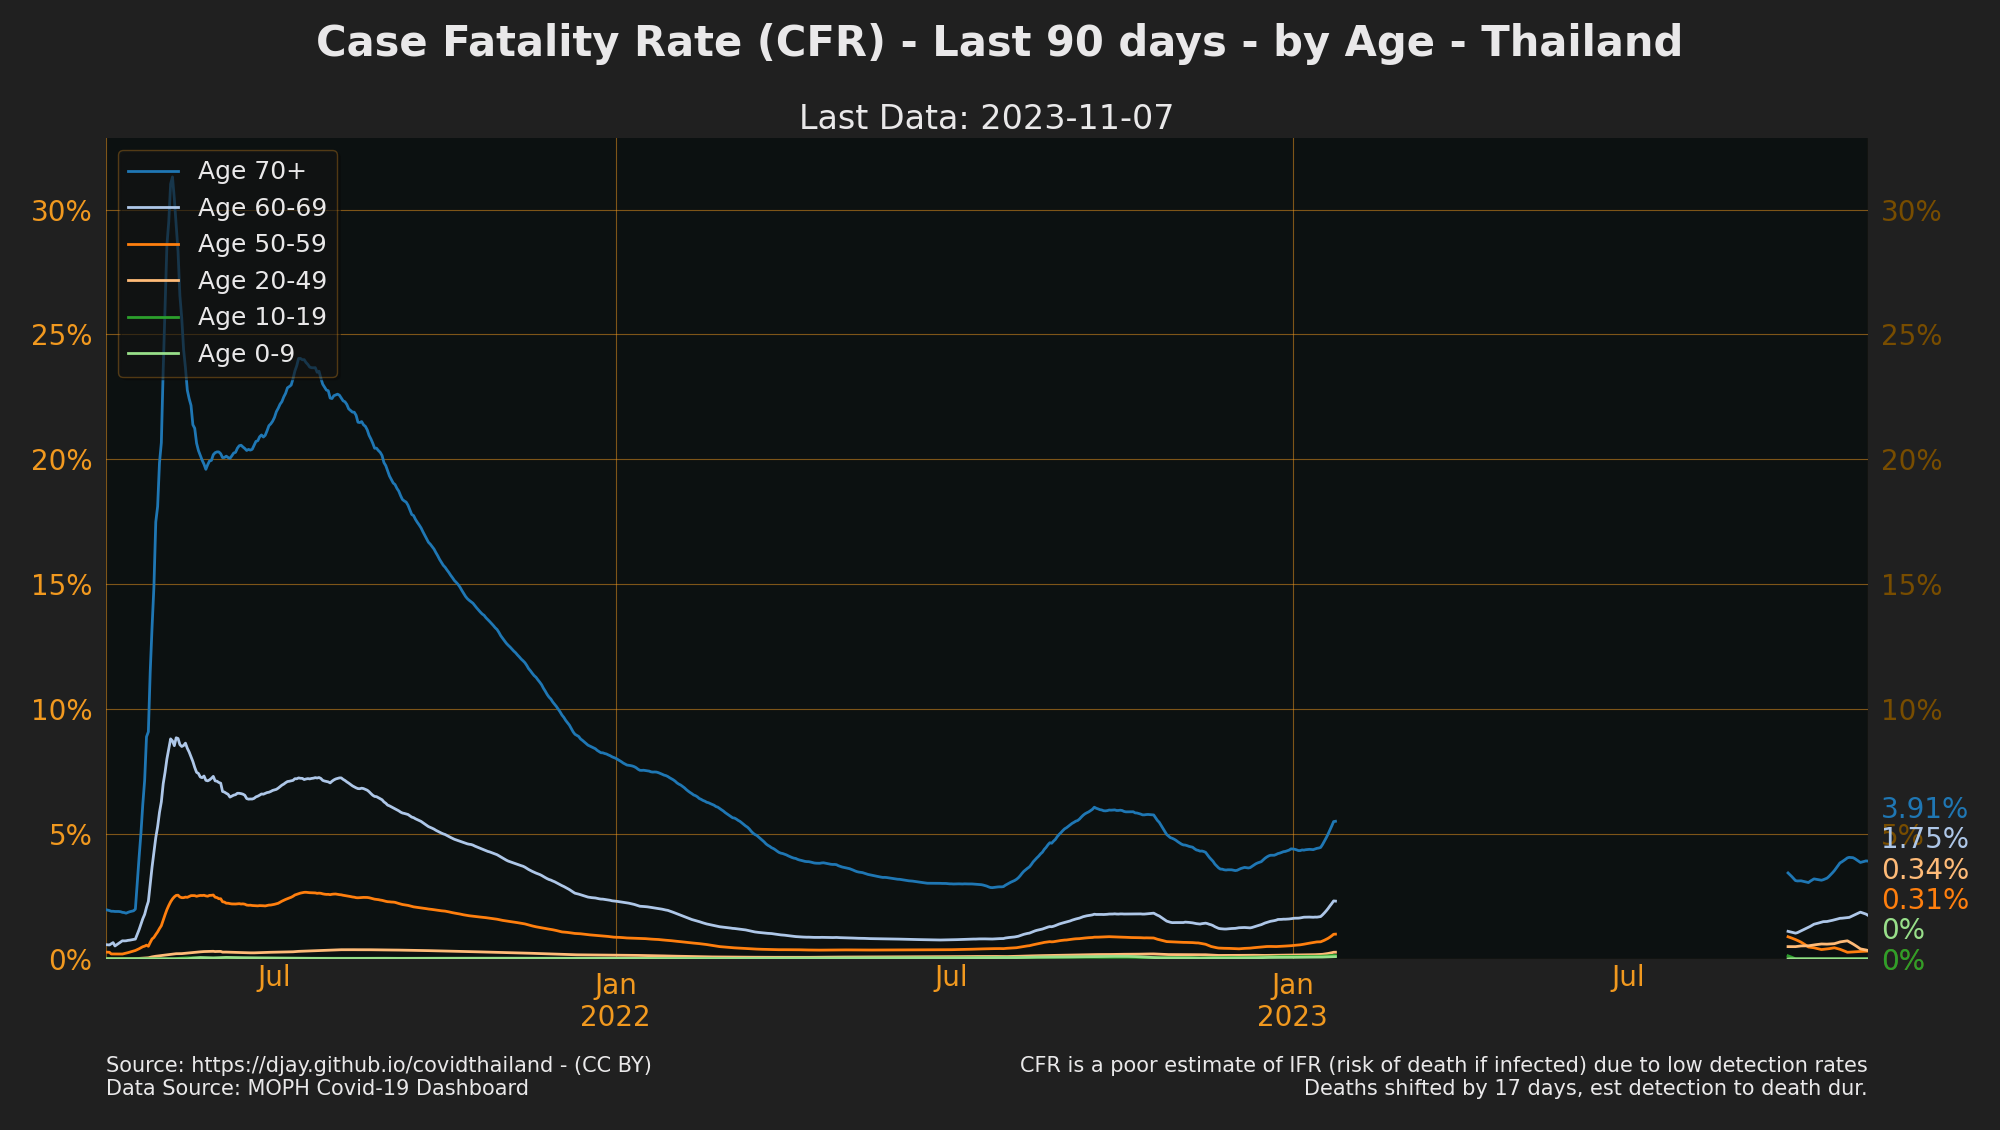
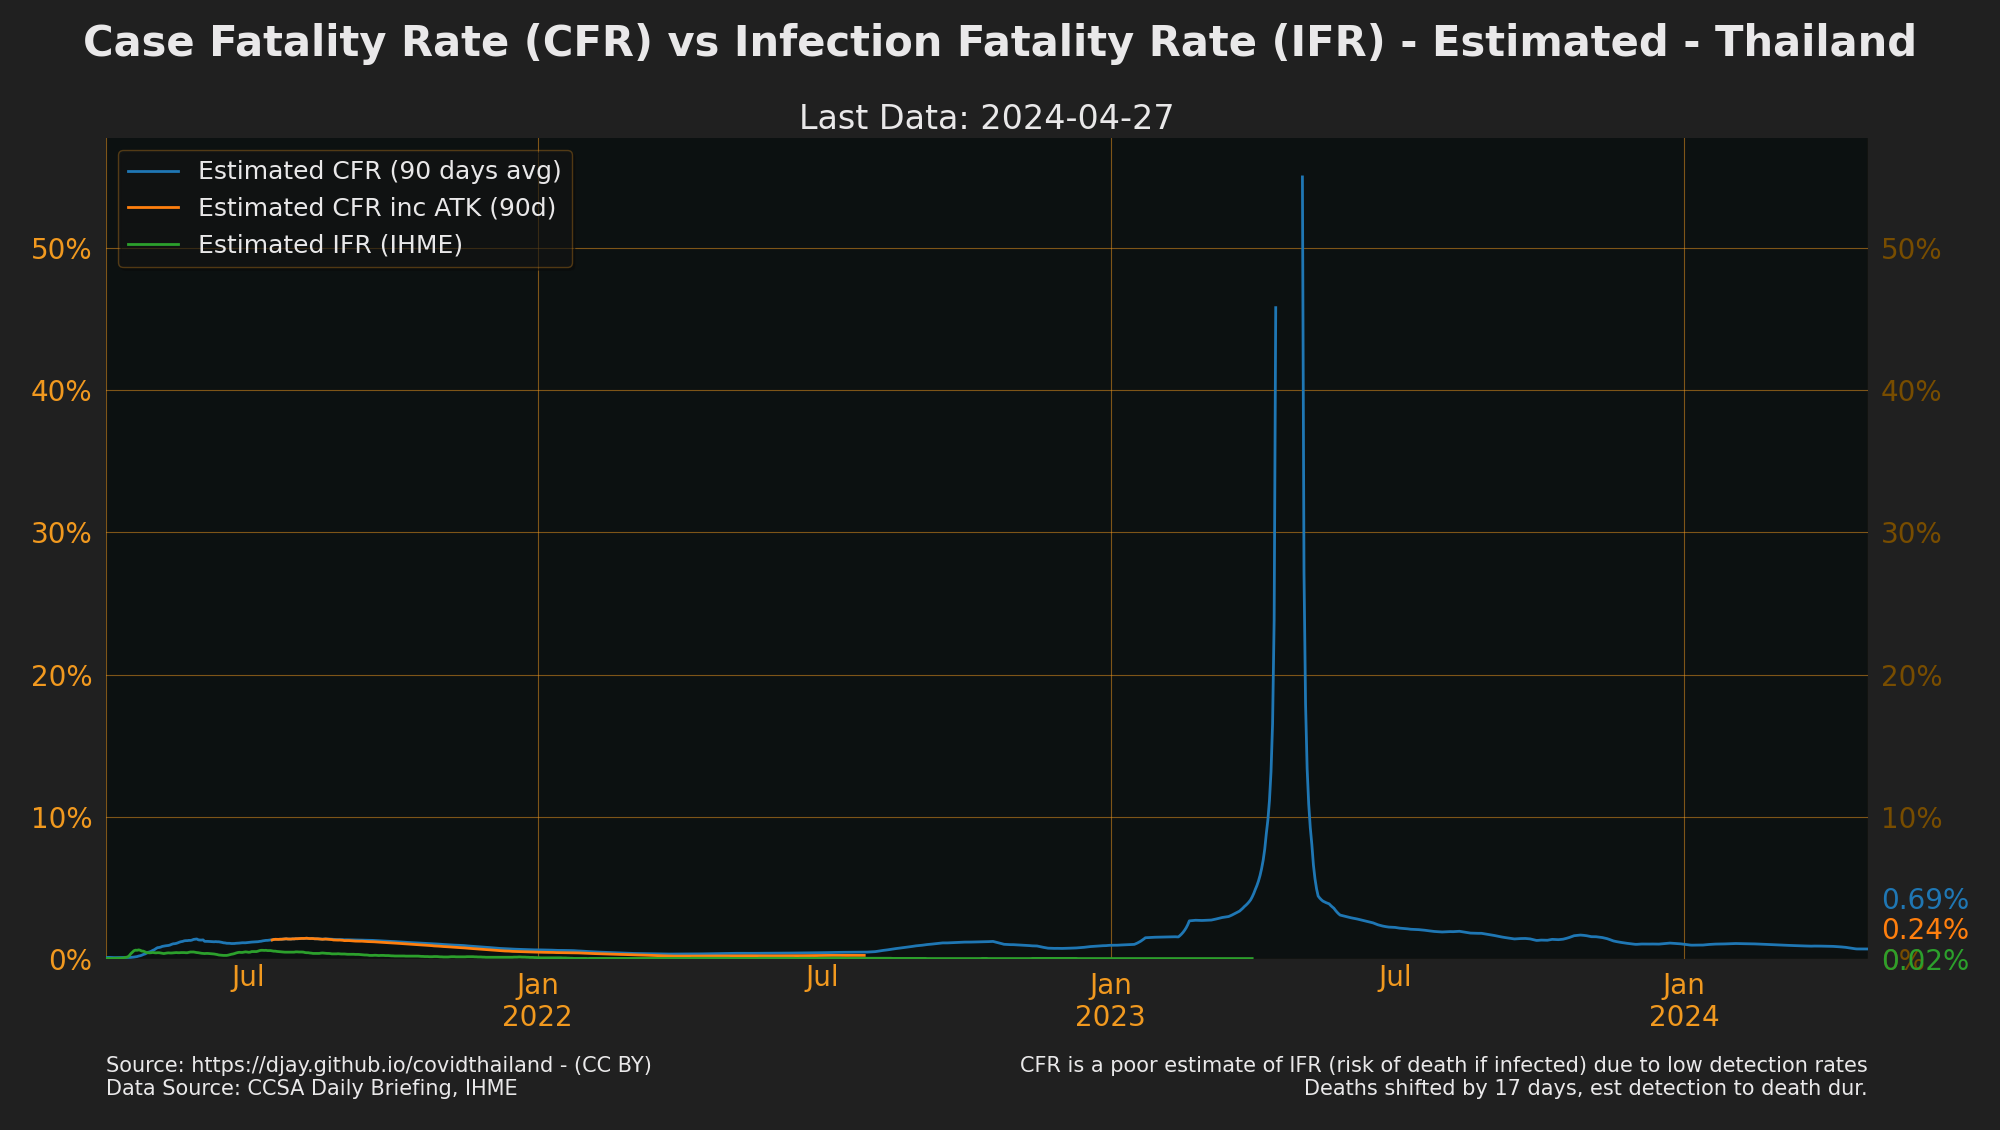
- To show more recent trends last 90 days is used instead of total deaths / total cases which is normally used.
- [CFR is not the IFR (Infection Fatality Rate) so doesn't tell the chance of dying if infected](https://ourworldindata.org/mortality-risk-covid#understanding-the-case-fatality-crude-mortality-and-the-infection-fatality-rate)
- Detection rate of cases & deaths can change CFR a lot. Deaths shifted by med. time till to death in Thailand (17d) however this number is likely shorter before vaccinations and longer after vaccinations and newer treatments.
- IFR is estimated by IHME based on their modelling which factors in excess deaths, detection rate, immunity and other factors.
- Source: [CCSA Daily Briefing](downloads.md#dl-briefings)
- Source: [IHME COVID estimates](http://www.healthdata.org/covid/data-downloads)
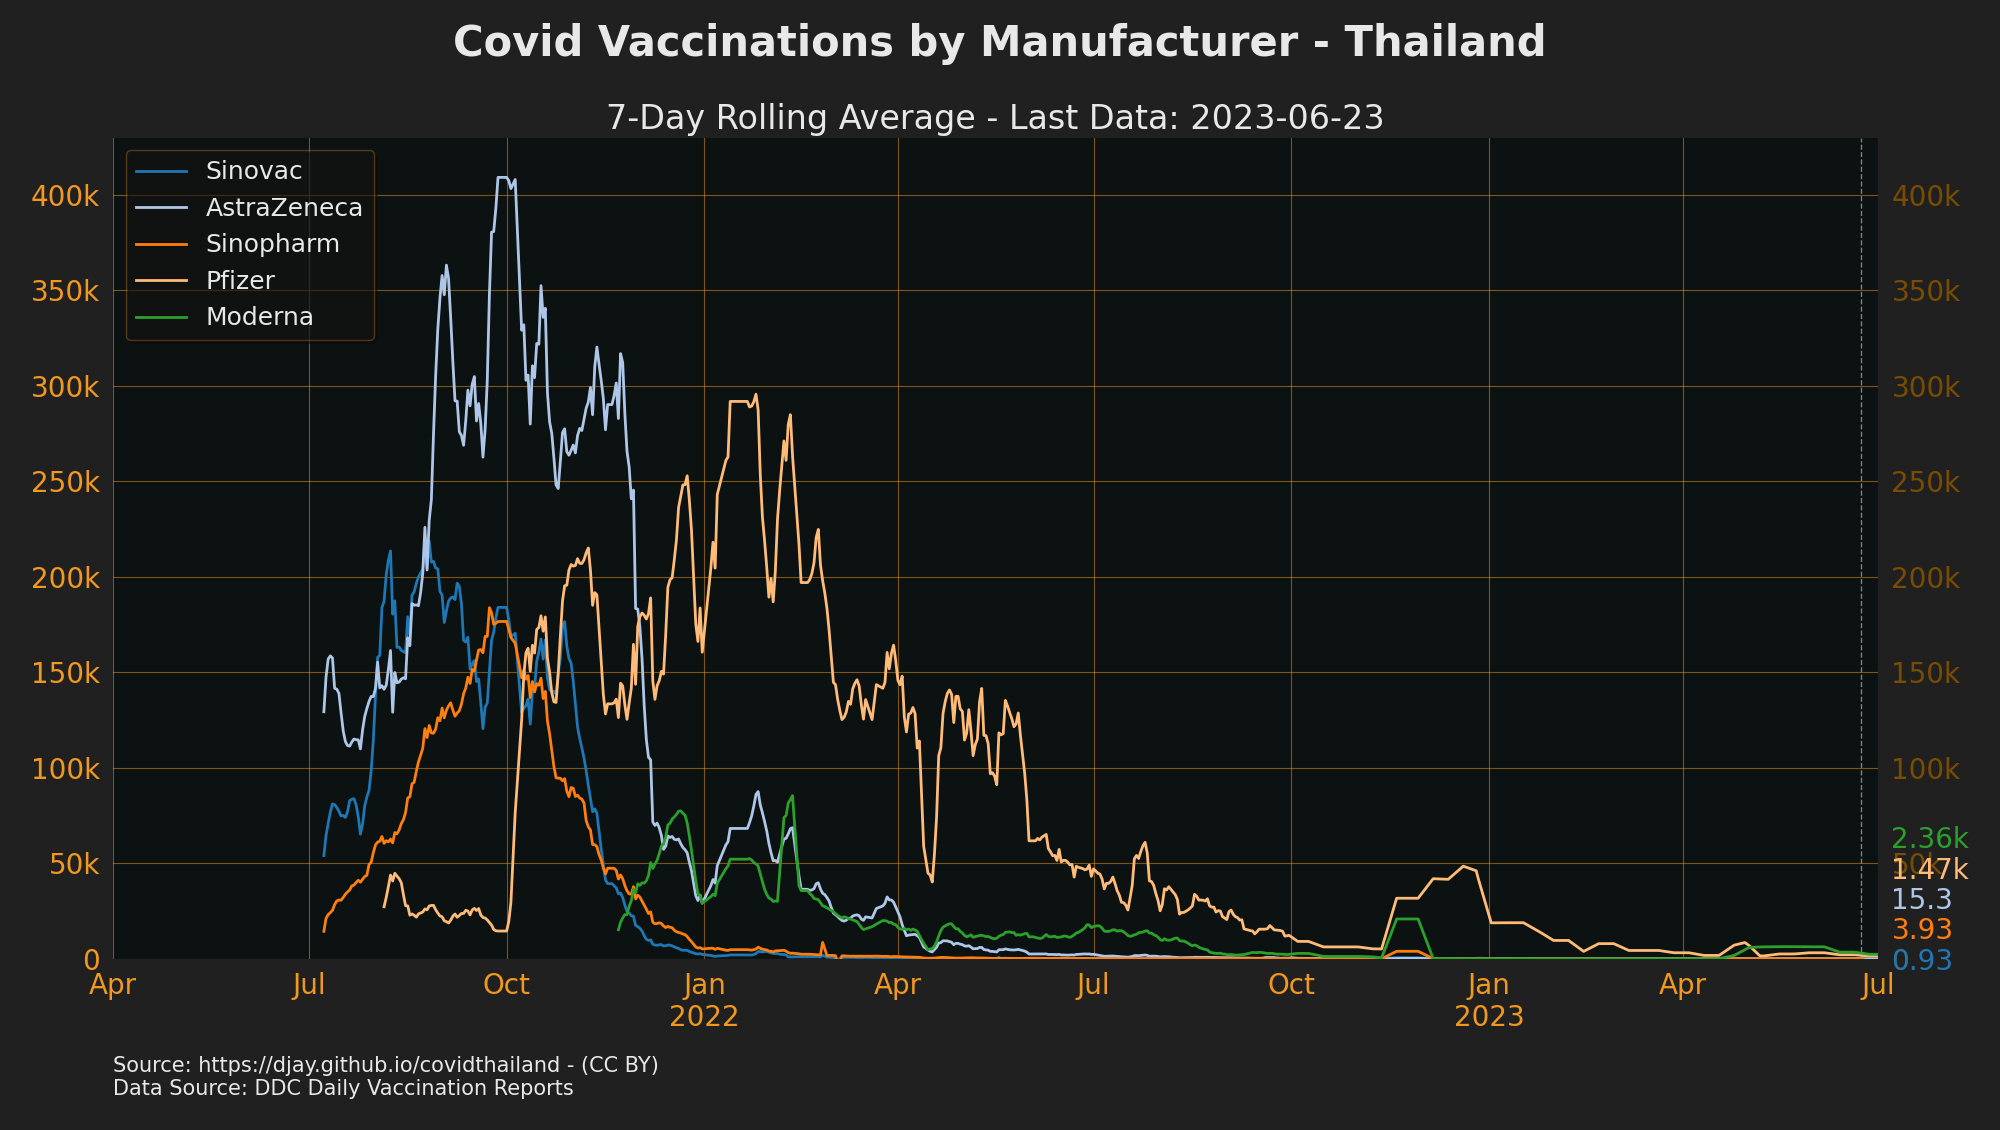
## Vaccinations by Manufacturer
## Vaccinations by Priority Groups
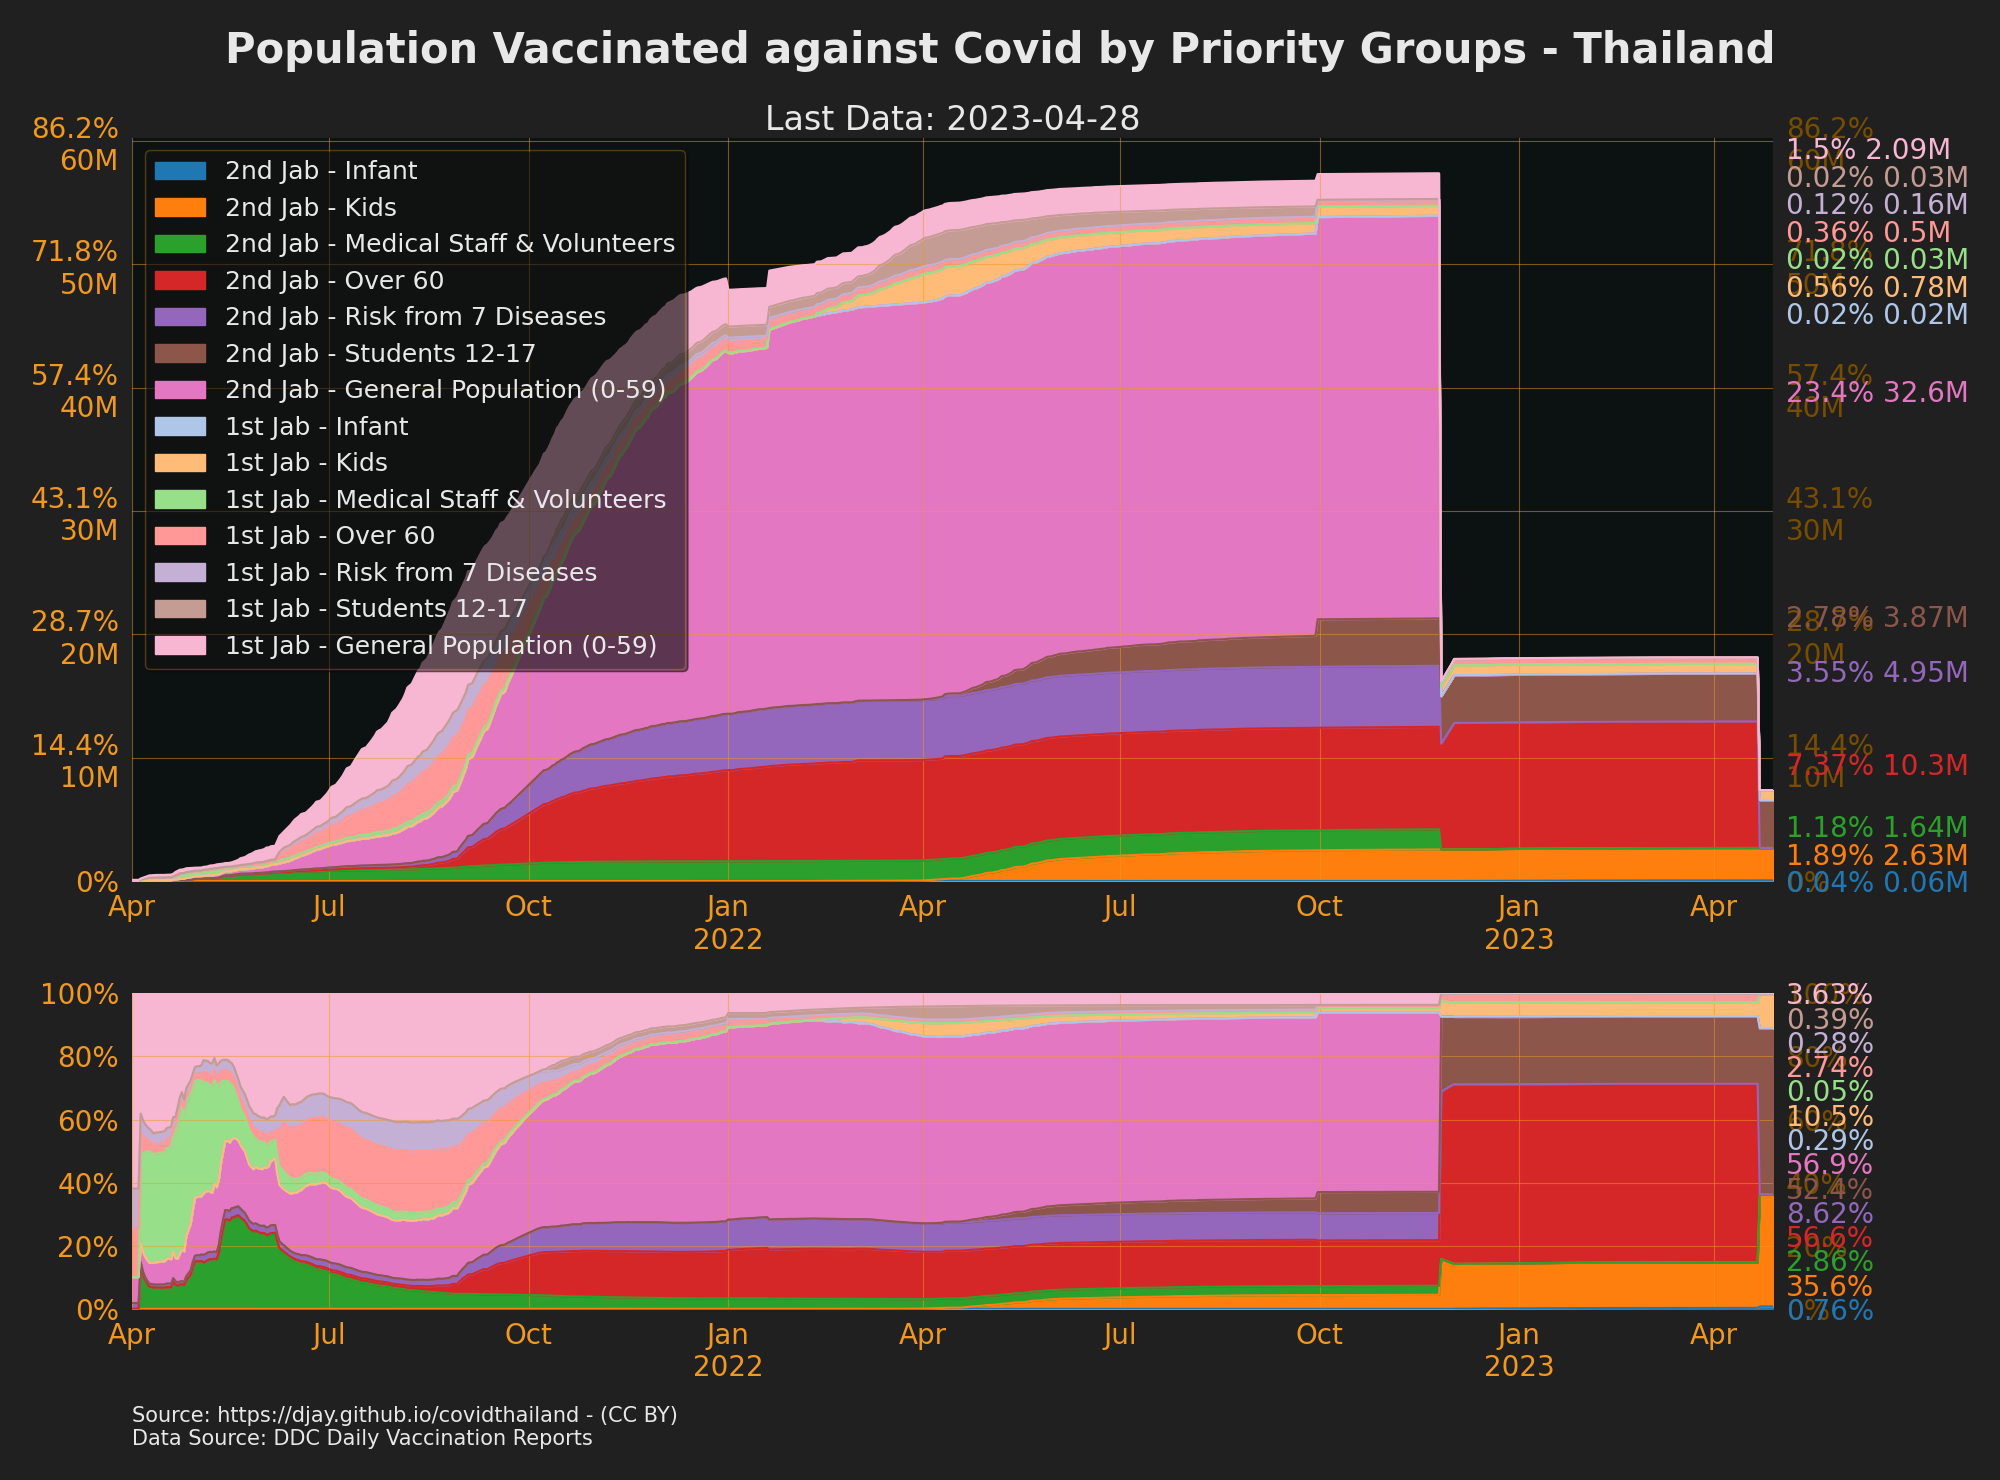
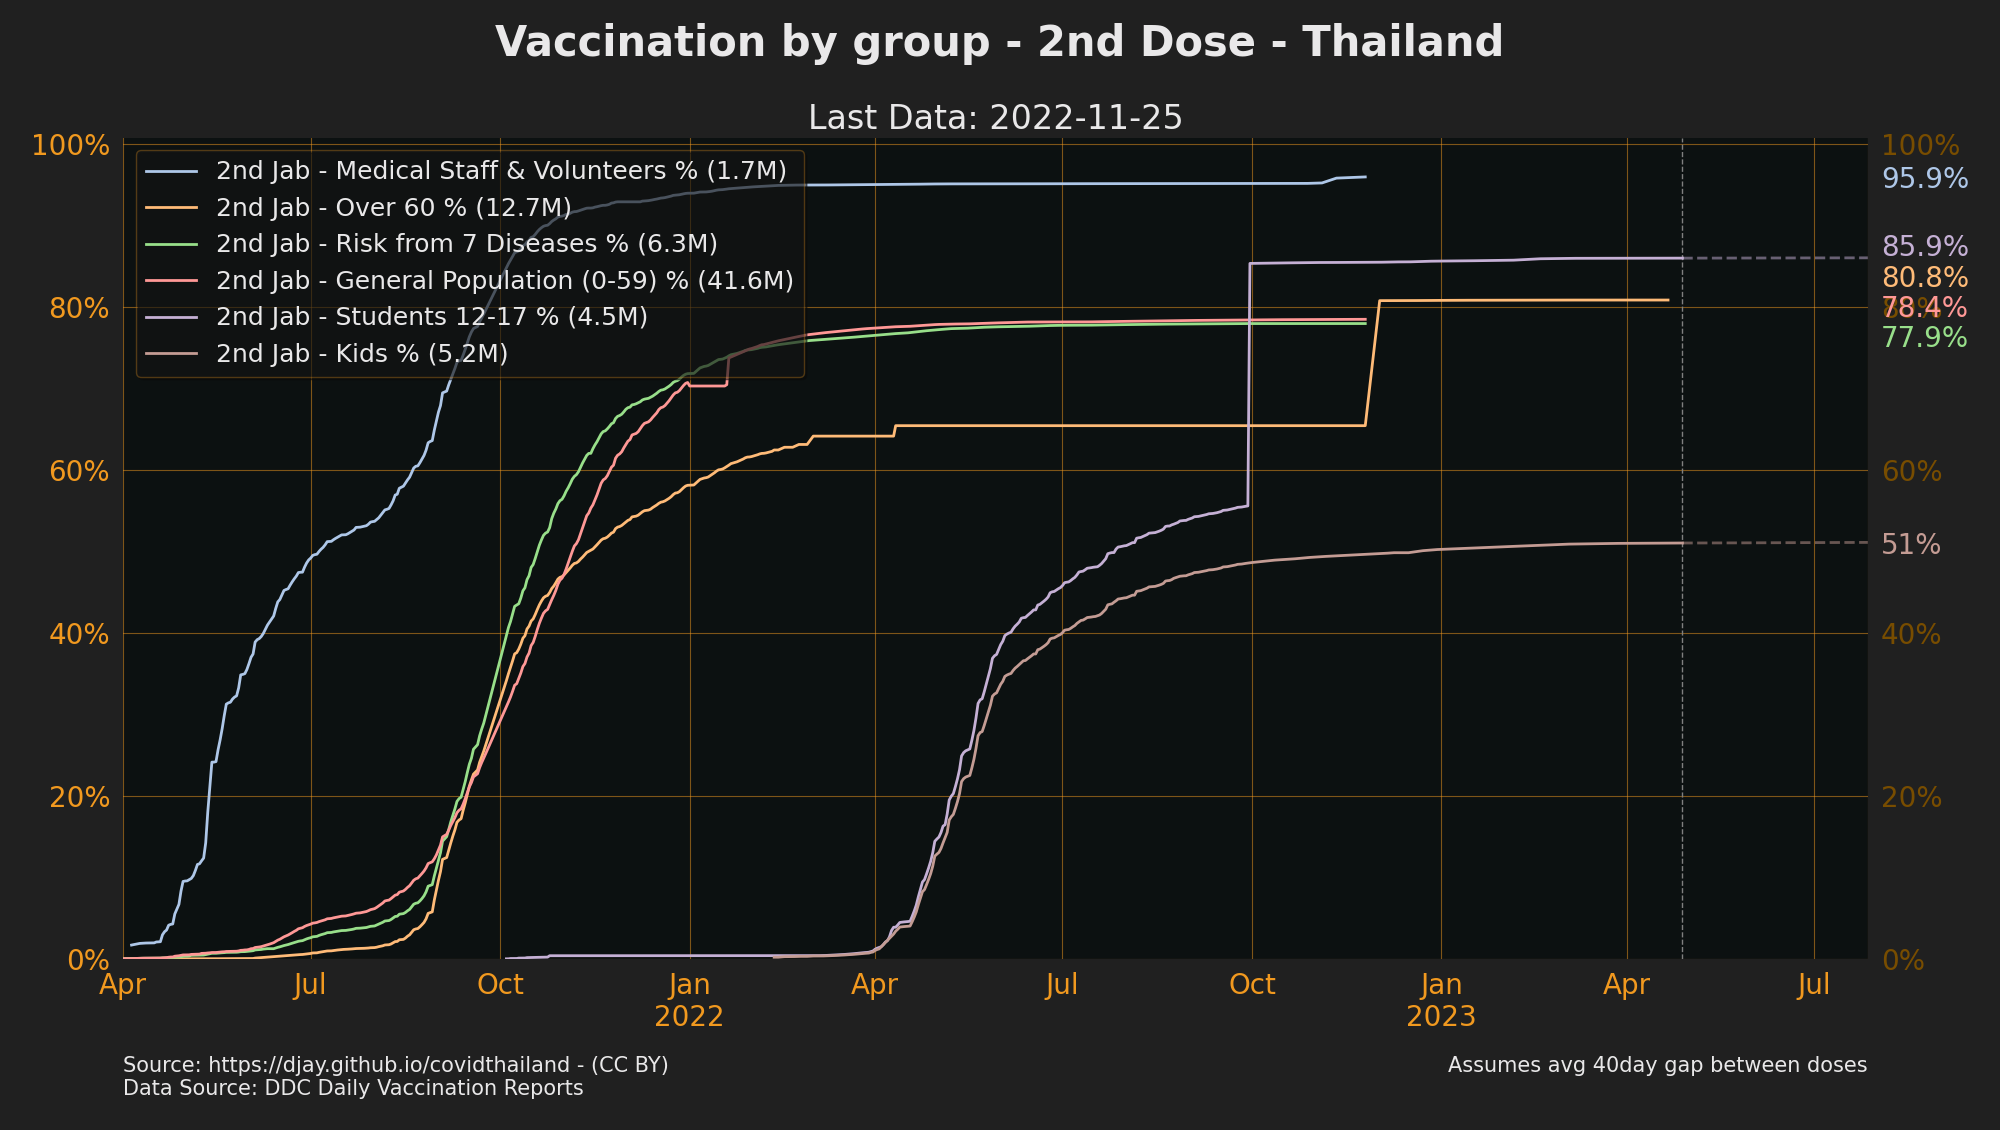
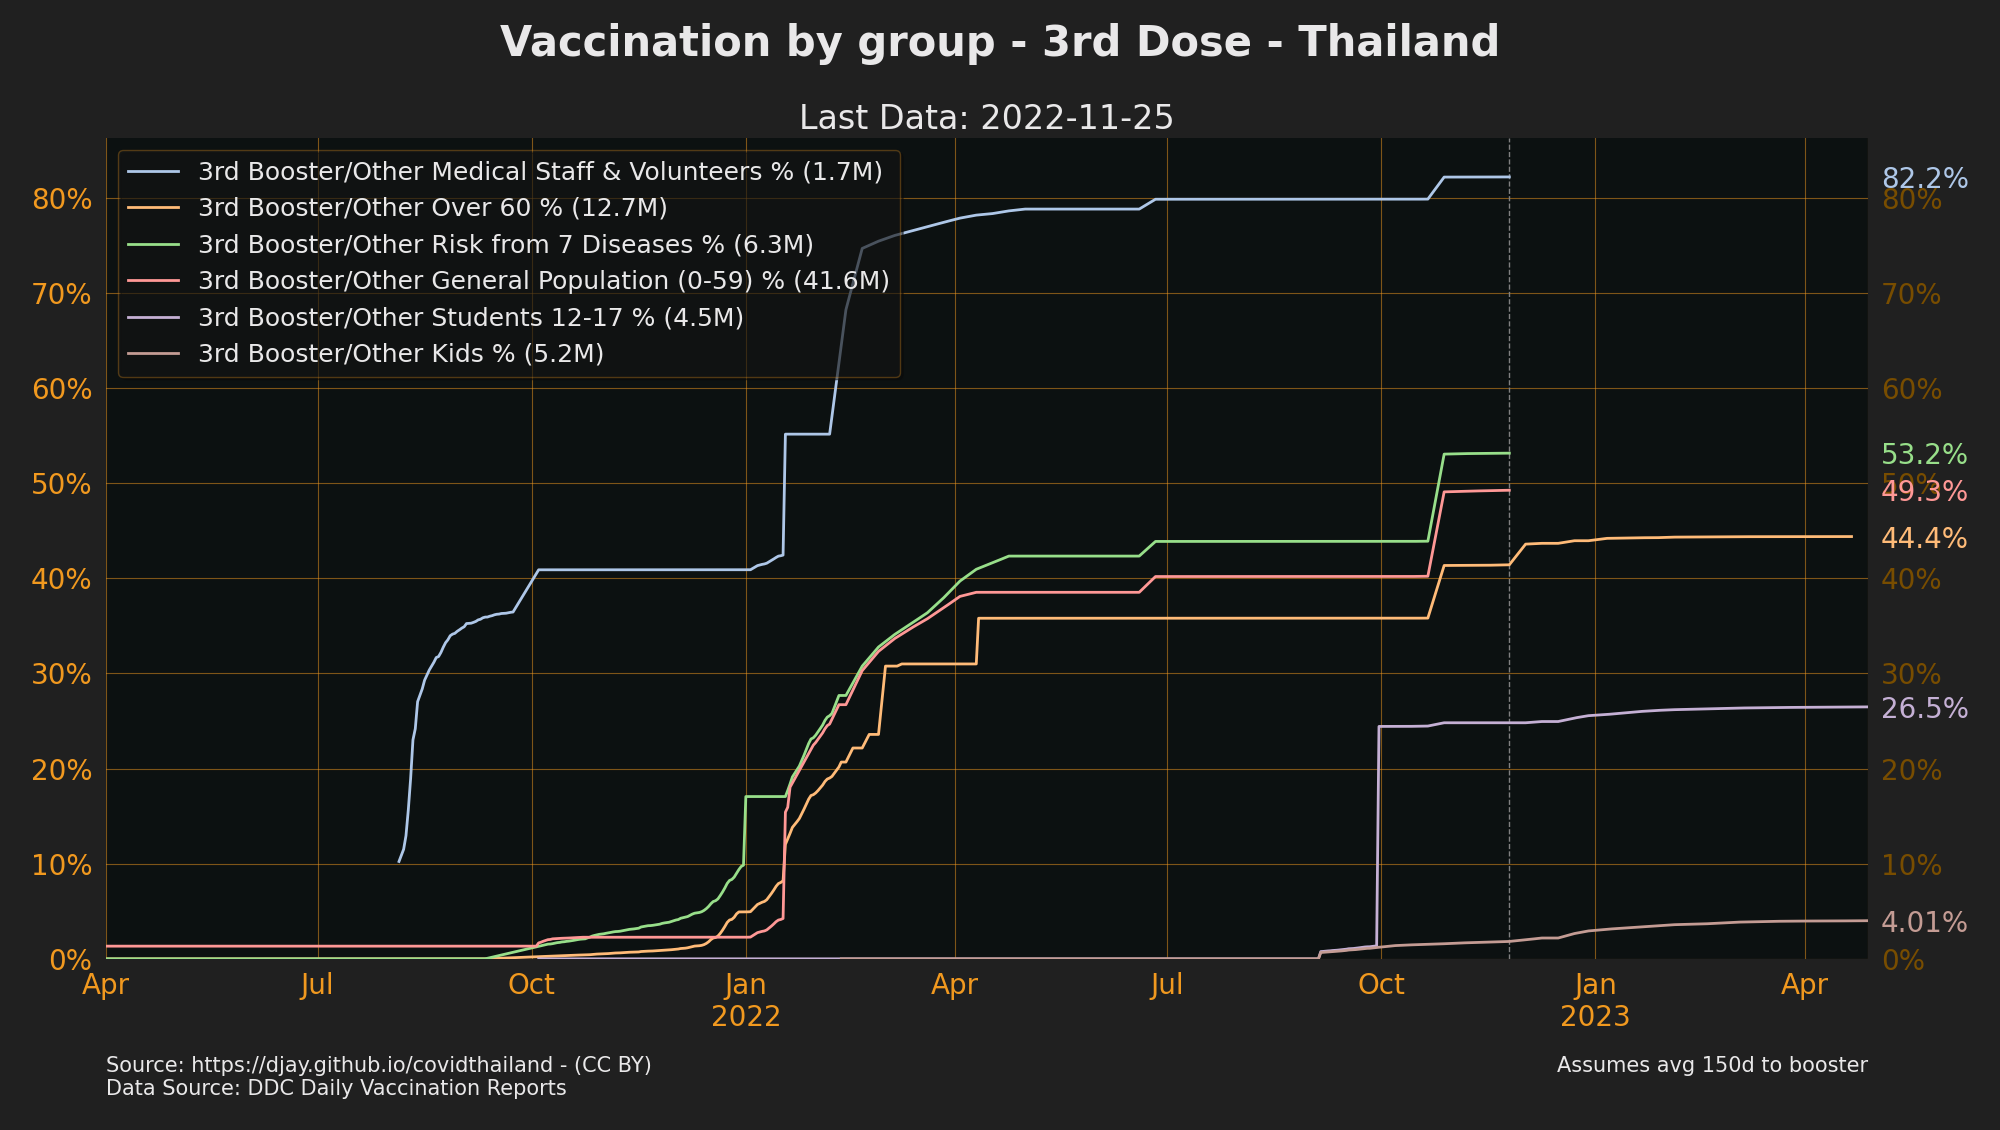
- Source: [DDC Daily Vaccination Reports](downloads.md#dl-vac)
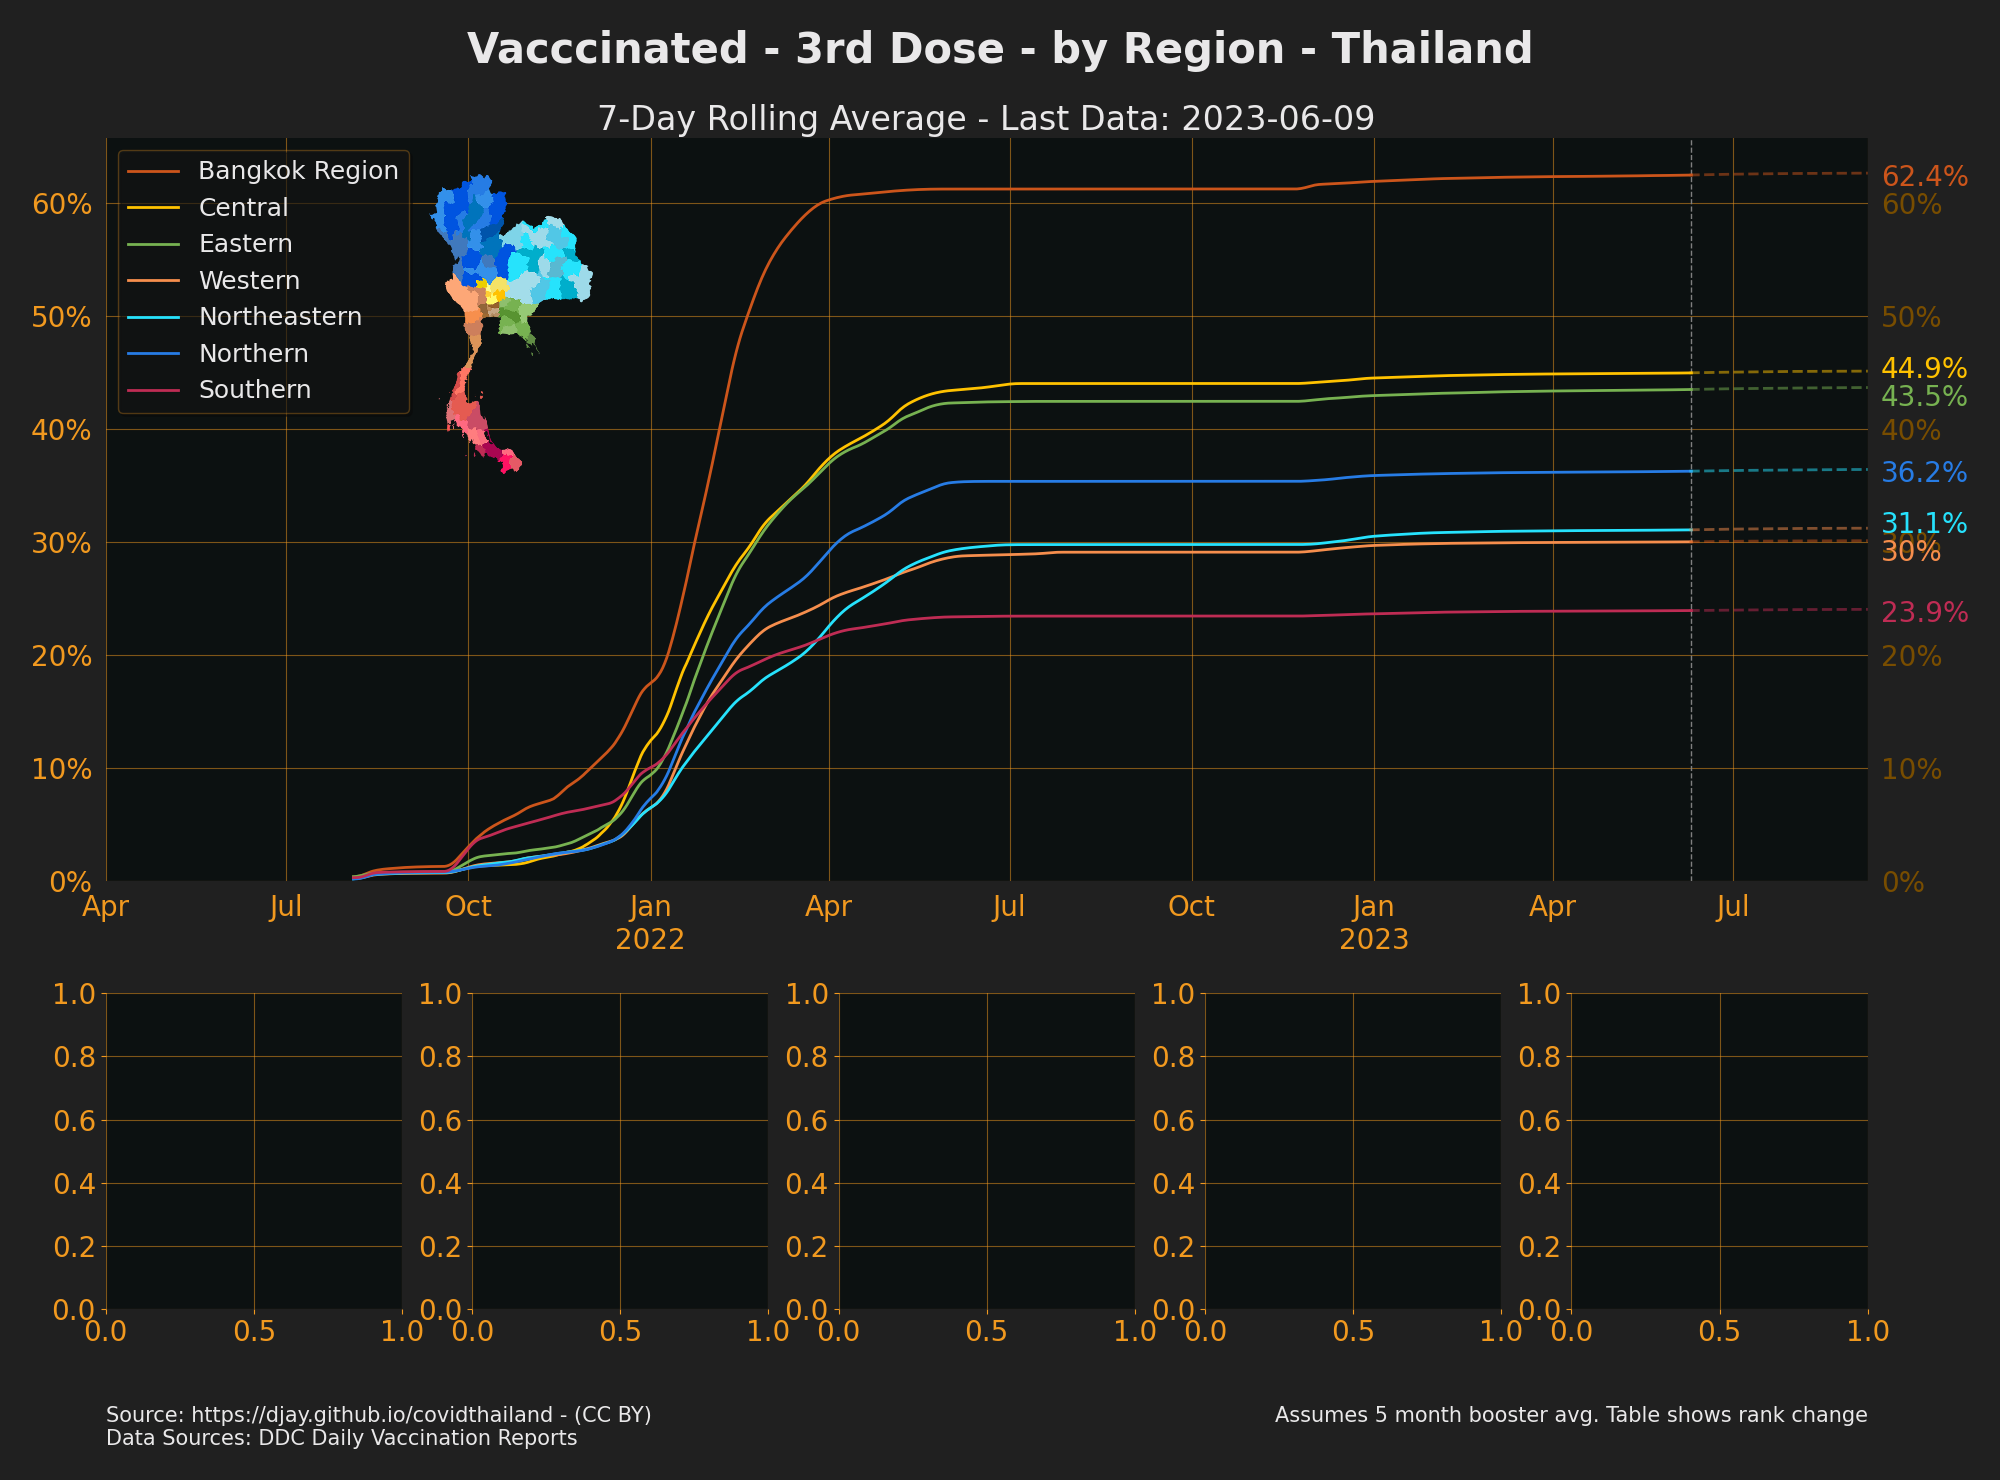
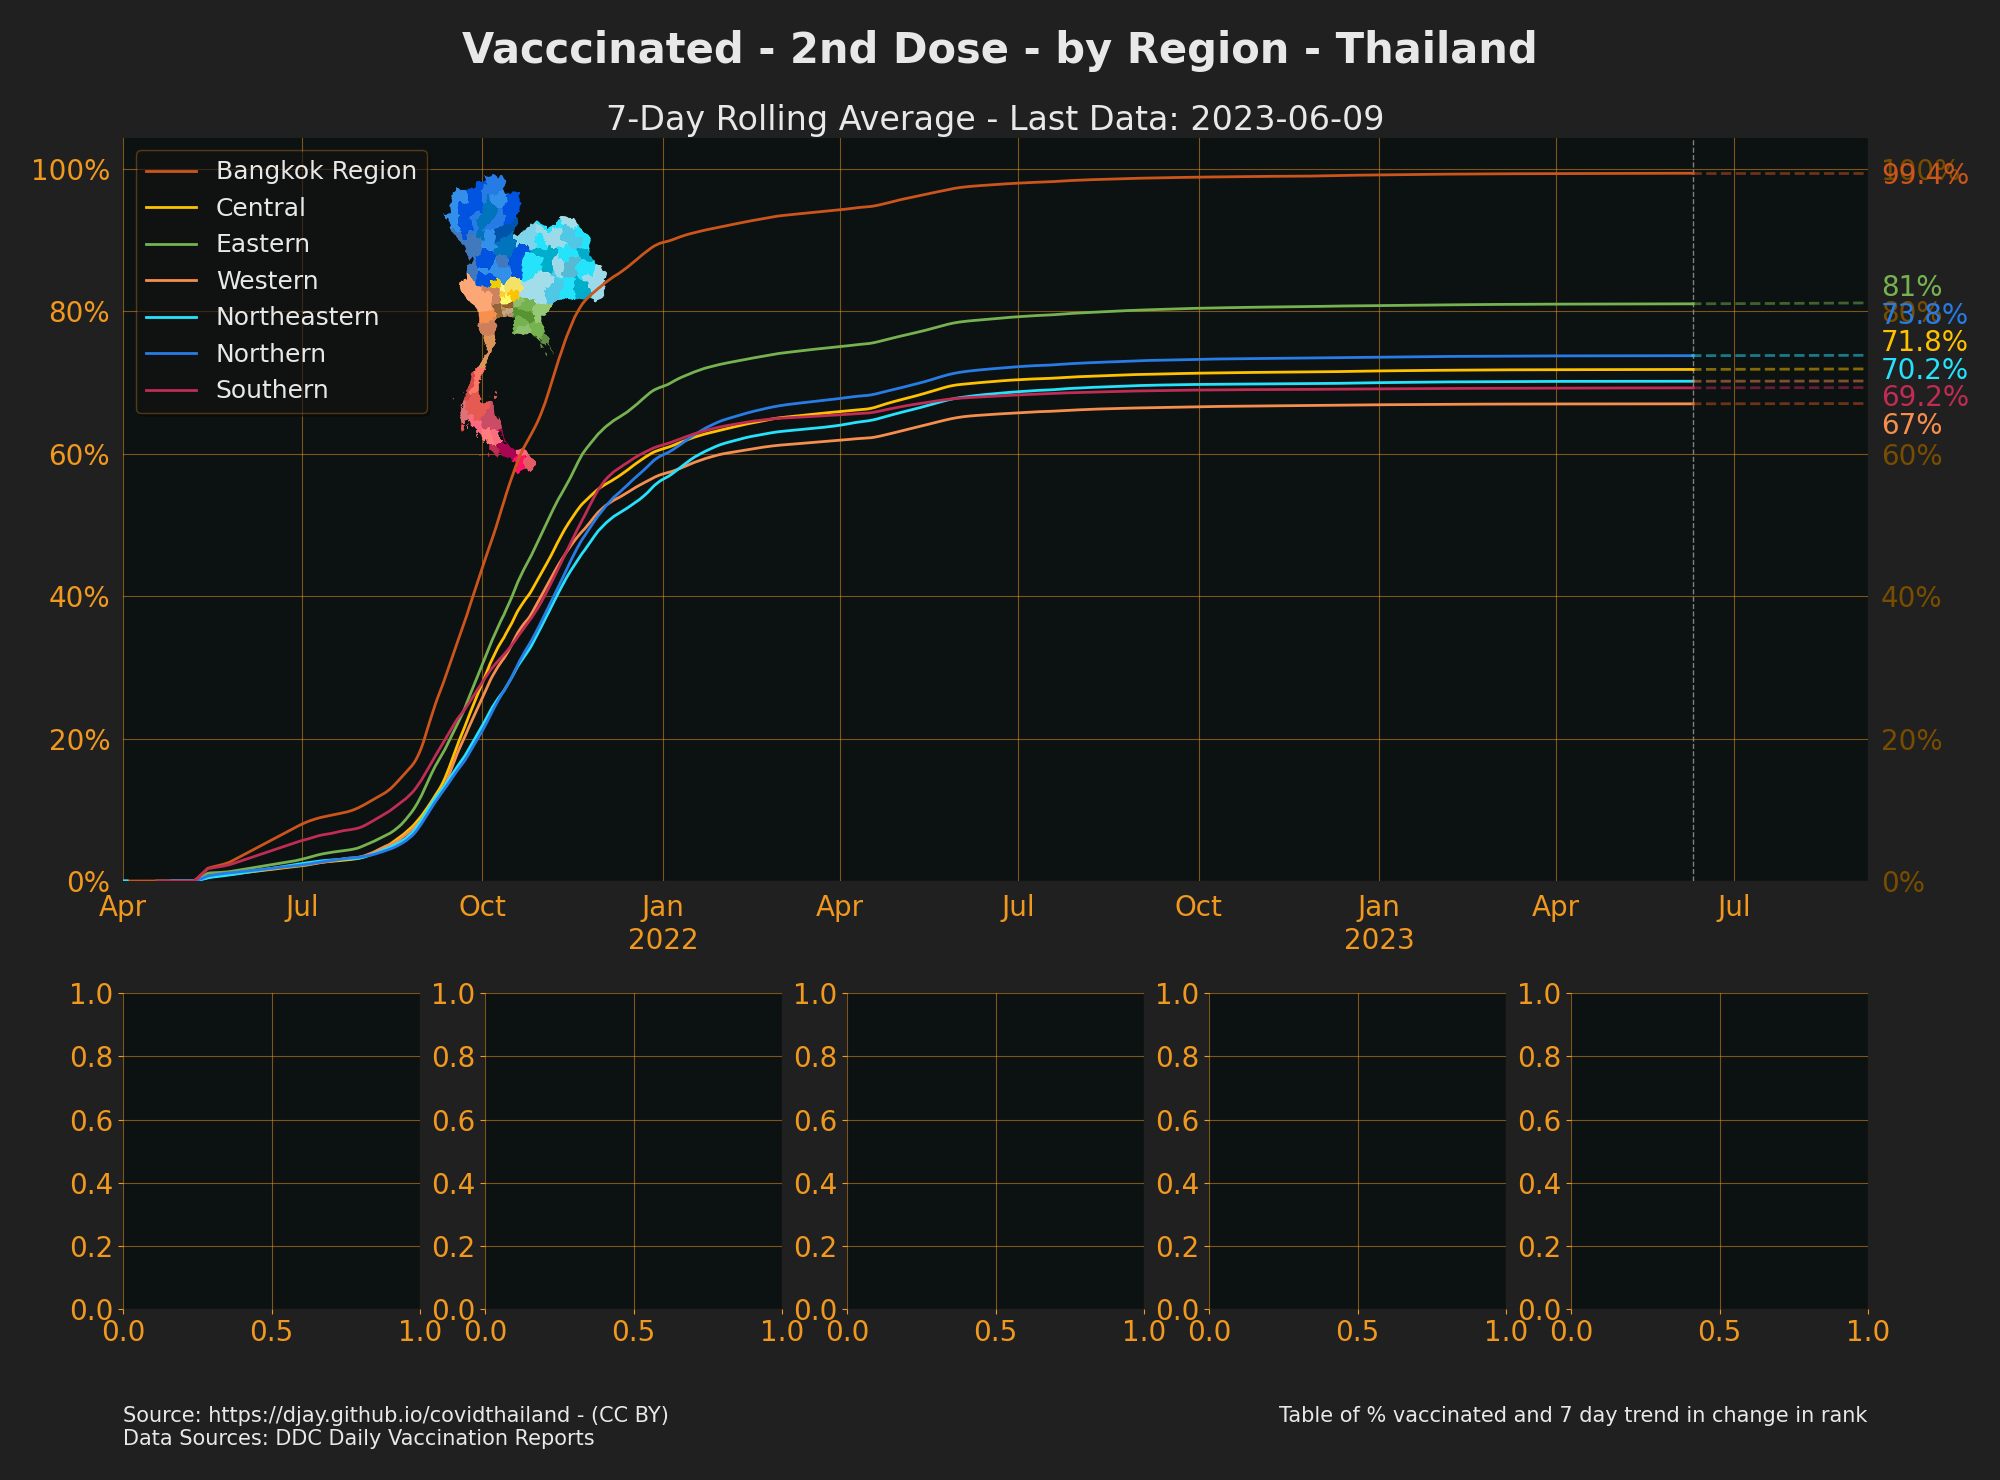
## Vaccinations by Region/Province
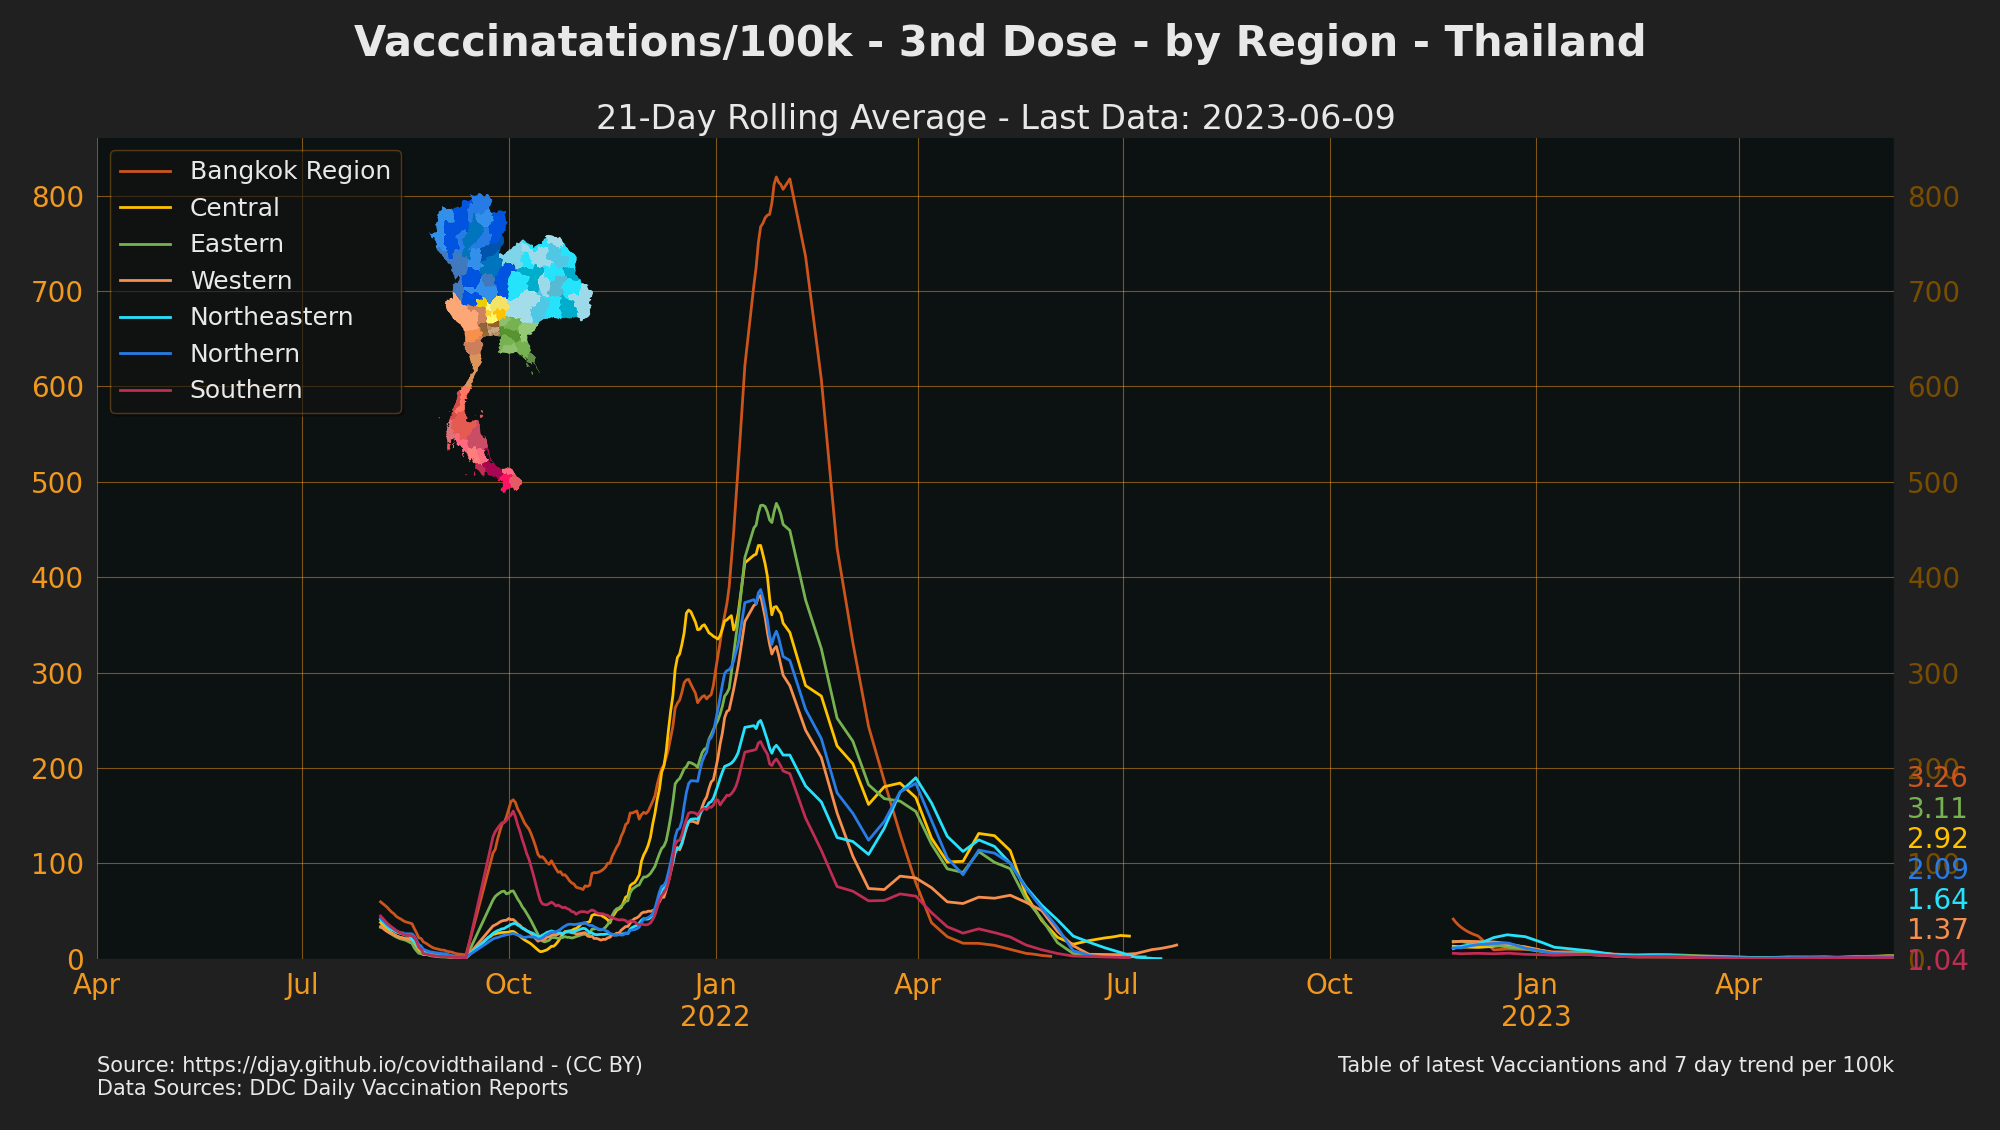
### Daily Vaccinations
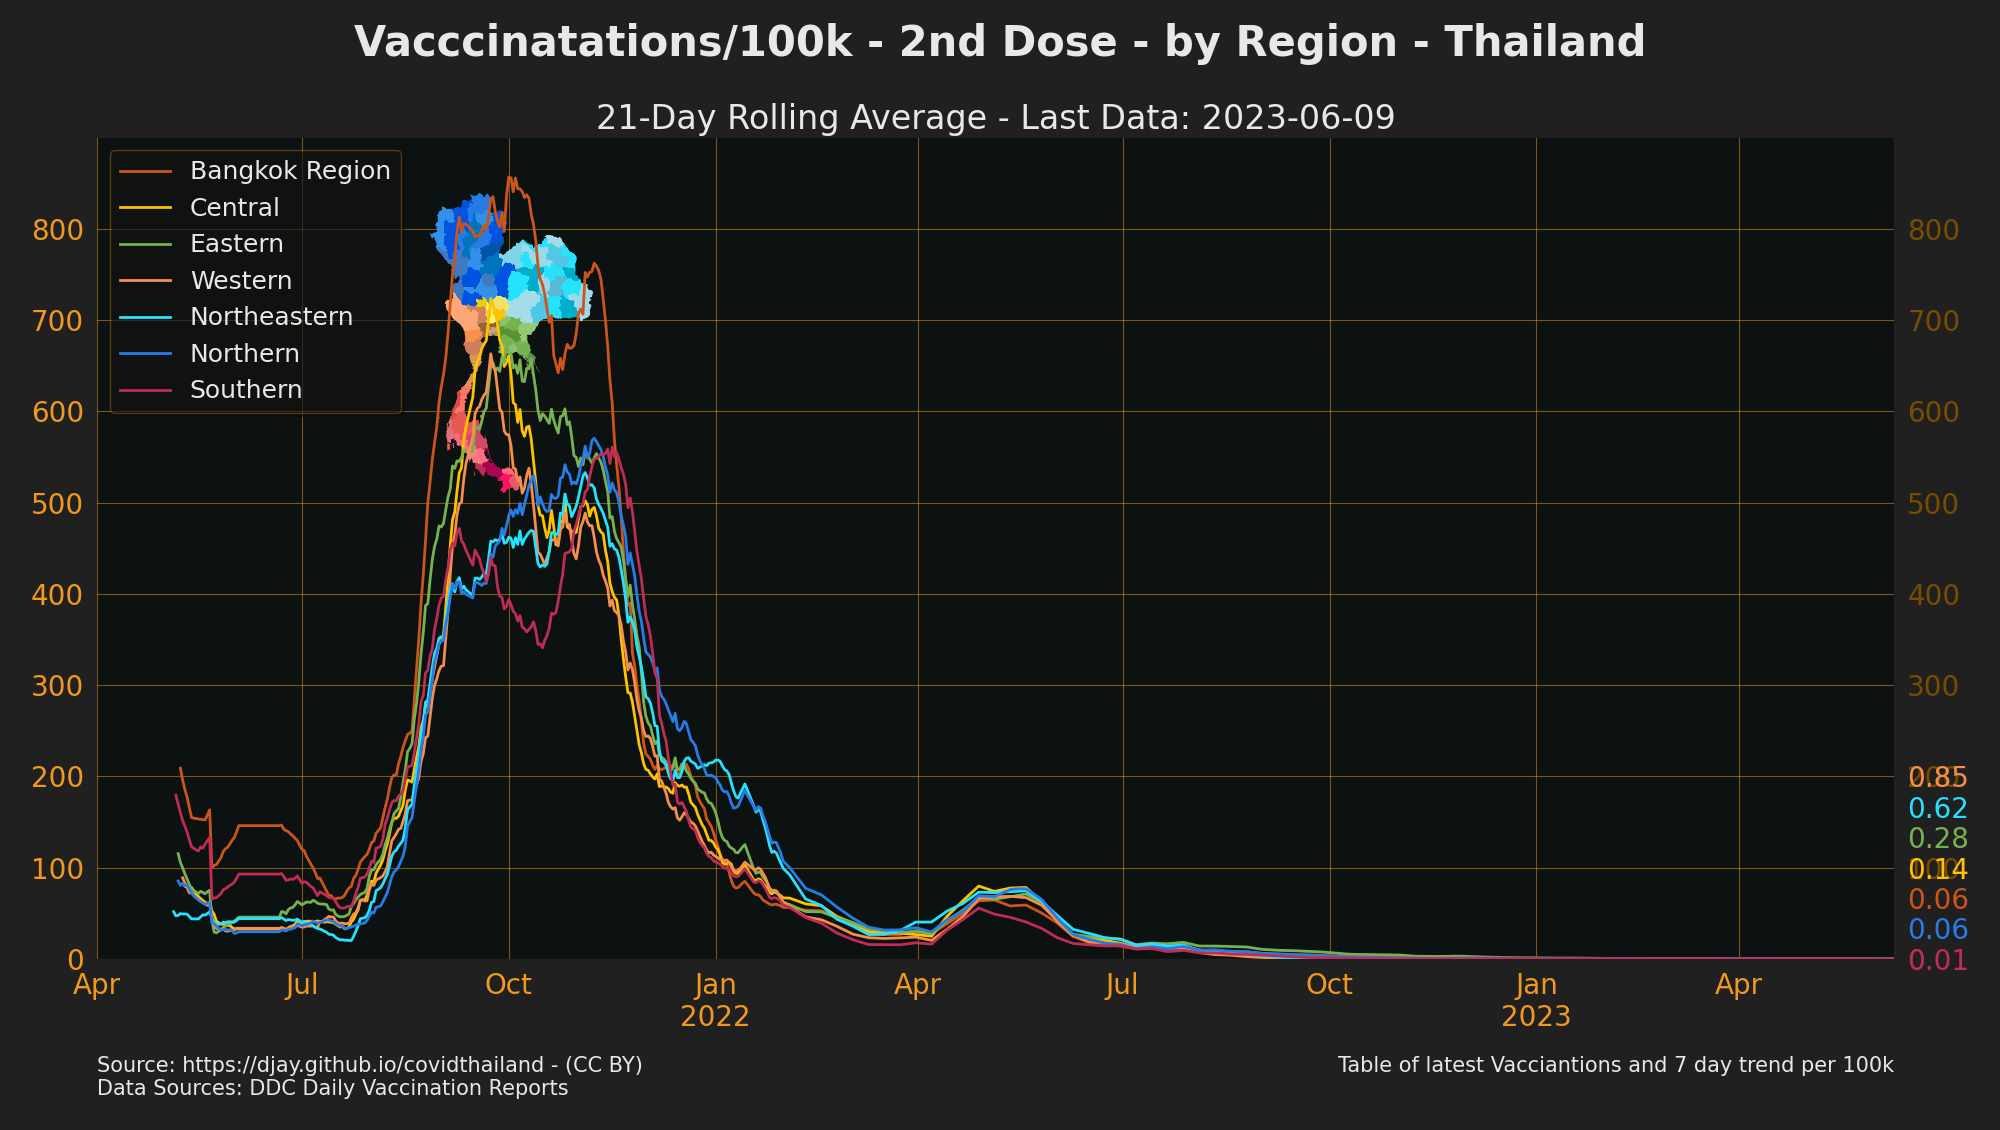

### By Province
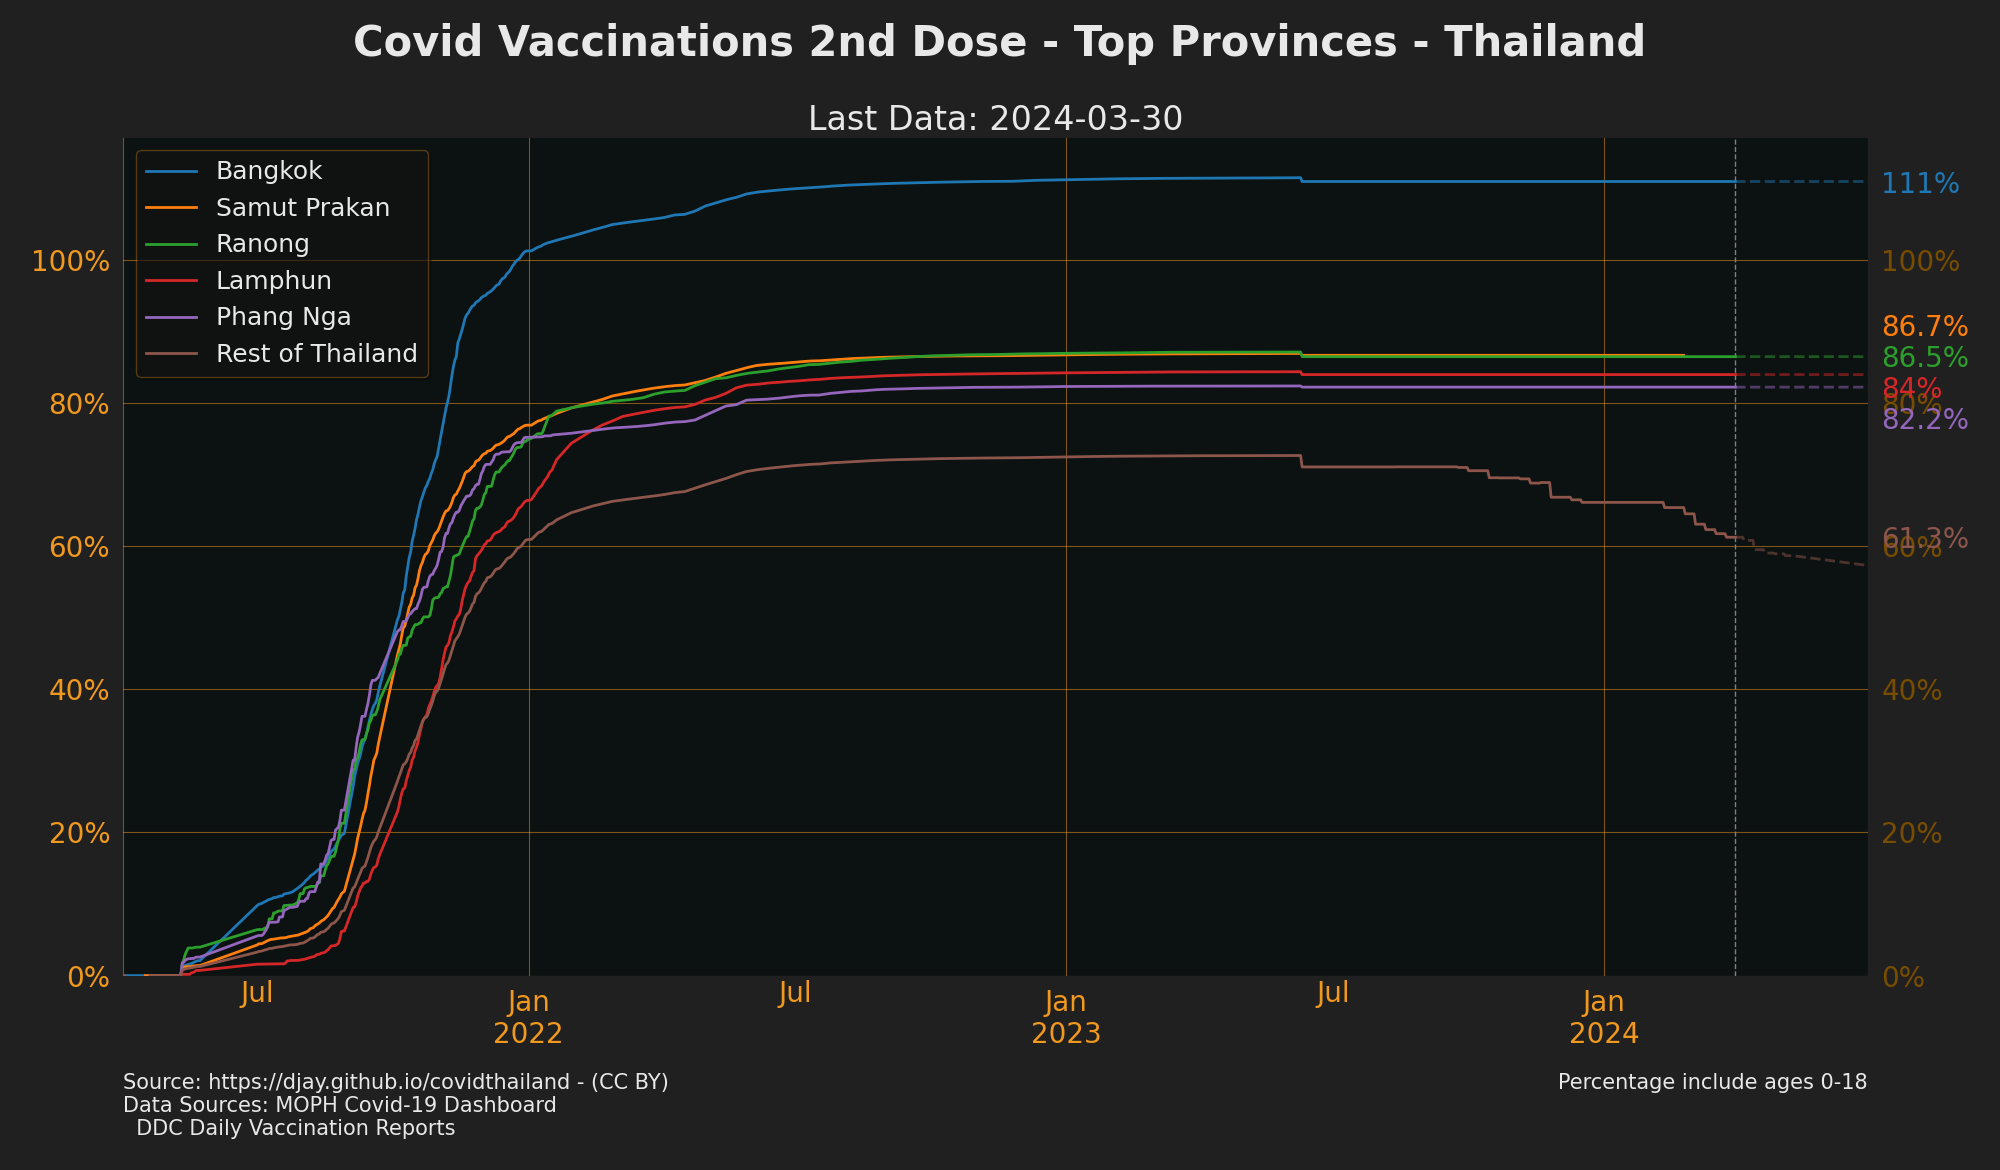
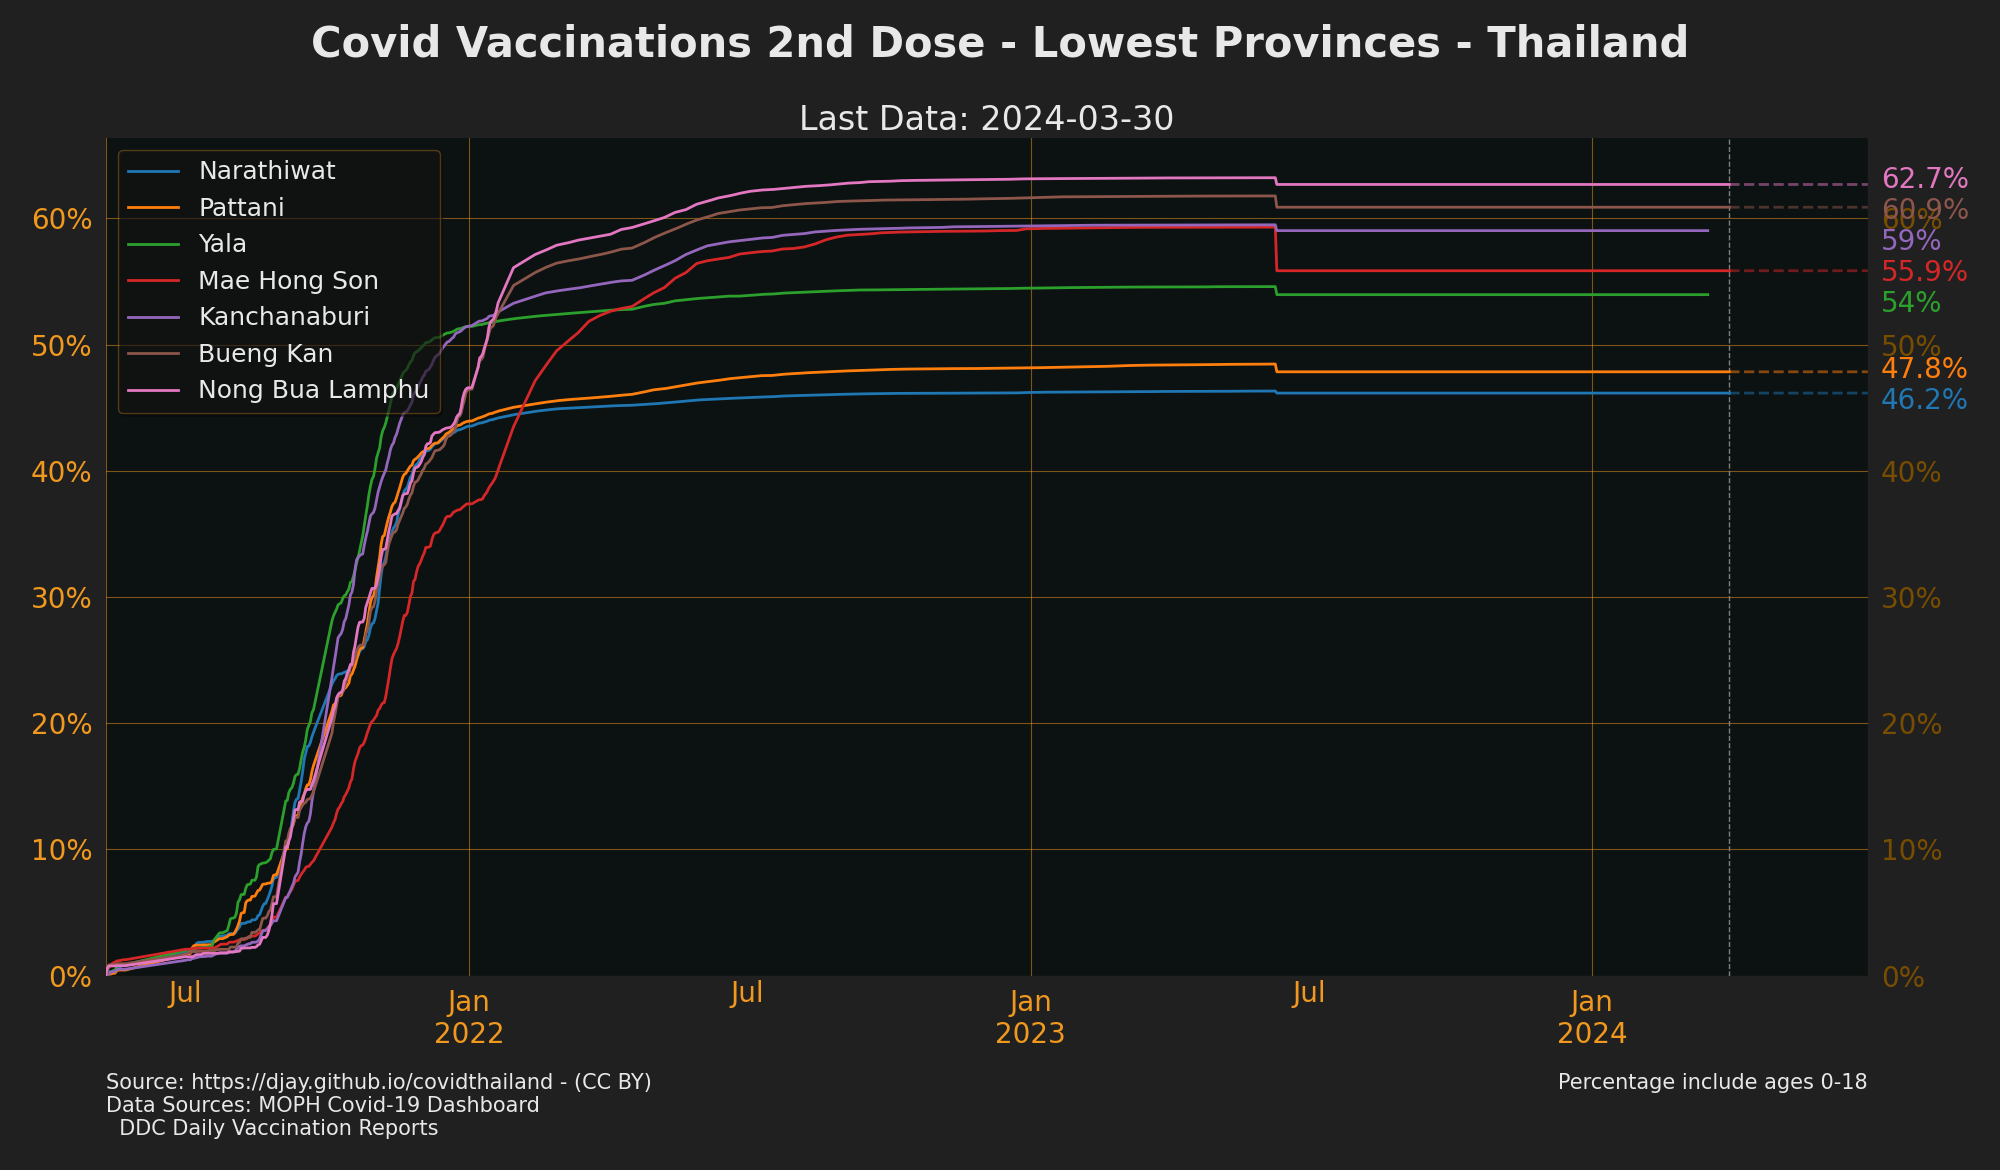
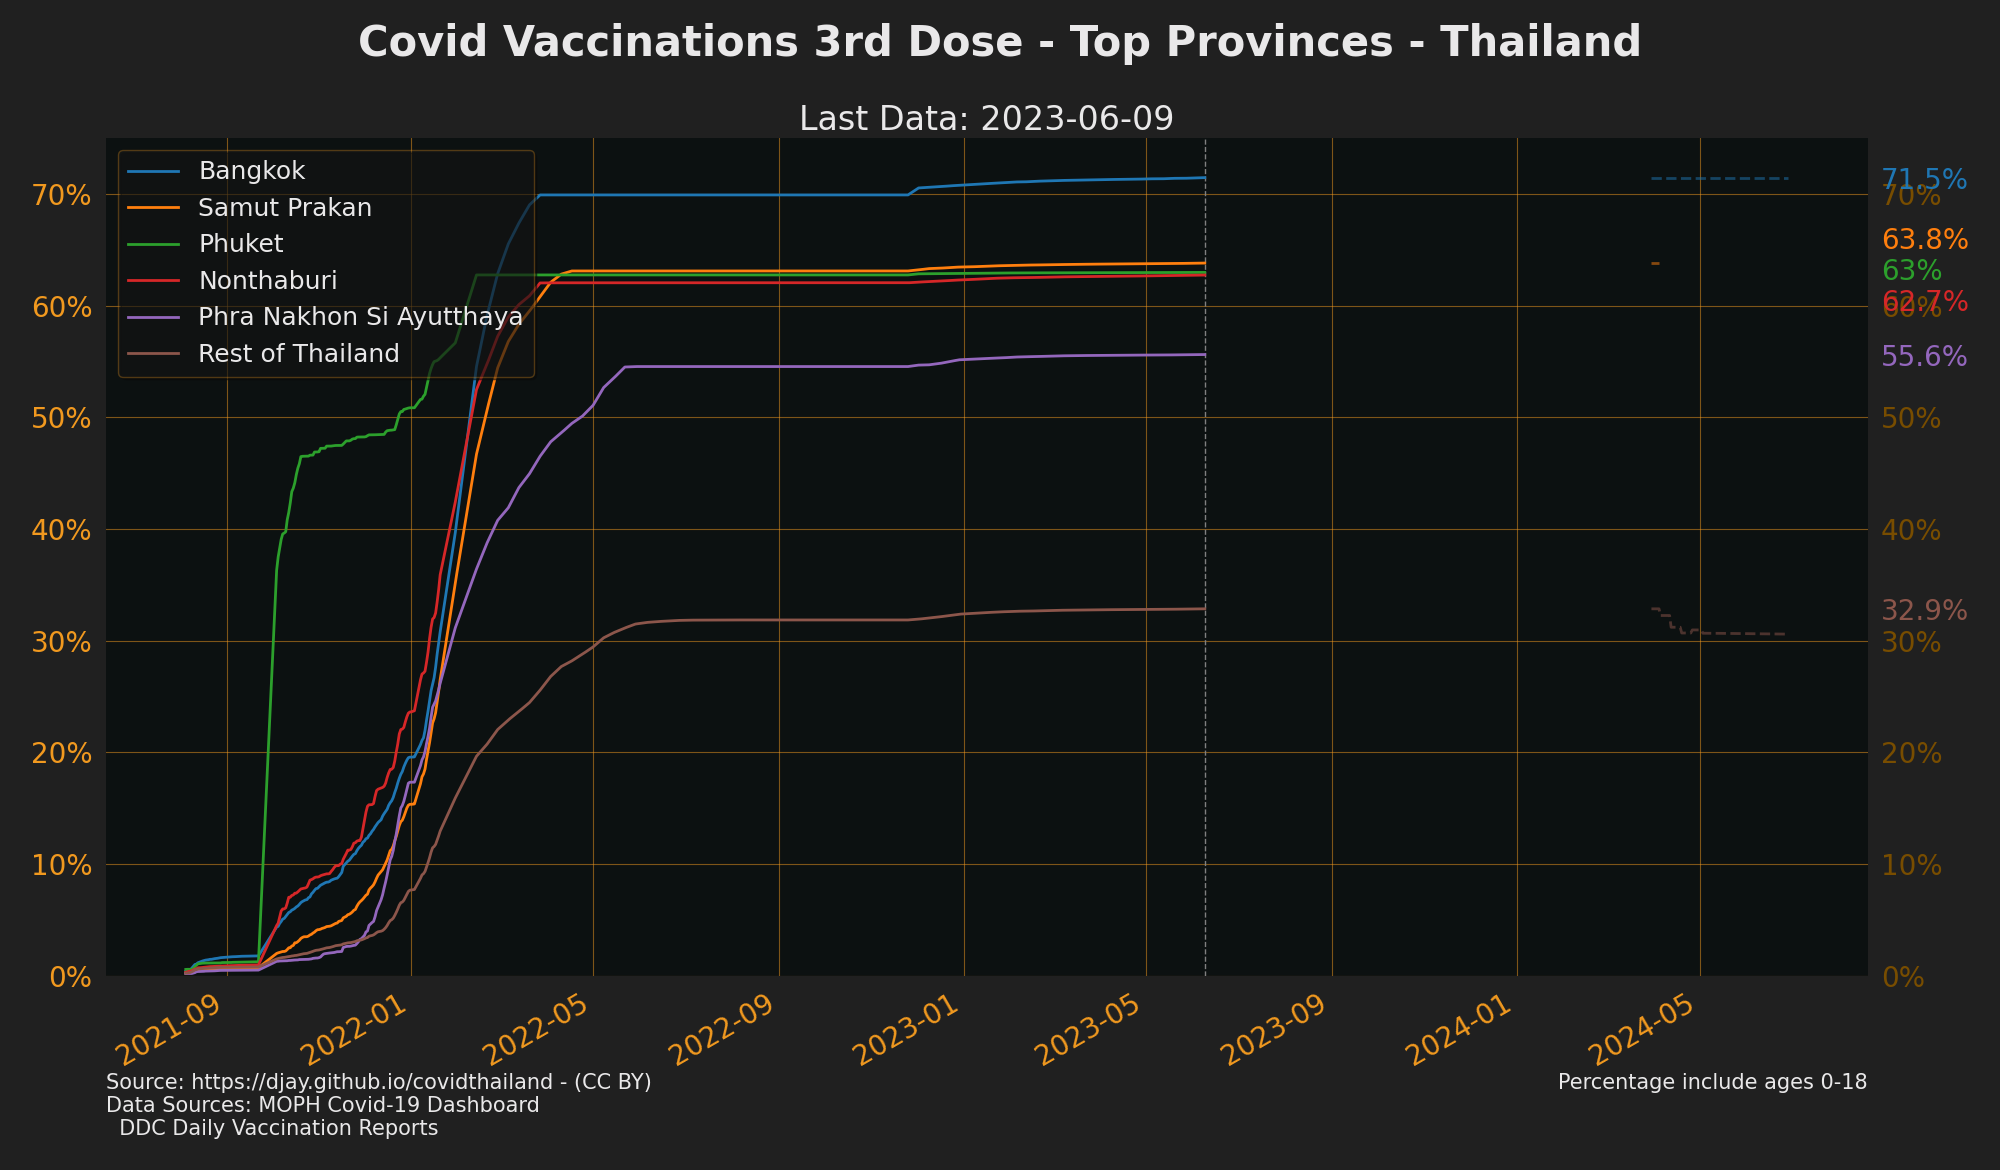
### By Group
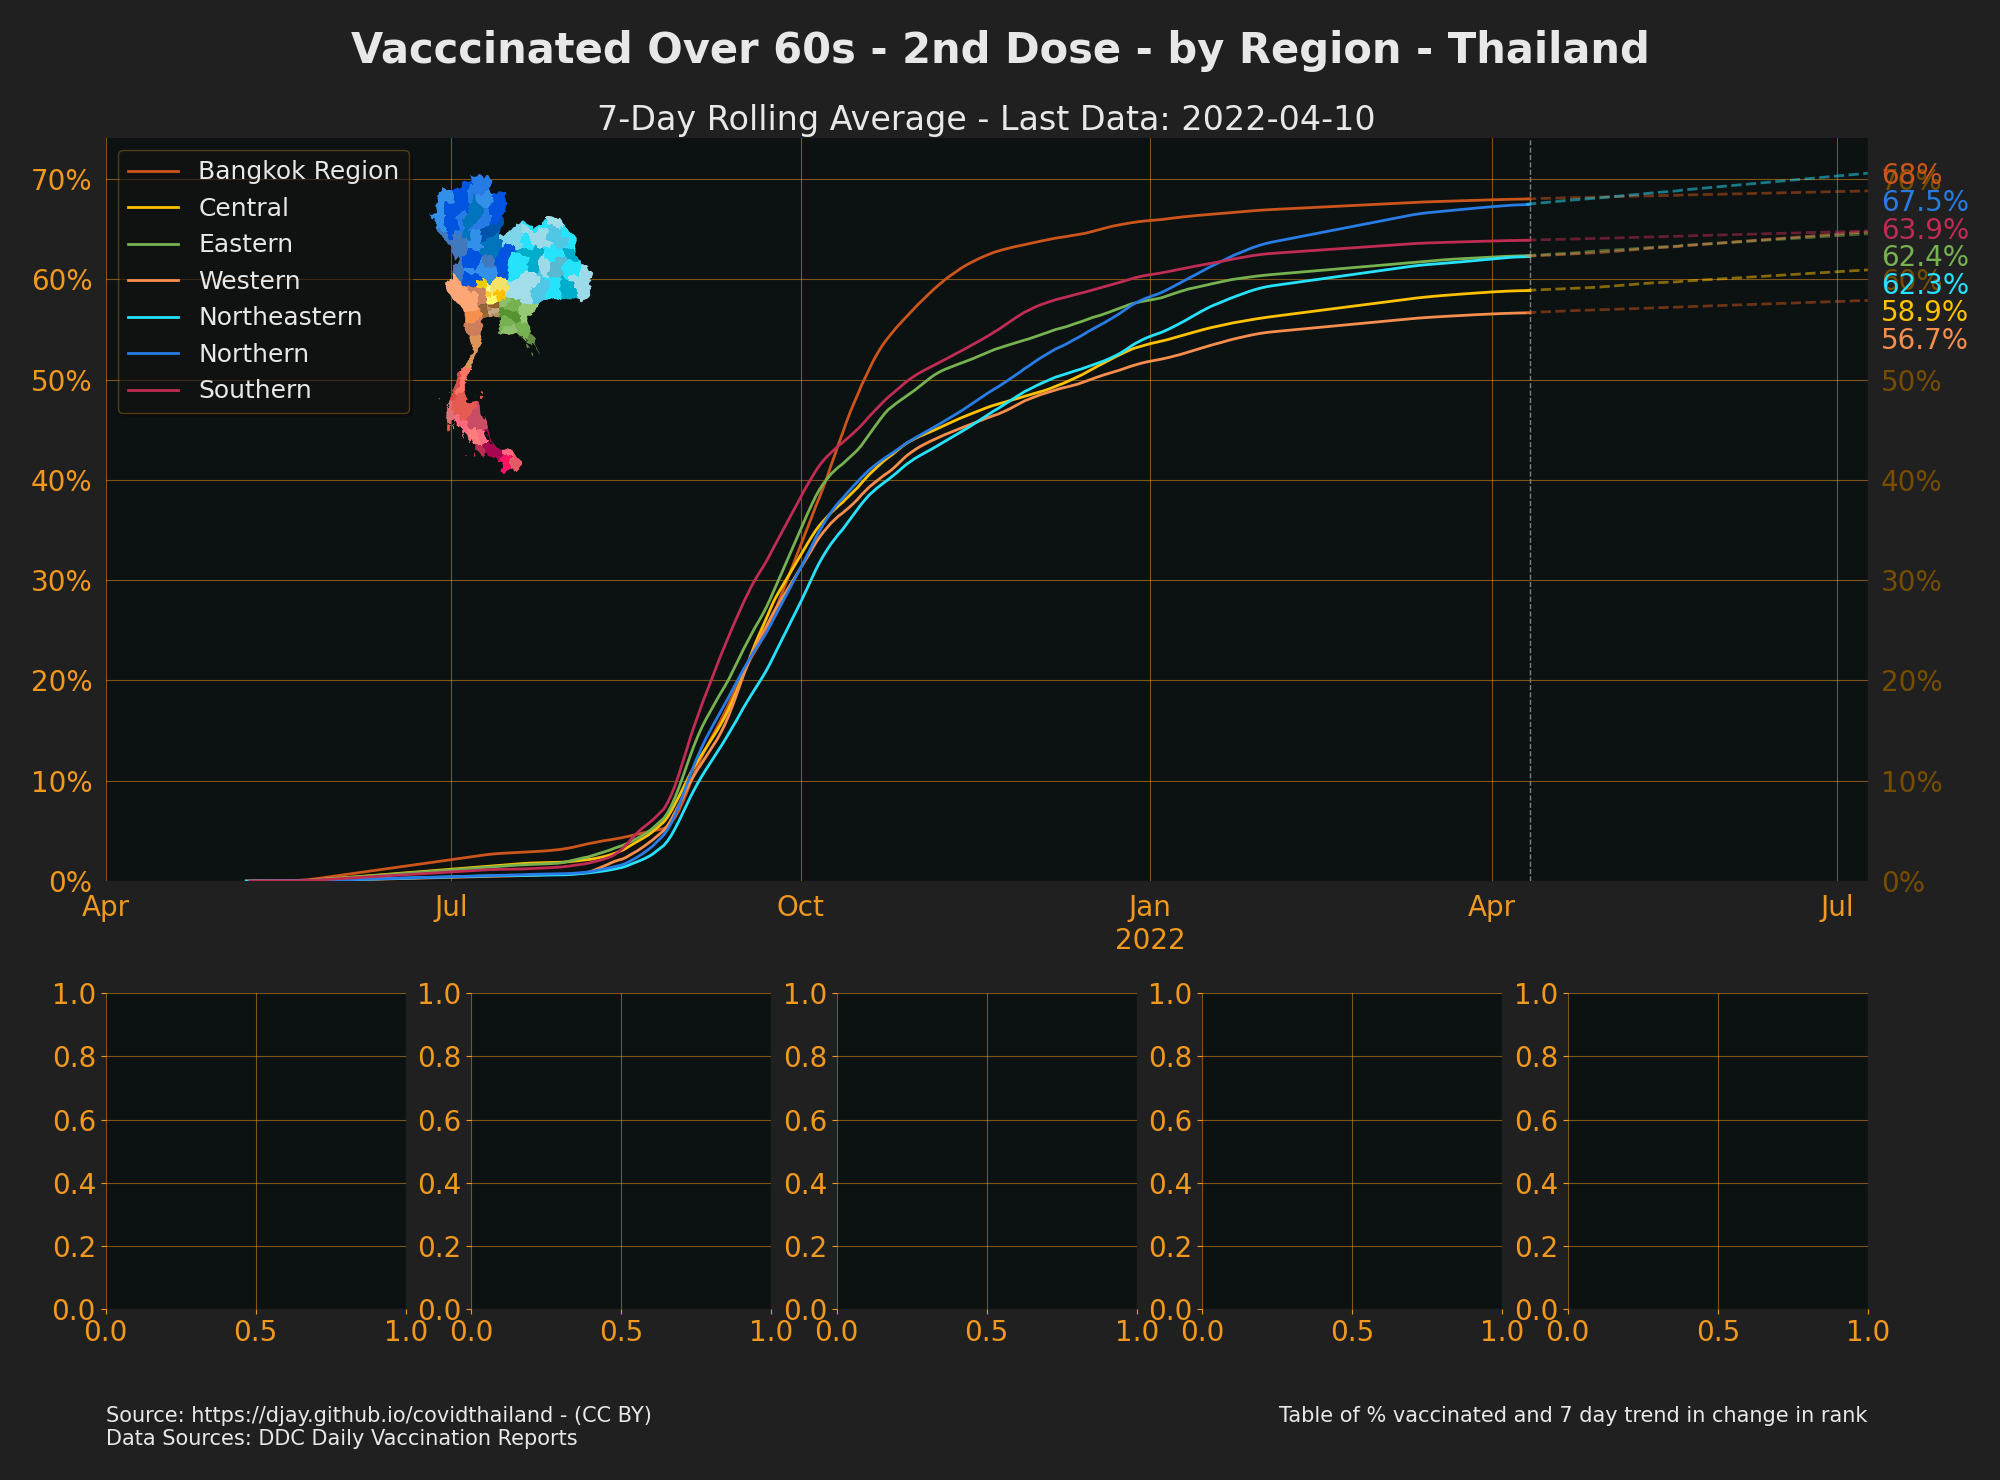
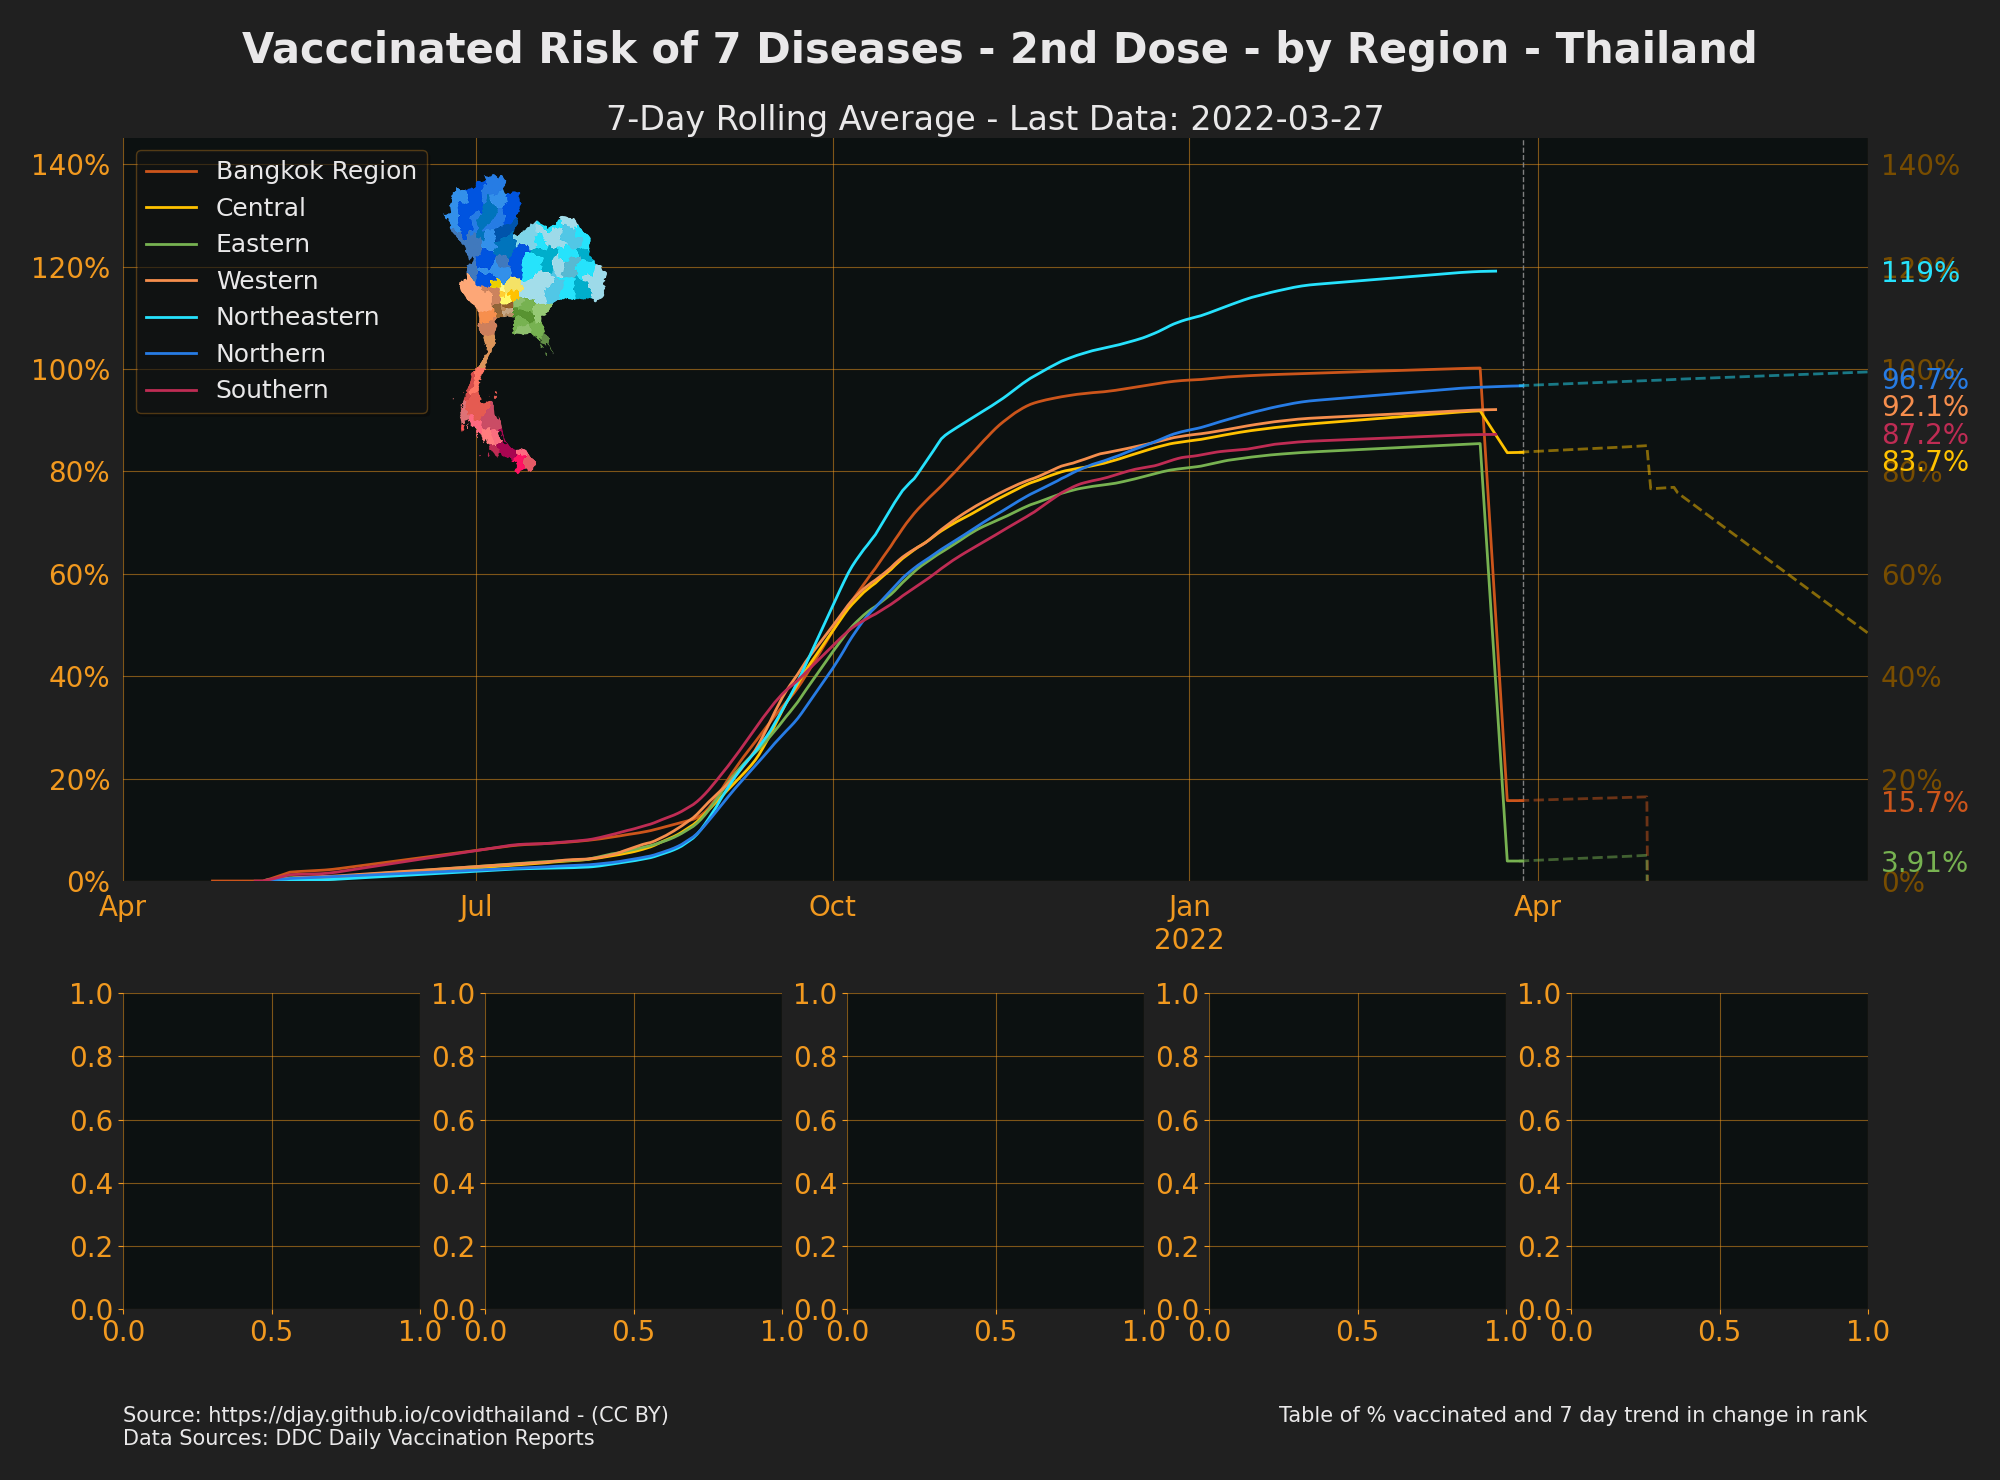
- Source: [MOPH Covid-19 Dashboard](downloads.md#dl-moph-dashboard), [DDC Daily Vaccination Reports](downloads.md#dl-vac)
- see also [Lowest Provinces by Vaccination 1st Jab](https://practical-ritchie-cca141.netlify.app/outputs/vac_low_doses_1_3.png) |
[Vaccinations 1st given by Region](https://practical-ritchie-cca141.netlify.app/outputs/vac_region_daily_1_3.png) |
[Map of Vaccinations: The Researcher Covid Tracker](https://covid-19.researcherth.co/vaccination)
# Active Cases/Hospitalisations
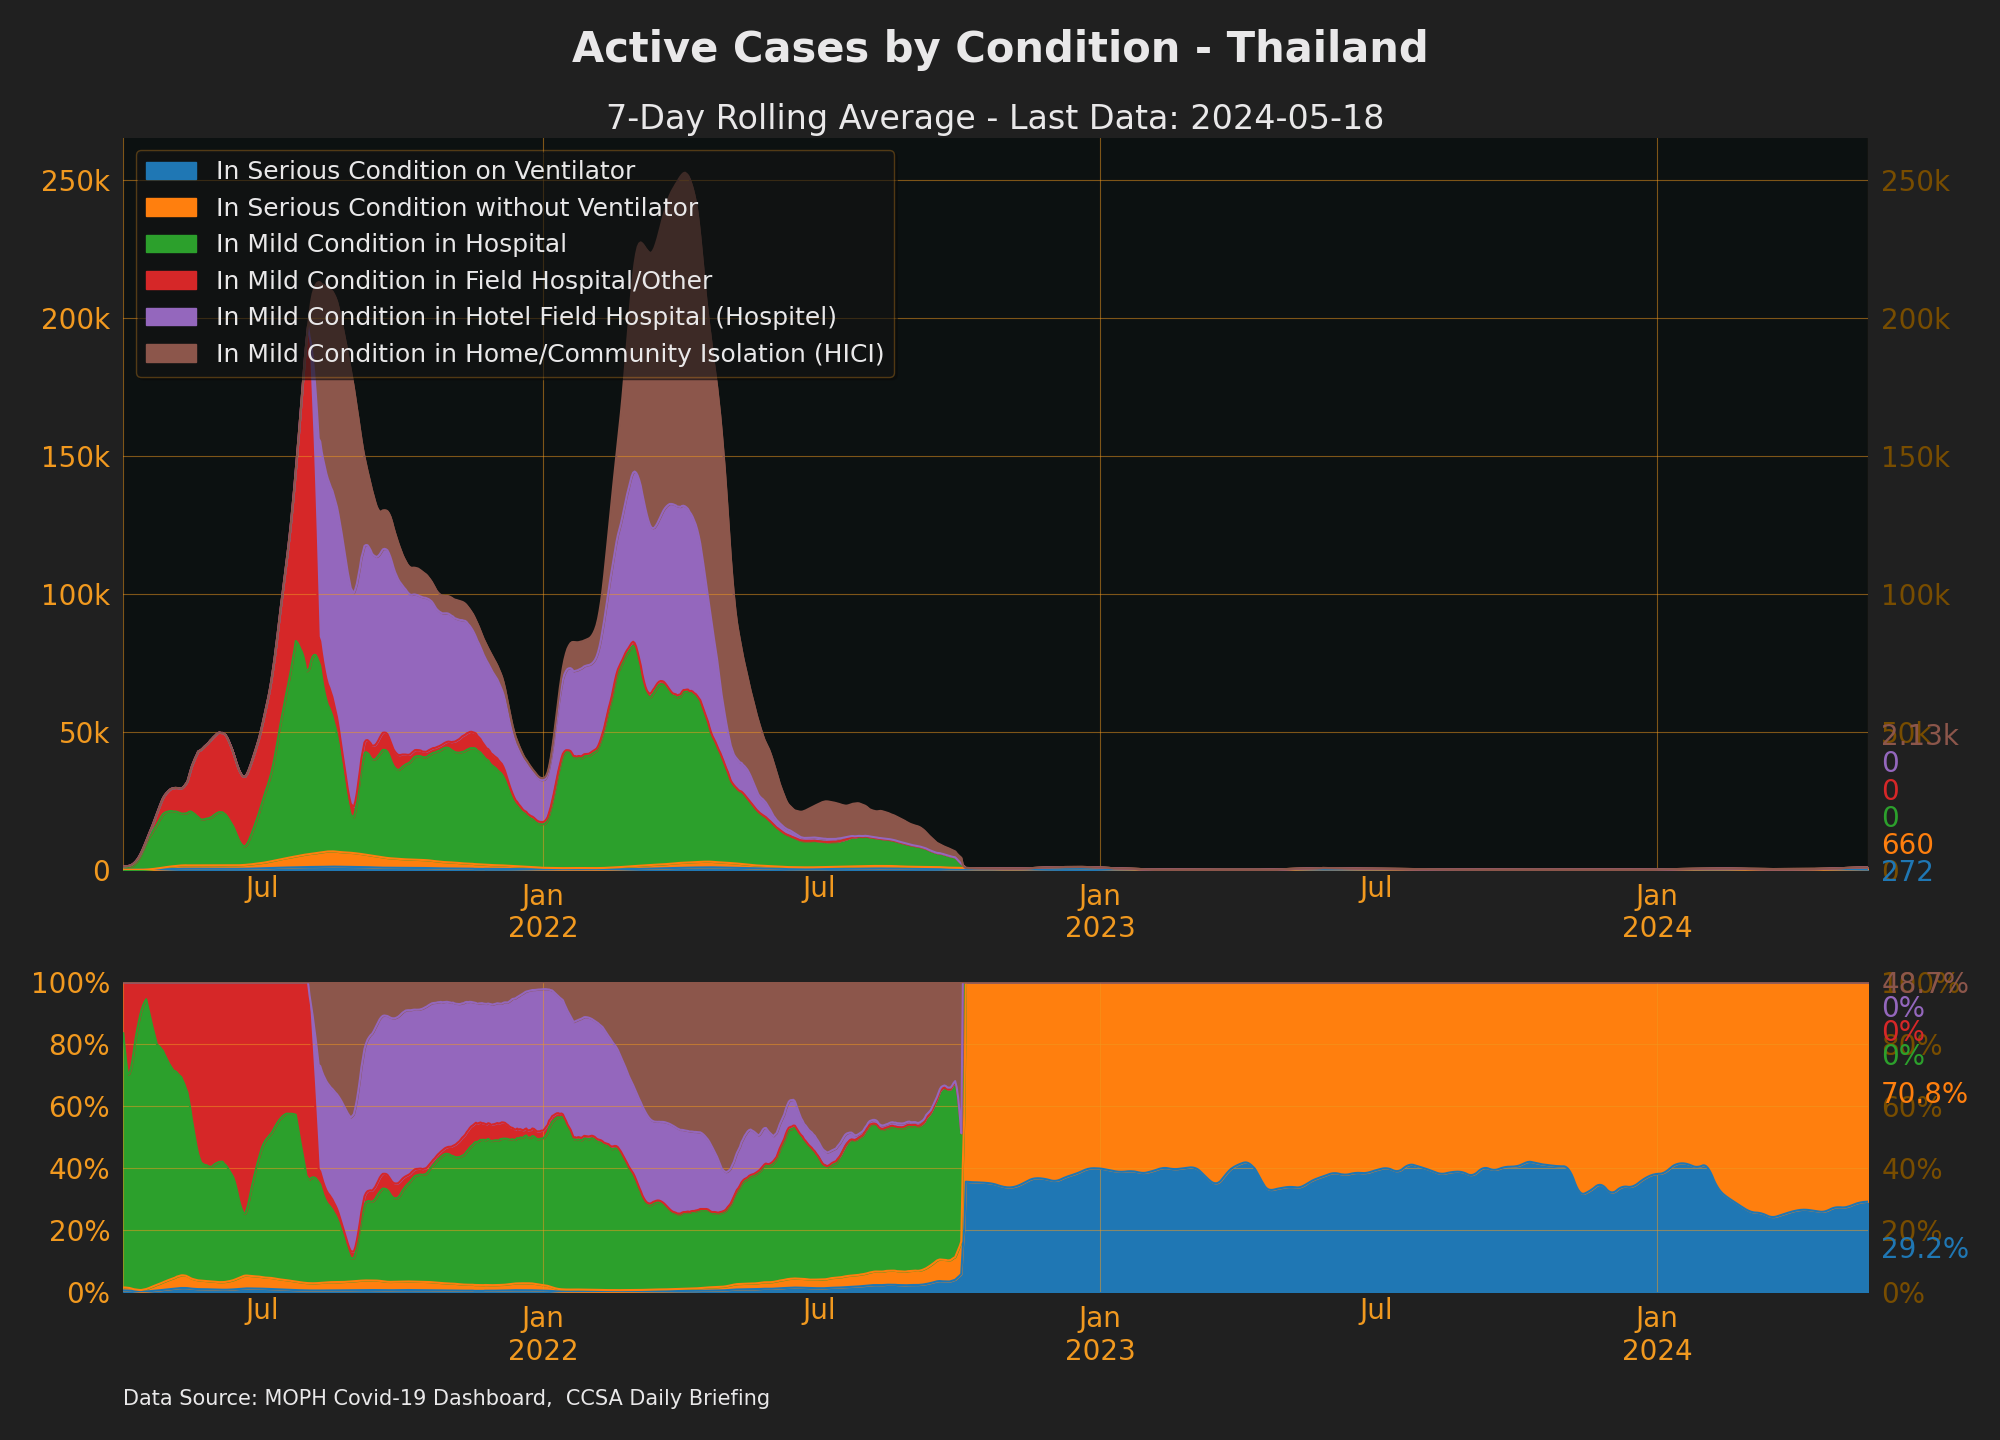
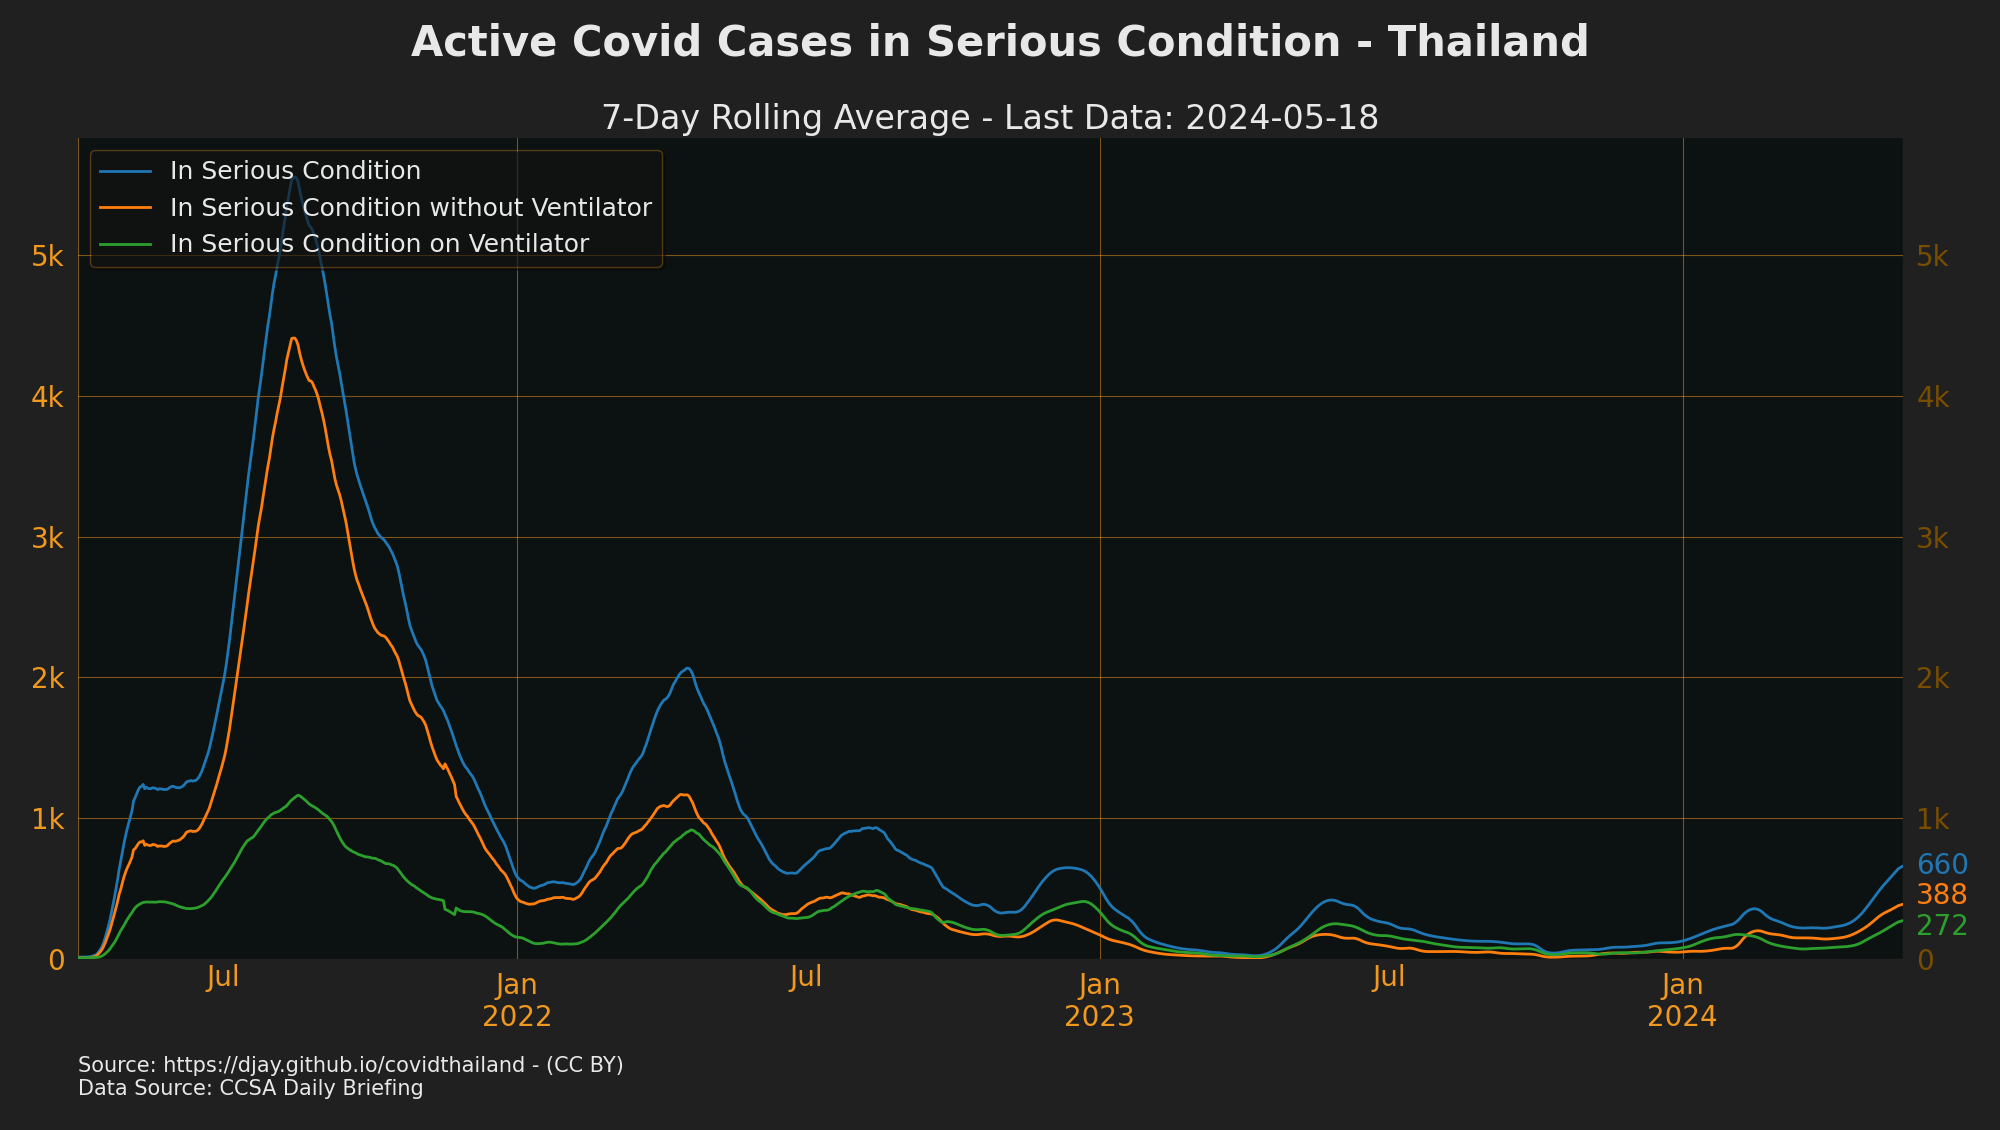
- Break down of active case status only available from 2020-04-24 onwards.
- Other Active Cases + ICU + Ventilator + Field hospitals = Hospitalised, which is everyone who is
confirmed (for 14days at least)
- see [Thailand Active Cases 2020-2021]((https://practical-ritchie-cca141.netlify.app/outputs/cases_active_all.png))
- Source: [CCSA Daily Briefing](downloads.md#dl-briefings)
## Positive Rate
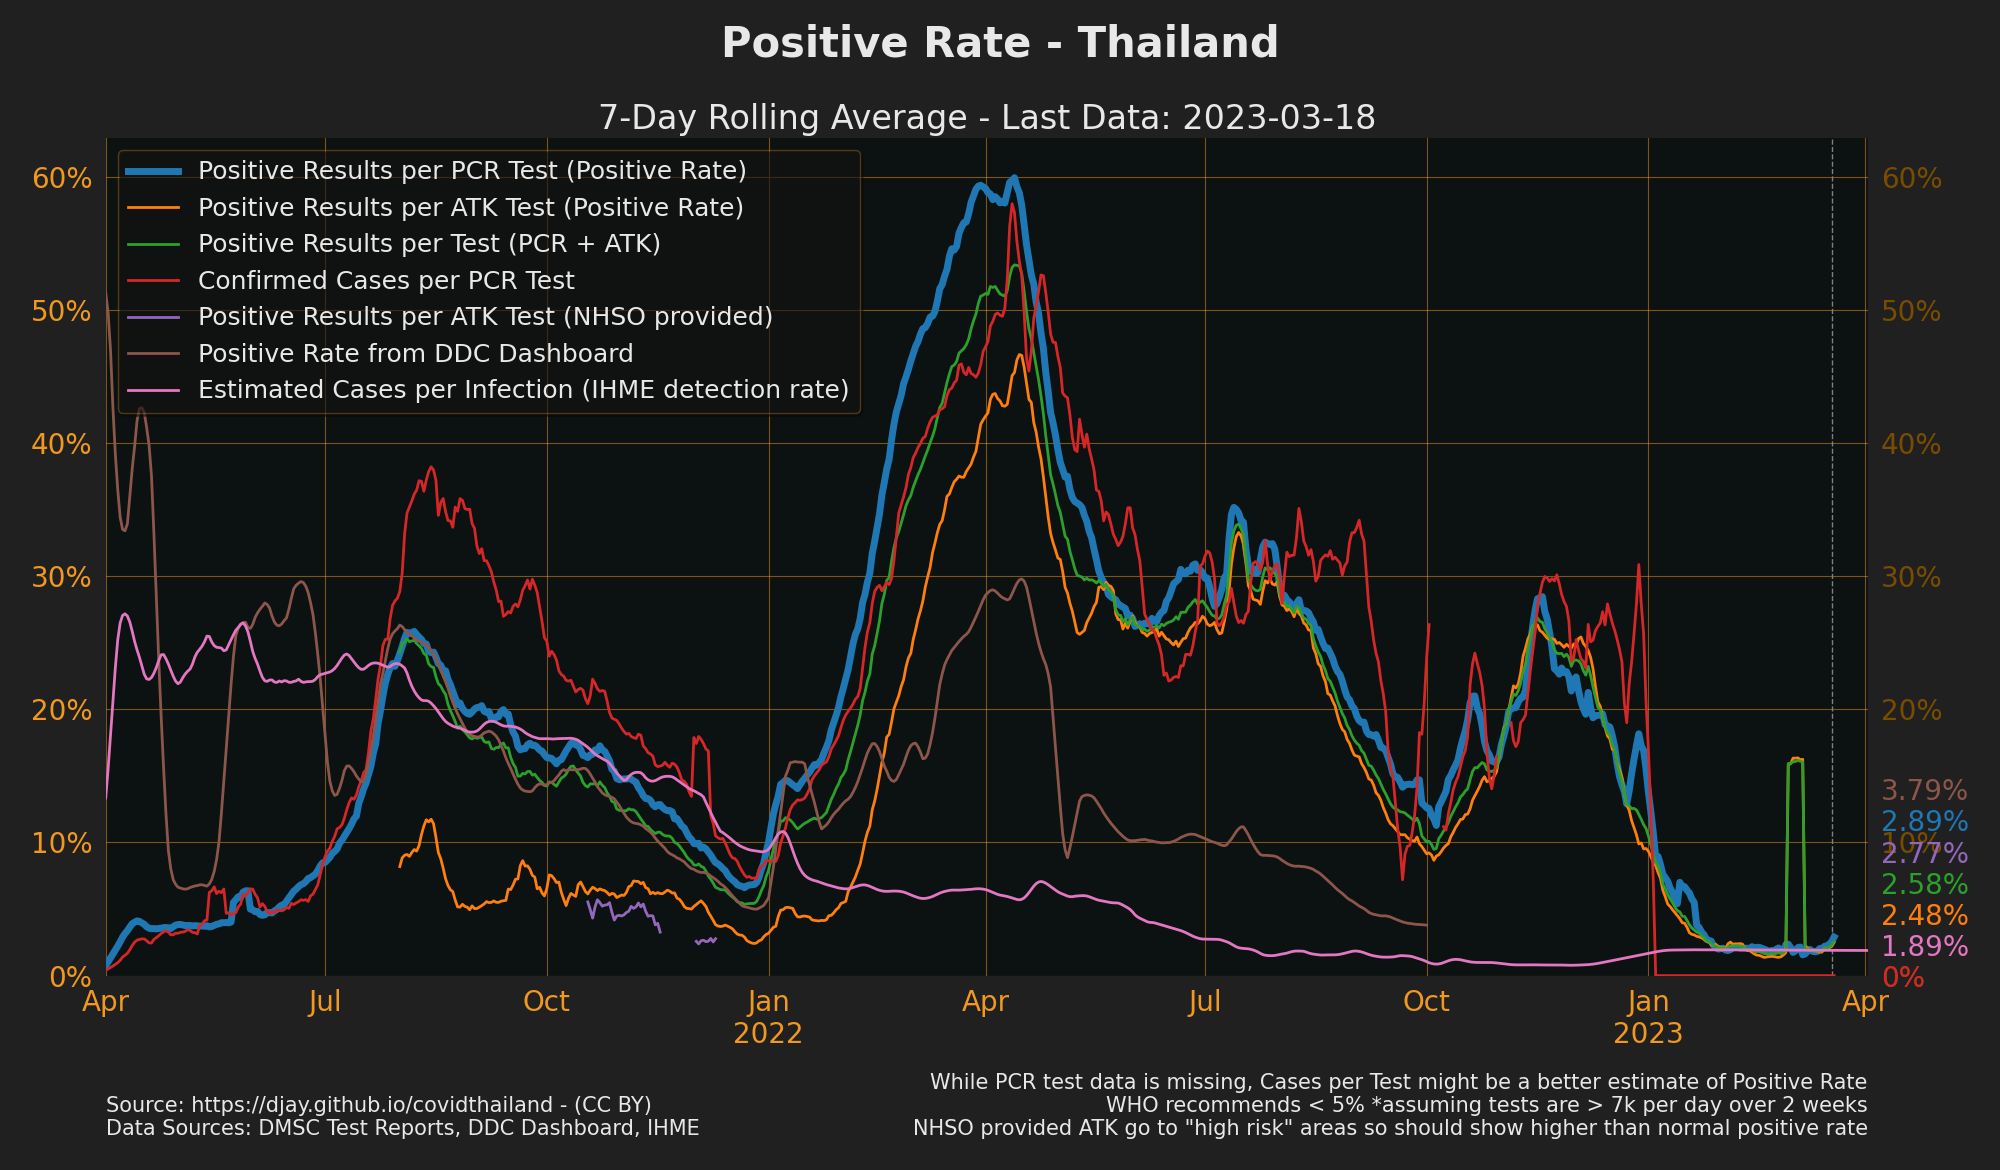
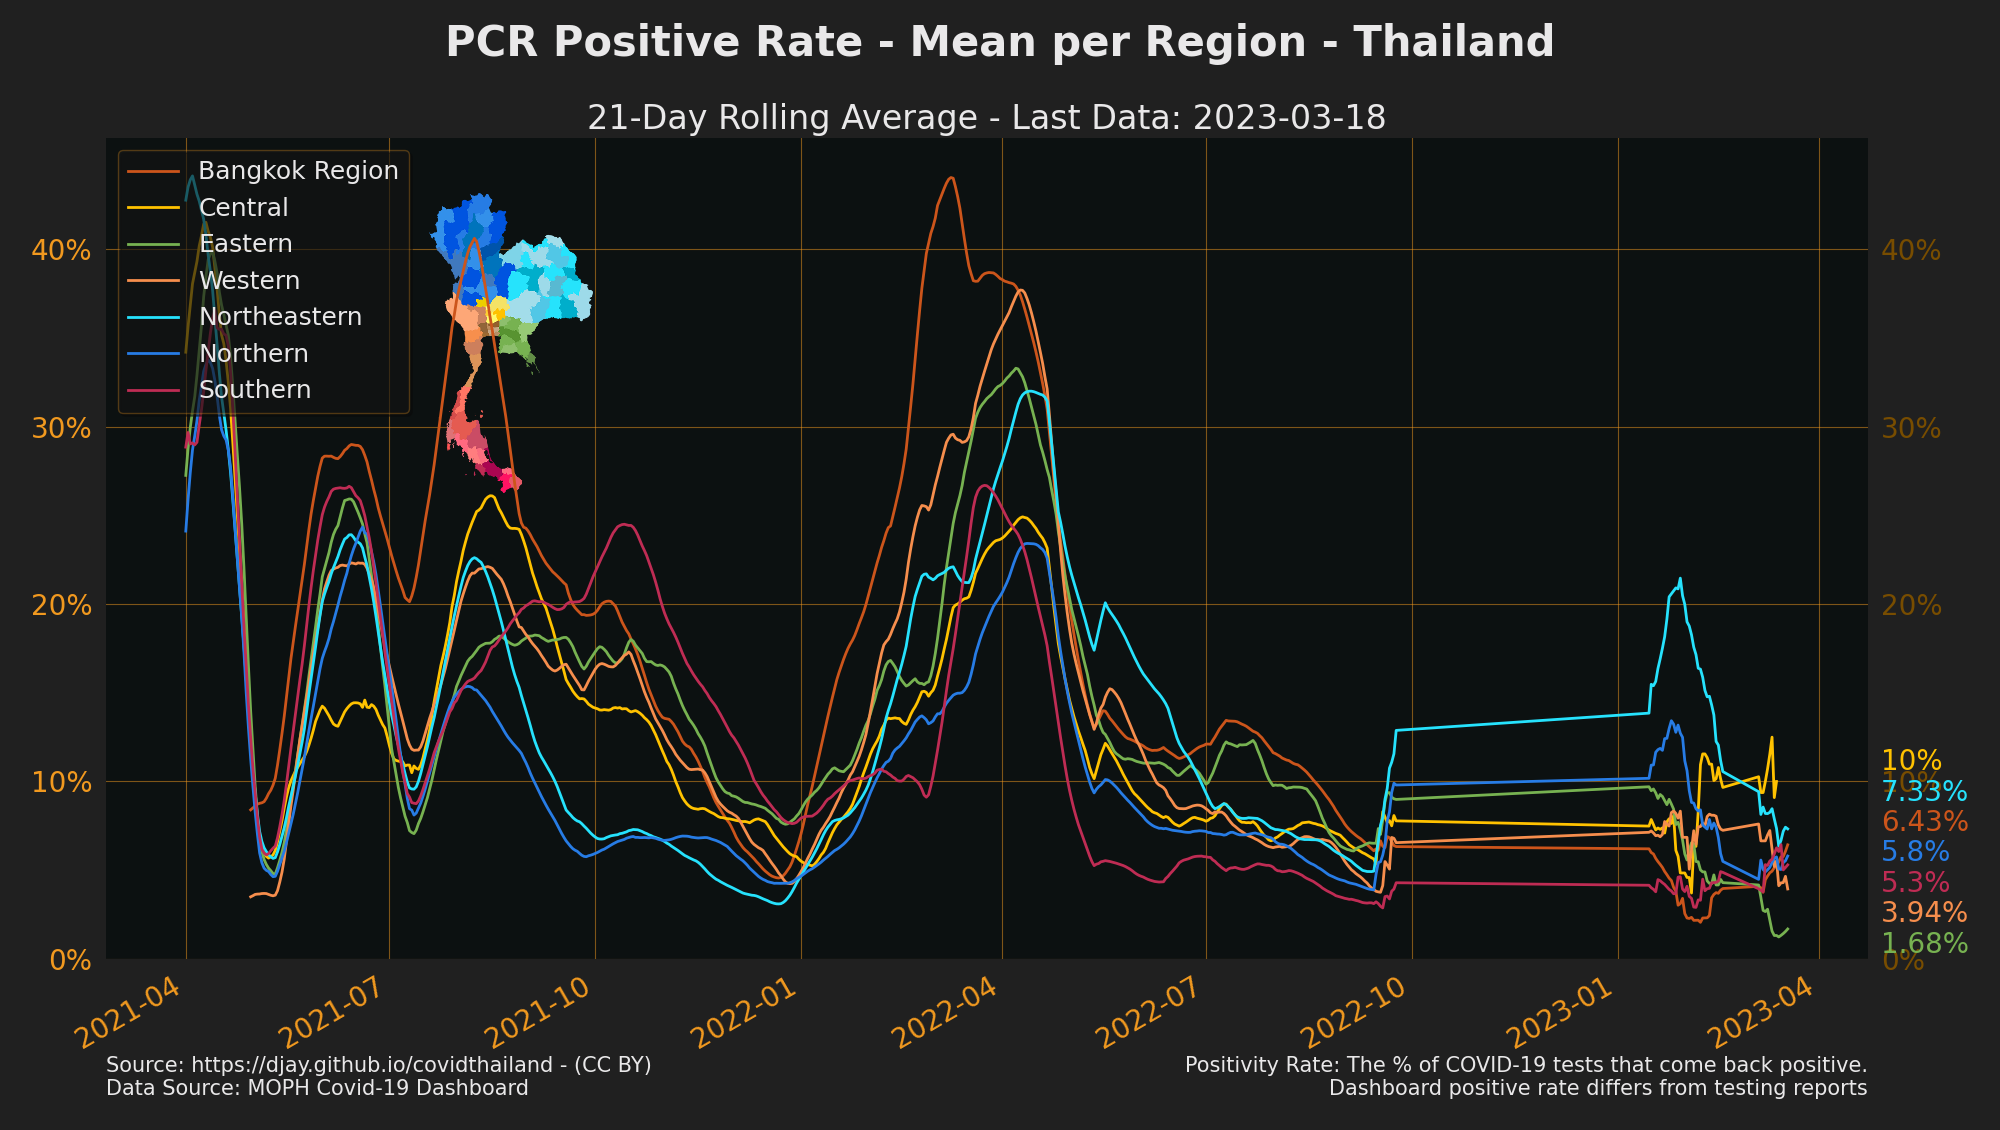
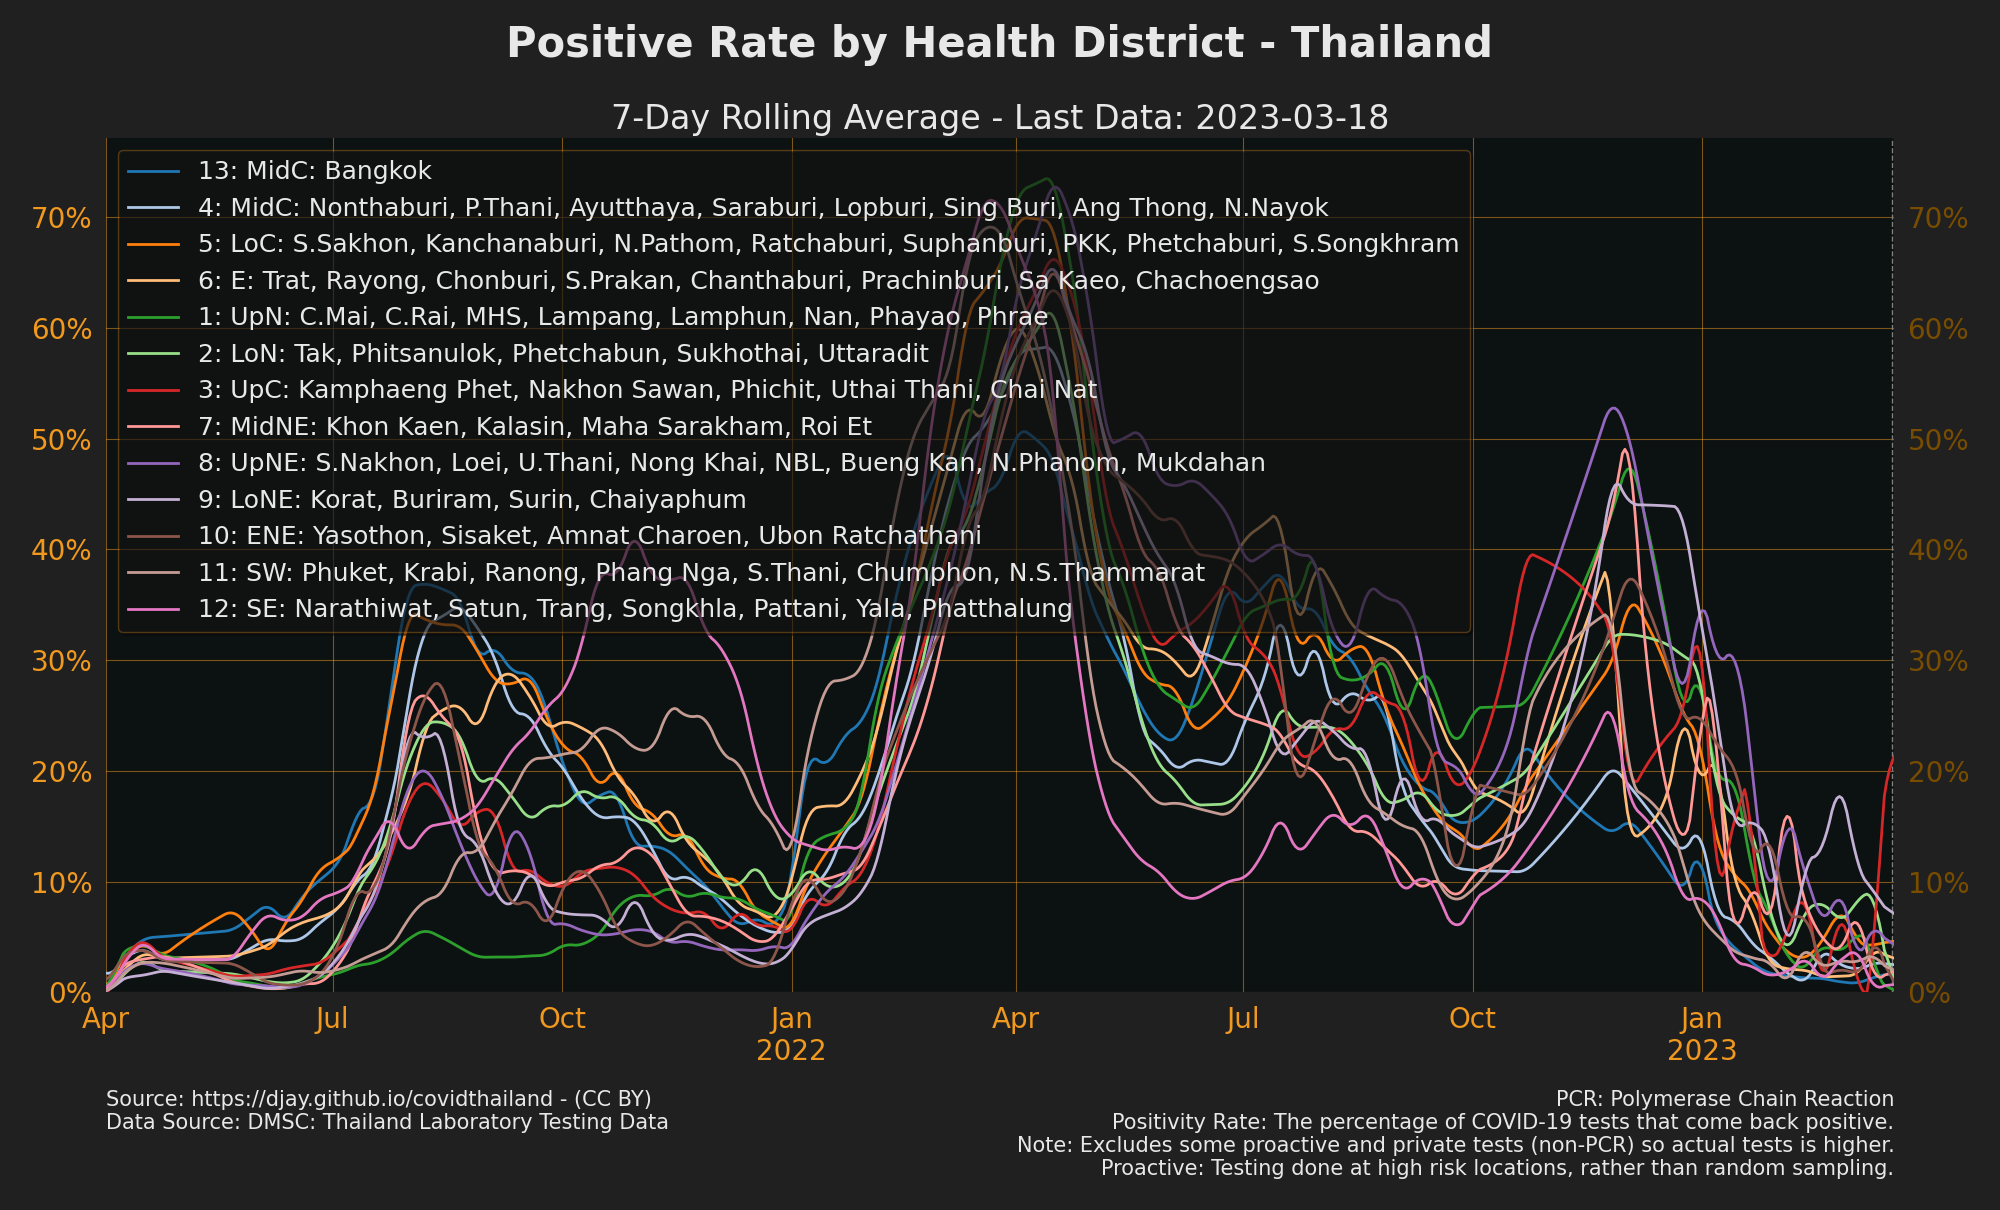
- [Positive rate < 5% for 2 weeks amd > 0.1%/w tested (10k/d tested)) means sufficient tests: WHO](https://www.jhsph.edu/covid-19/articles/covid-19-testing-understanding-the-percent-positive.html)
Assumes easy access to tests for everyone.
- It's likely there is [missing test data](https://practical-ritchie-cca141.netlify.app/outputs#more-cases-than-positive-results). Using confirmed cases migth be more accurate.
- This positive rate is based on [DMSC: Thailand Laboratory testing data](downloads.md#dl-testing). In the [Daily MOPH Situation Reports](downloads.md#dl-situation-reports) is a number labelled ```Total number of laboratory tests```. [```Total number of laboratory tests``` is mislabelled and is exactly the same as the PUI number](https://practical-ritchie-cca141.netlify.app/outputs).
- see also [Positive Rate: Full year](https://practical-ritchie-cca141.netlify.app/outputs/positivity_all.png), [Tests per Case Graph](https://practical-ritchie-cca141.netlify.app/outputs/tests_per_case_3.png) (Positive rate inverted) could be easier to understand,
[Positive Rate - Top Provinces - Thailand](https://practical-ritchie-cca141.netlify.app/outputs/positivity_prov_top_3.png),
[Positive Rate - Lowest Provinces - Thailand](https://practical-ritchie-cca141.netlify.app/outputs/positivity_prov_low_3.png)
- Sources: [DMSC: Thailand Laboratory testing data](downloads.md#dl-testing), [Daily situation Reports](downloads.md#dl-situation-reports), [MOPH Covid-19 Dashboard](downloads.md#dl-moph-dashboard)
## PCR Tests in Thailand by day
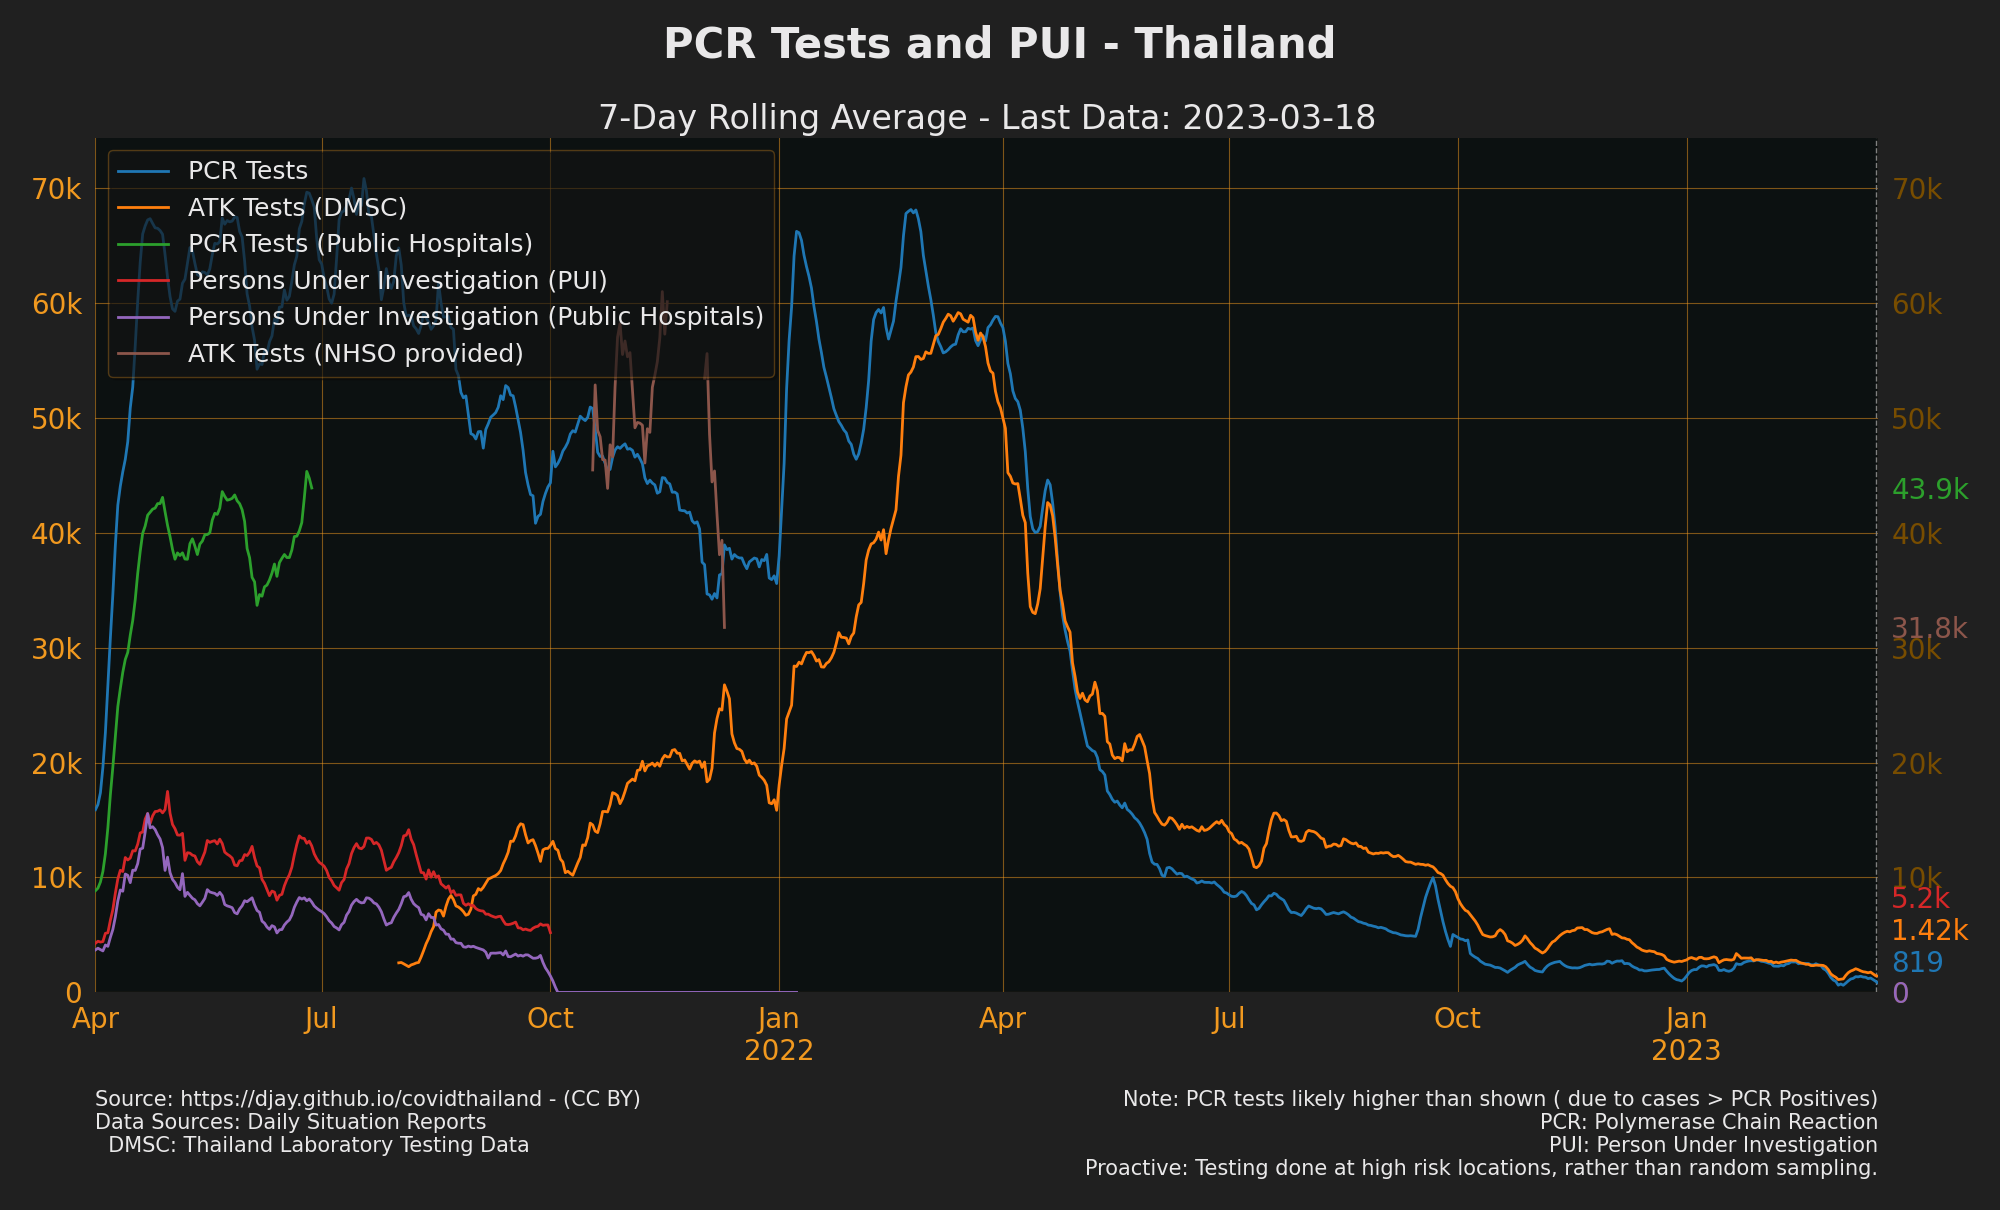
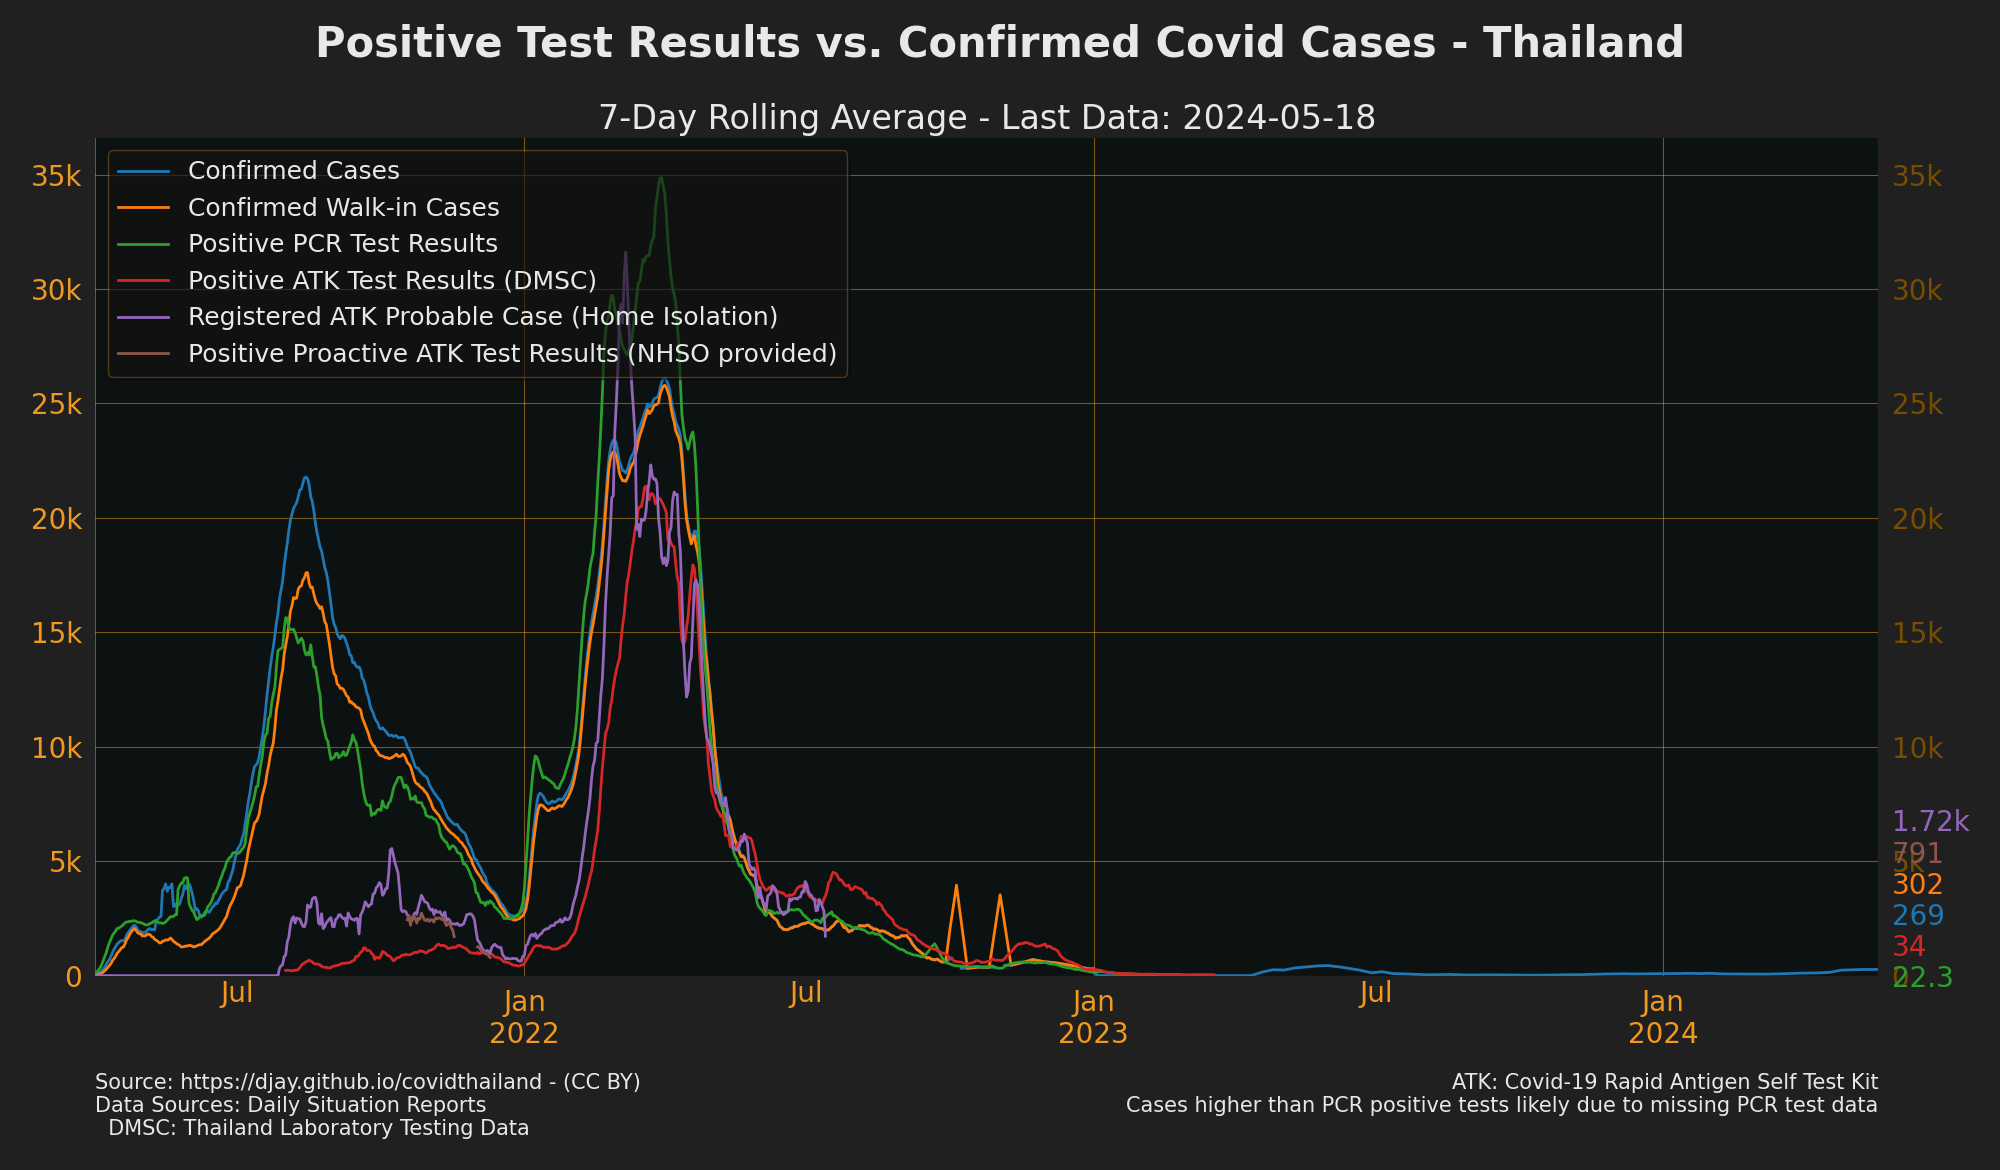
- Confirmed cases excludes ATK Positives (unless they also had a positive PCR test). This is similar to most countries however some like Malaysia, India and [UK count antigen tests in both tests and confirmed cases](https://coronavirus.data.gov.uk/details/about-data#testing-capacity)
- [There are more confirmed cases than positives in Thailand's testing data](https://practical-ritchie-cca141.netlify.app/outputs#more-cases-than-positive-results), this could be for various
reasons but could make the positive rate lower.
- Sources: [Daily situation Reports](downloads.md#dl-situation-reports), [DMSC: Thailand Laboratory testing data](downloads.md#dl-testing)
## PCR Tests by Health District
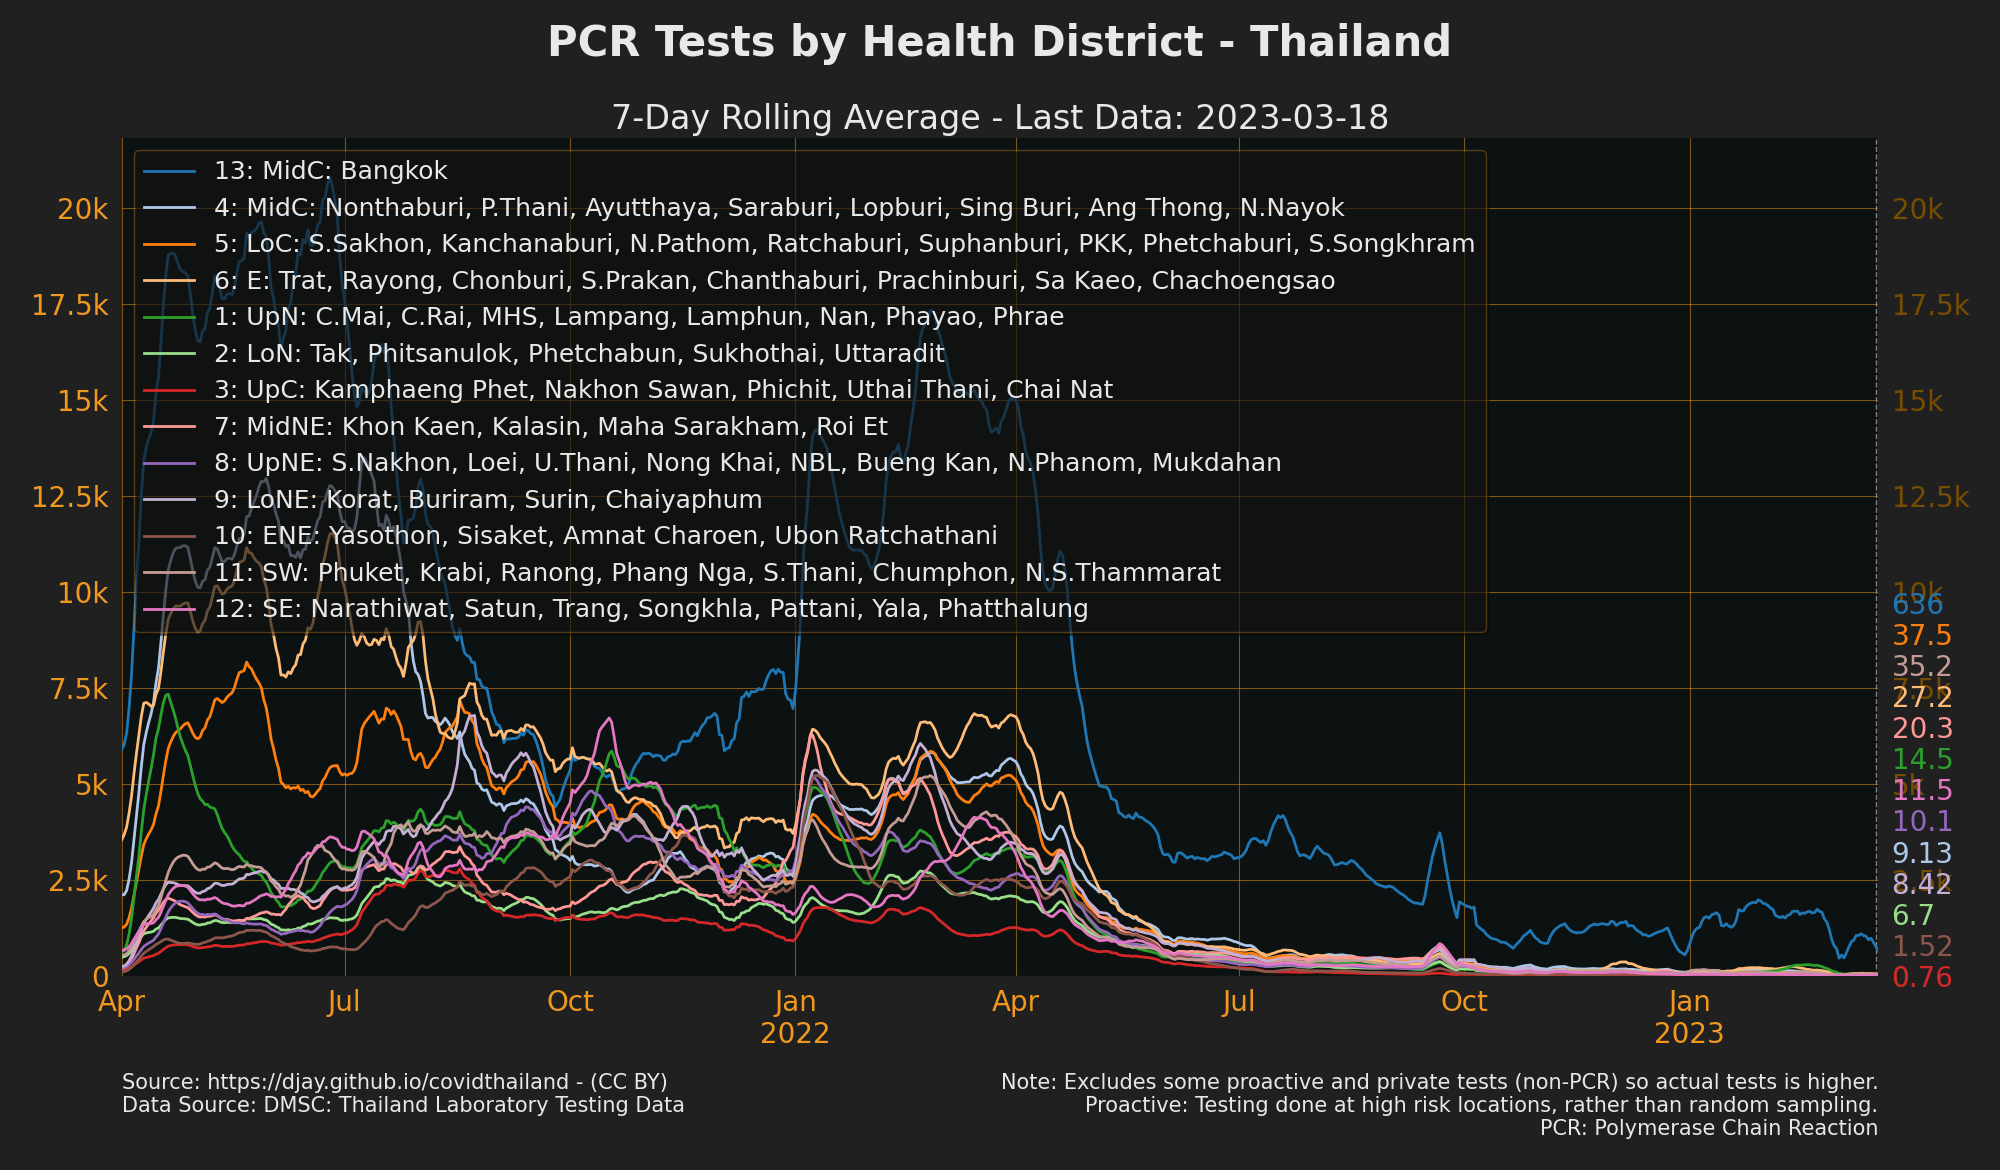
- [Tests by health area: Full Year](https://practical-ritchie-cca141.netlify.app/outputs/tests_area_daily_all.png)
- *NOTE* Excludes some proactive tests (non-PCR) so actual tests is higher
- Source: [DMSC: Thailand Laboratory testing data](downloads.md#dl-testing)
Shows Deaths from all causes in comparison to the min, max and mean of Deaths from the 5 years pre-pandemic.
- *Note: there are many possible factors that alter deaths up or down other than uncounted Covid Deaths*
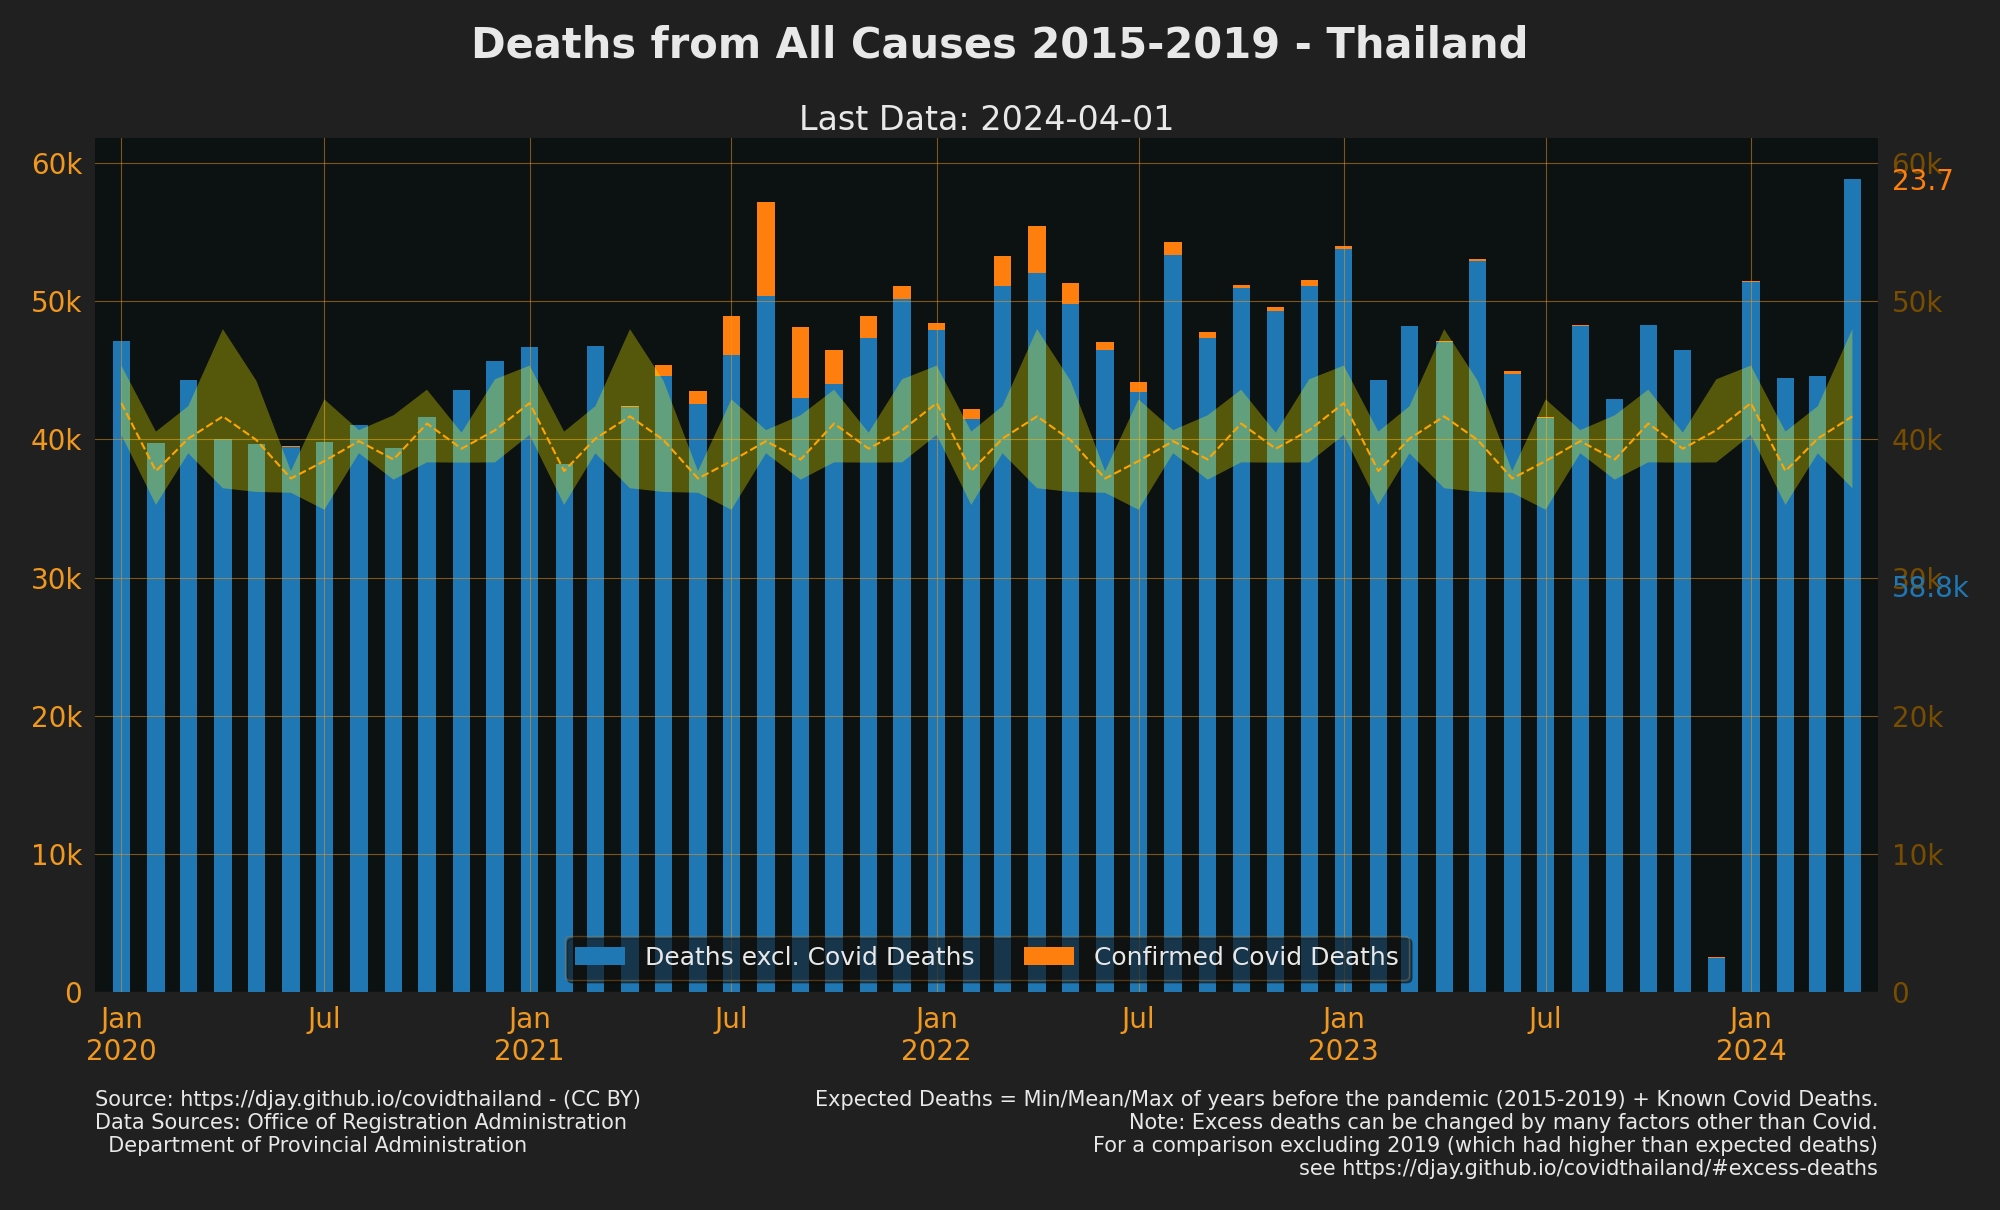
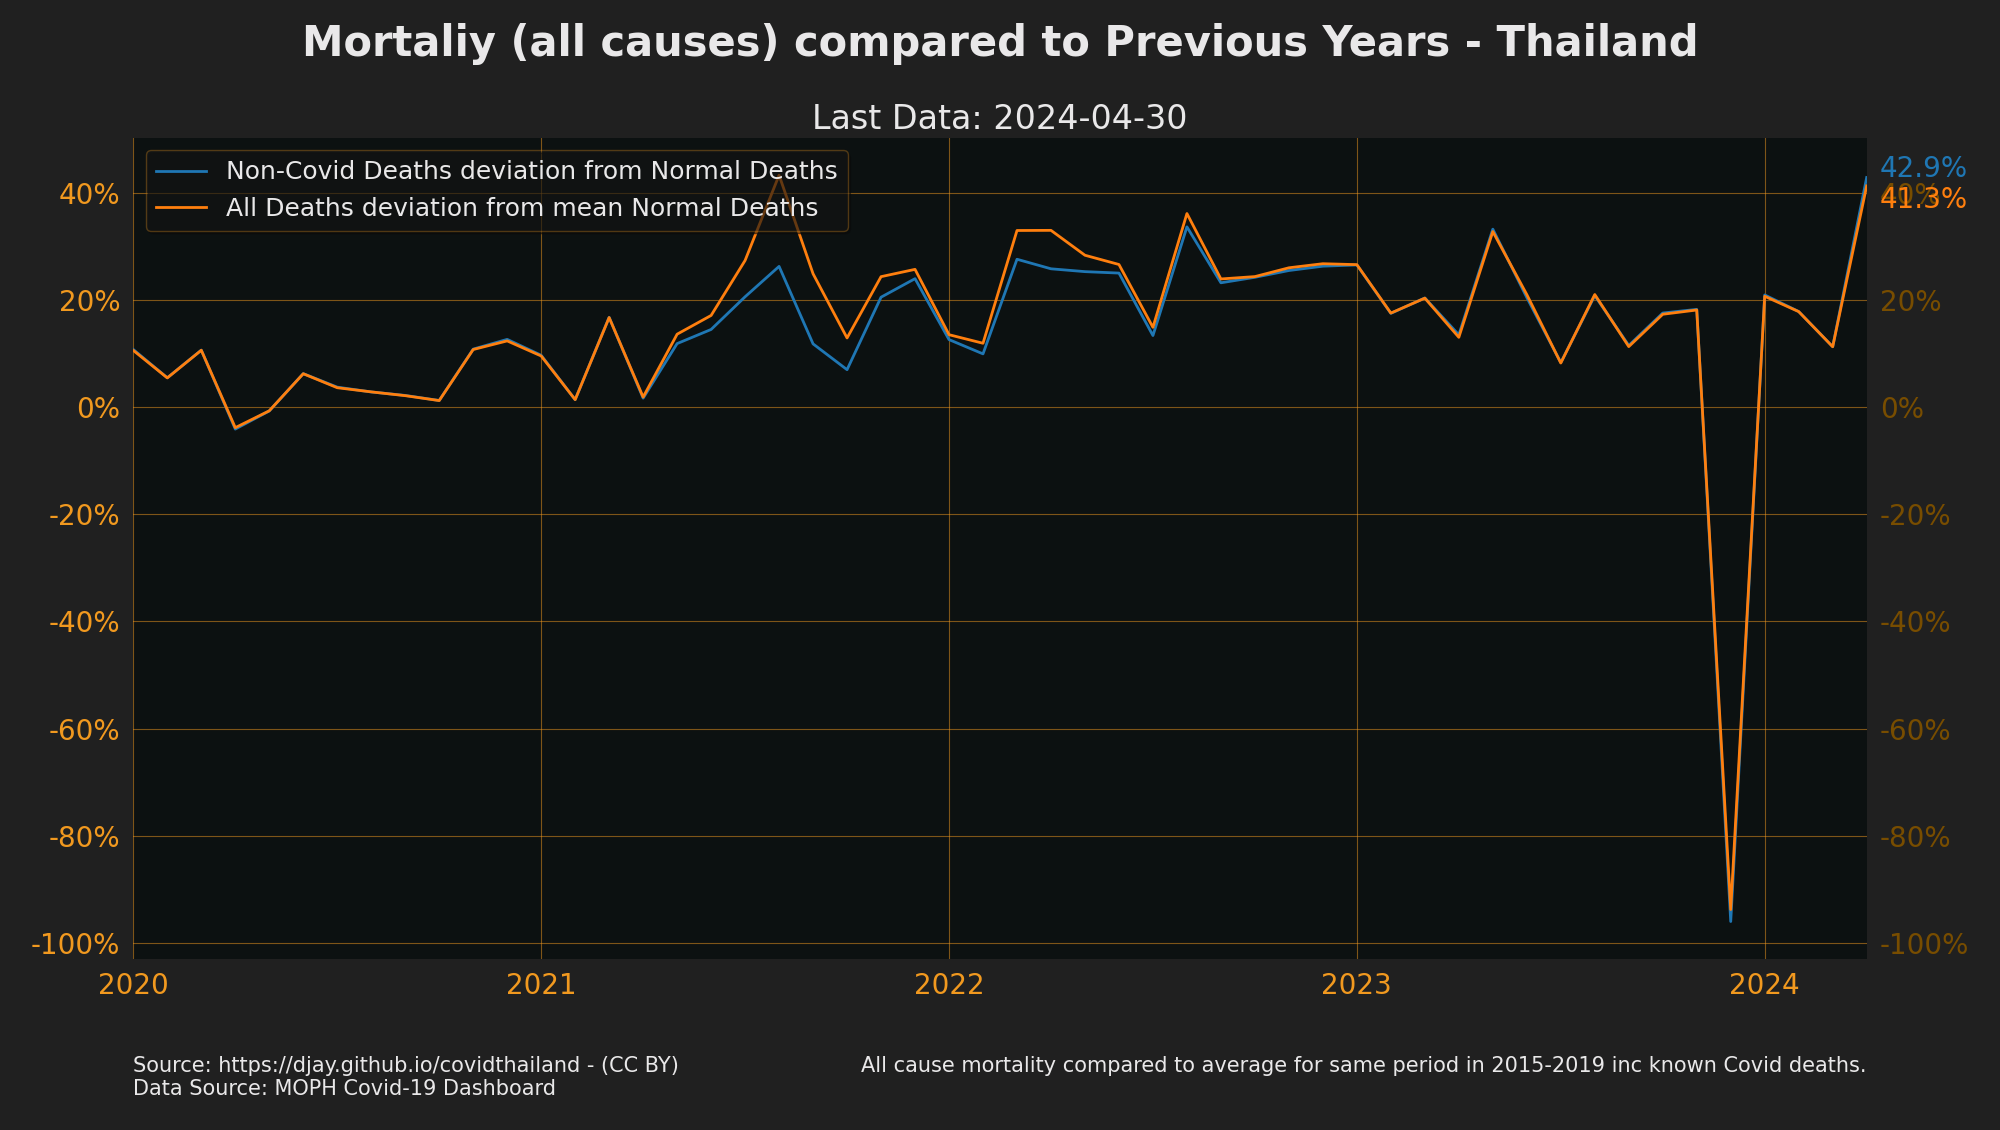
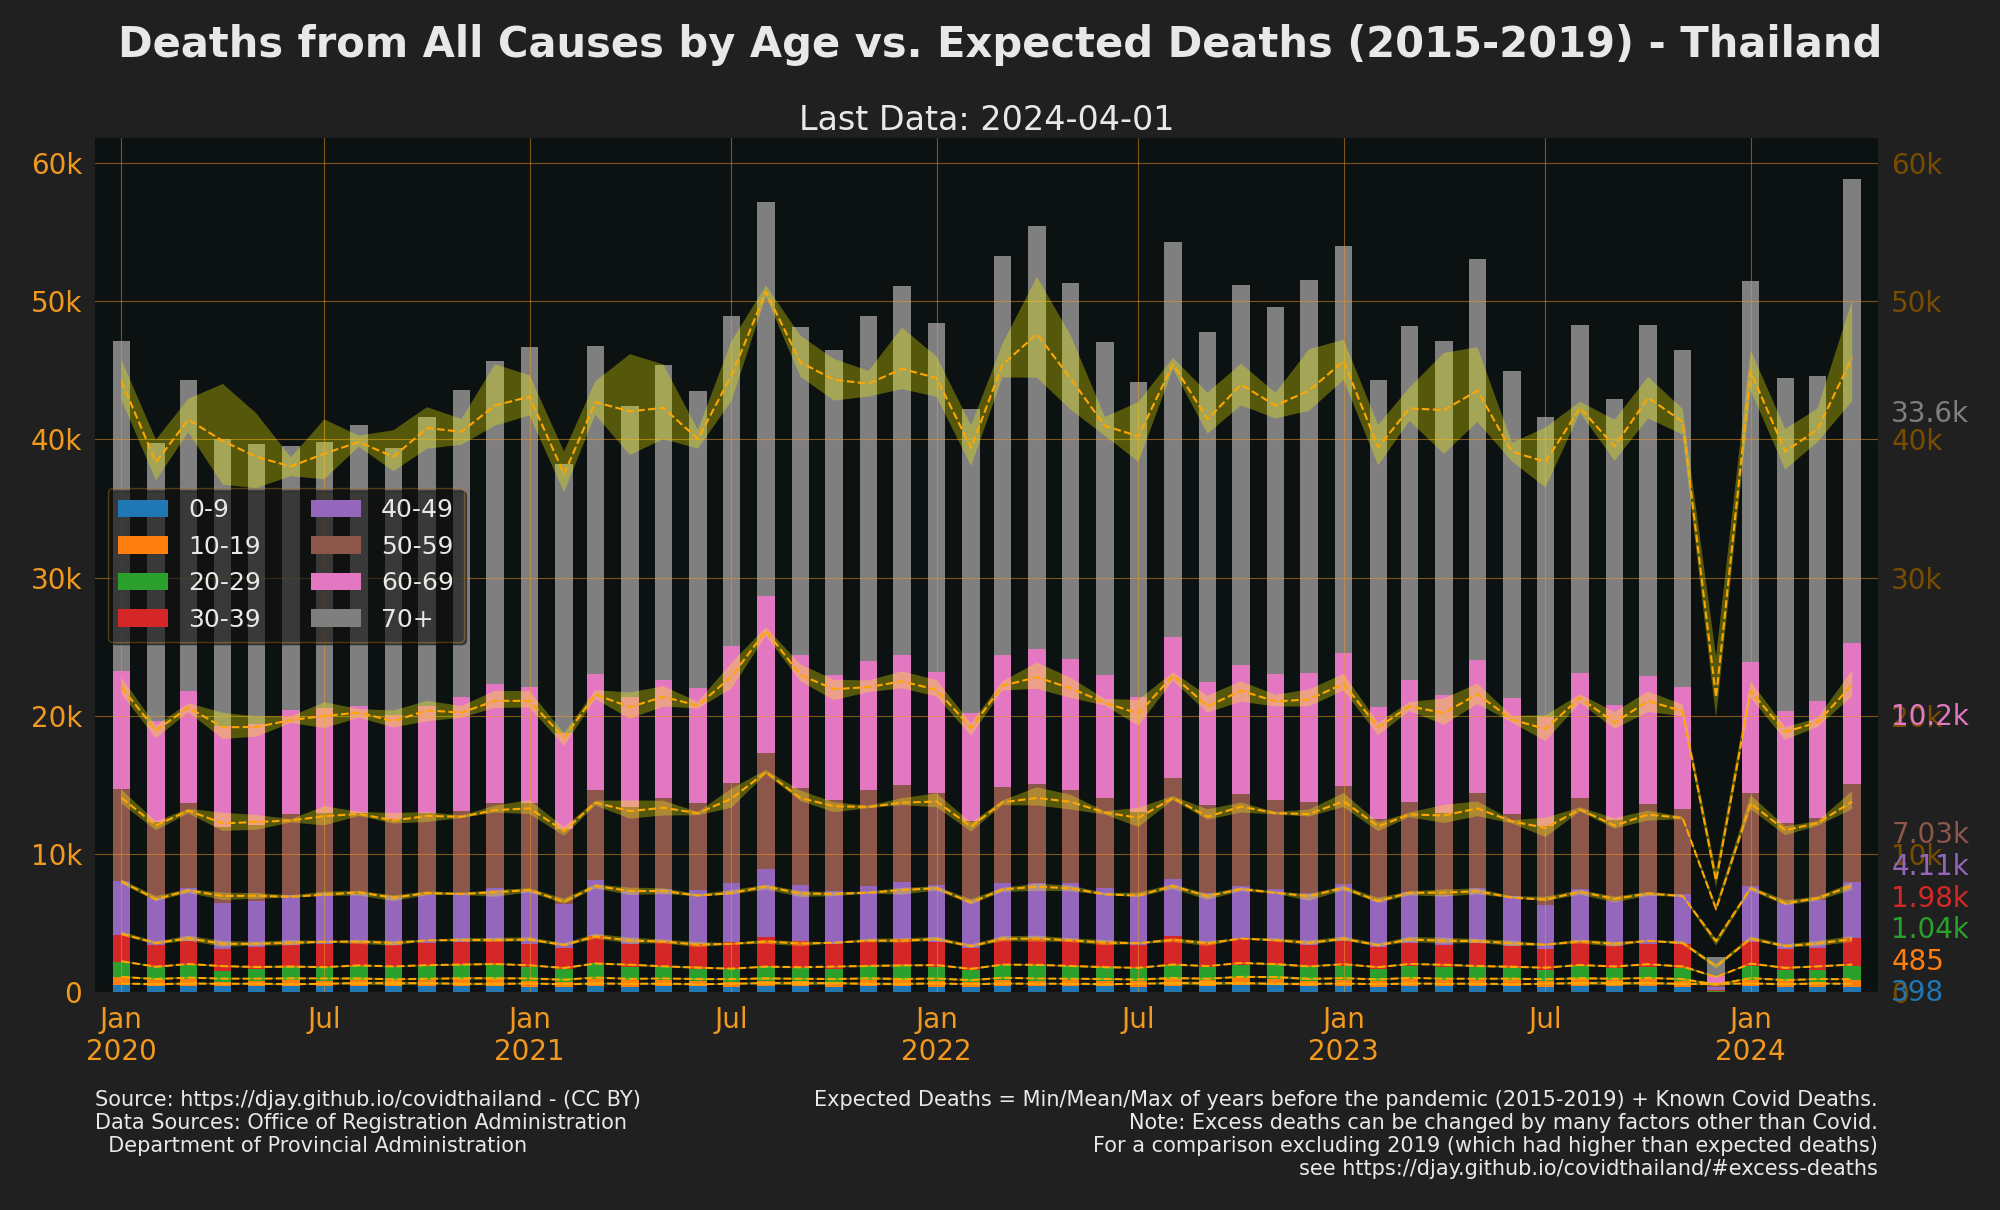
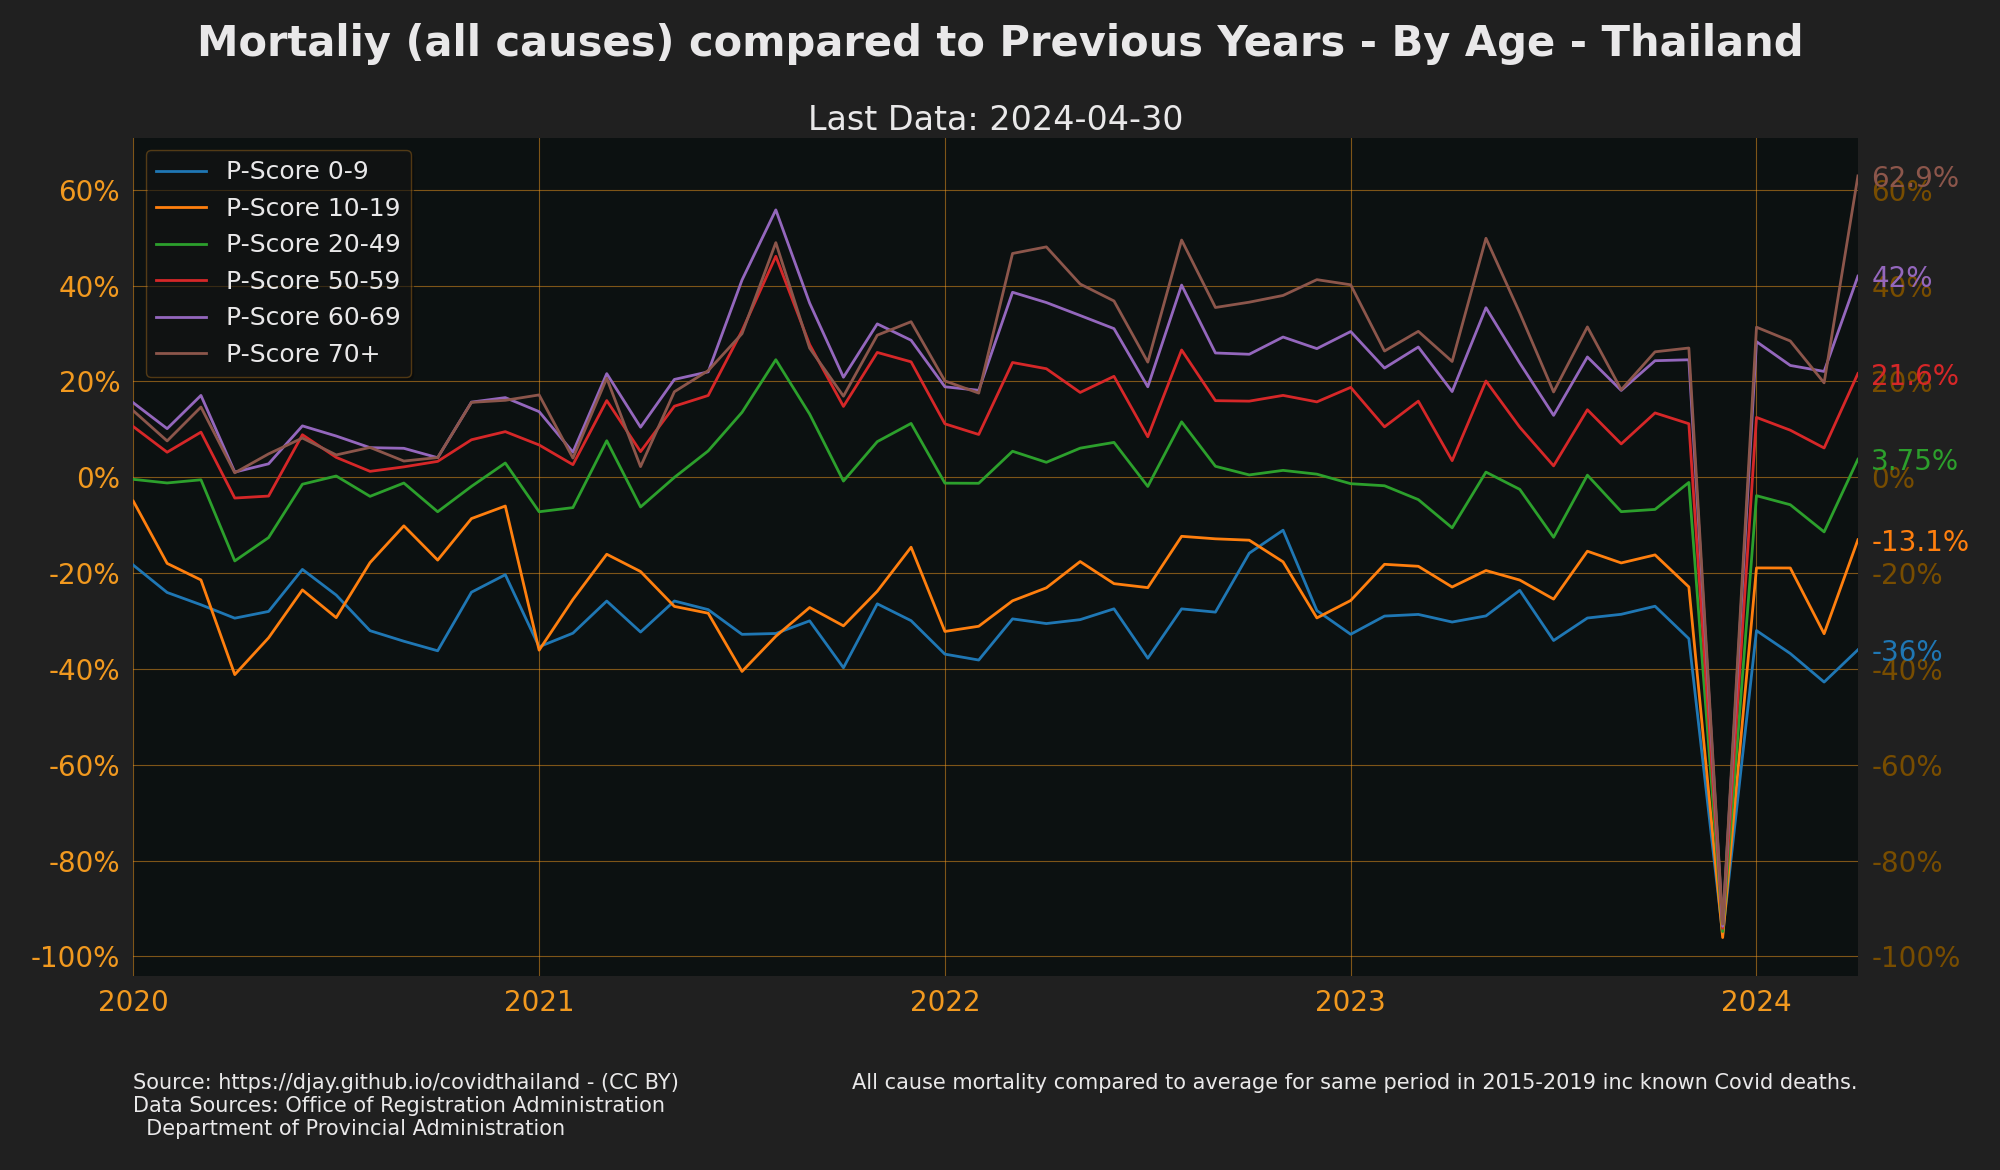
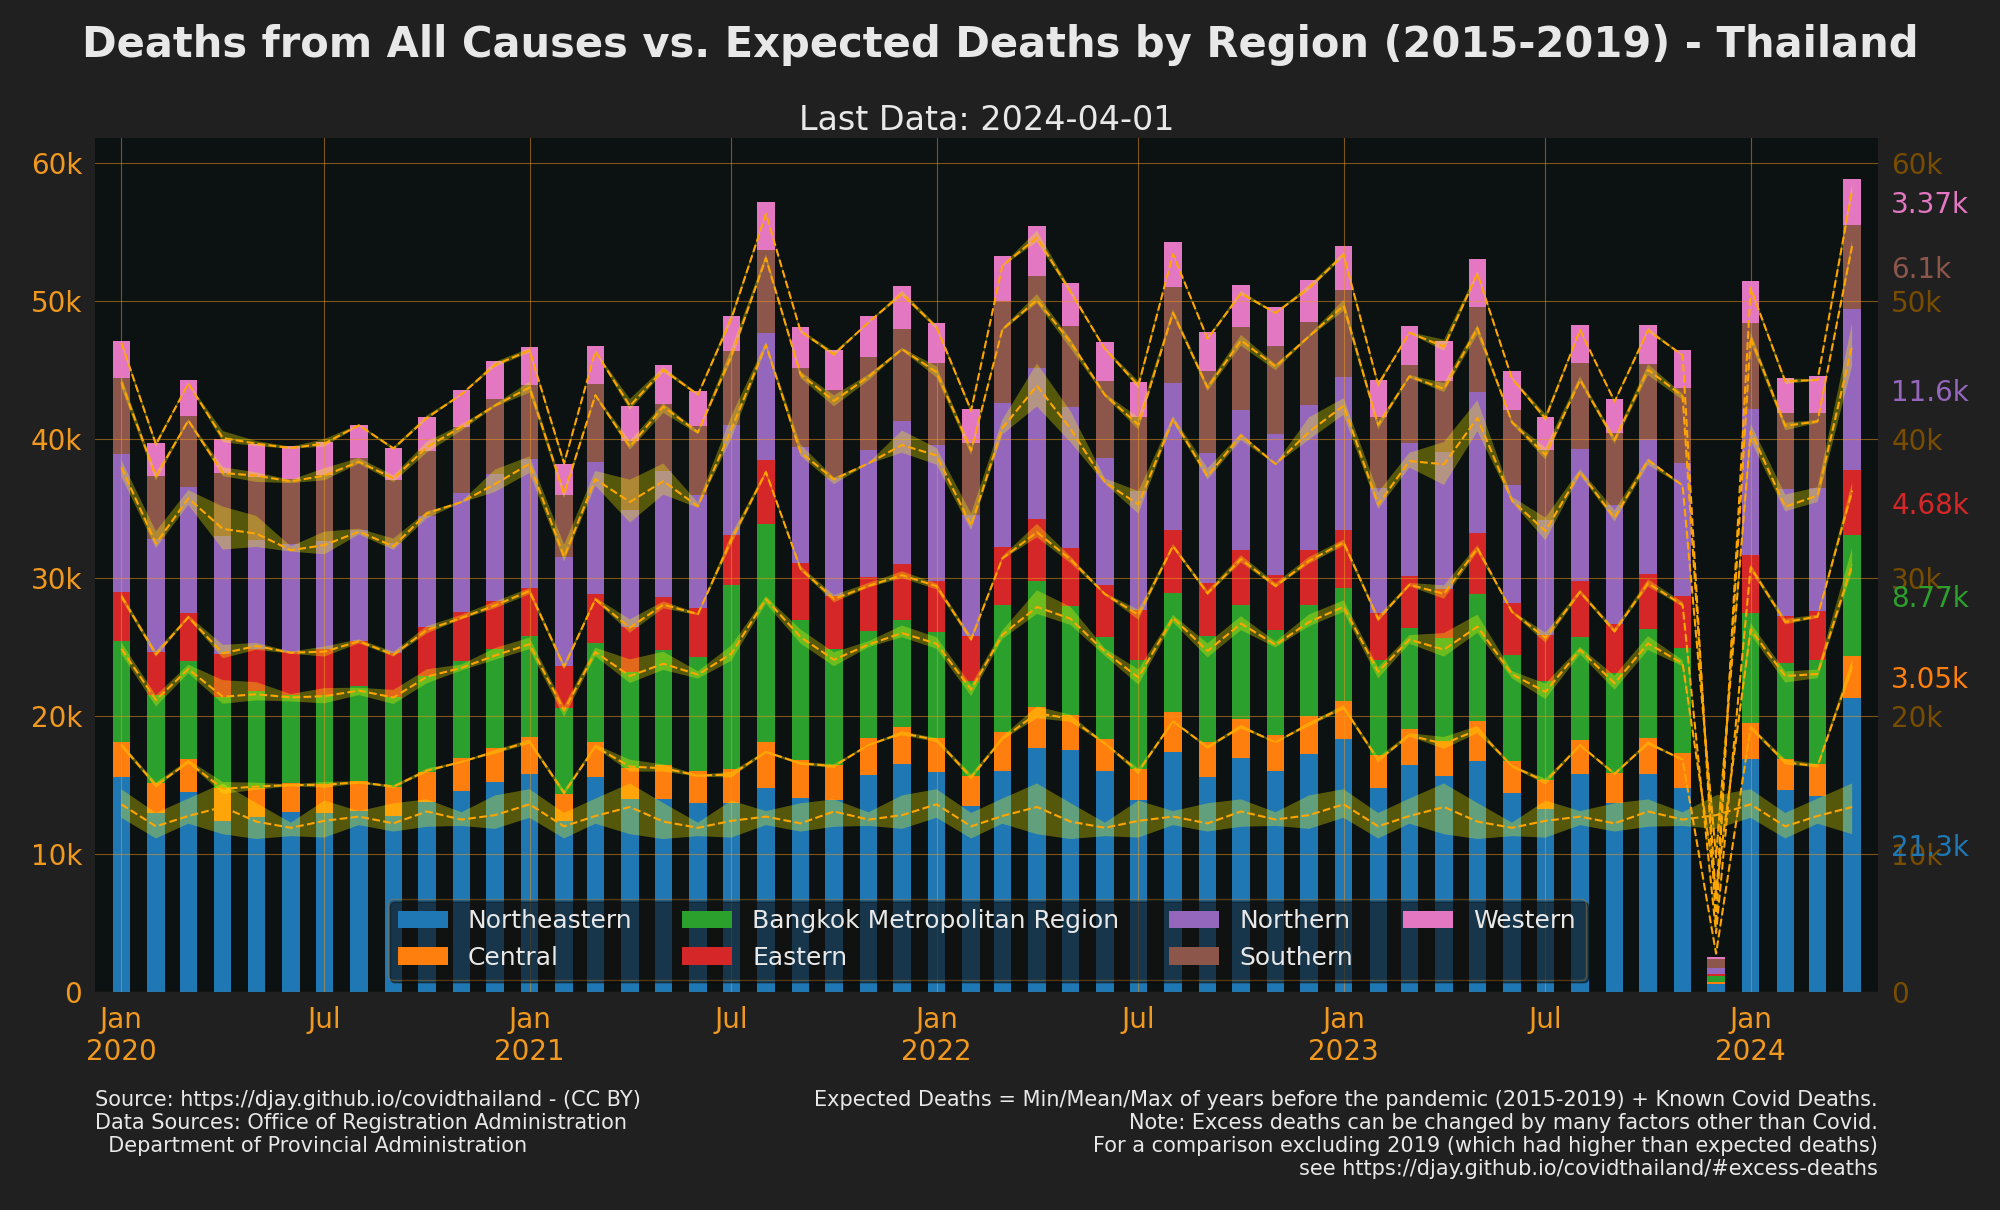
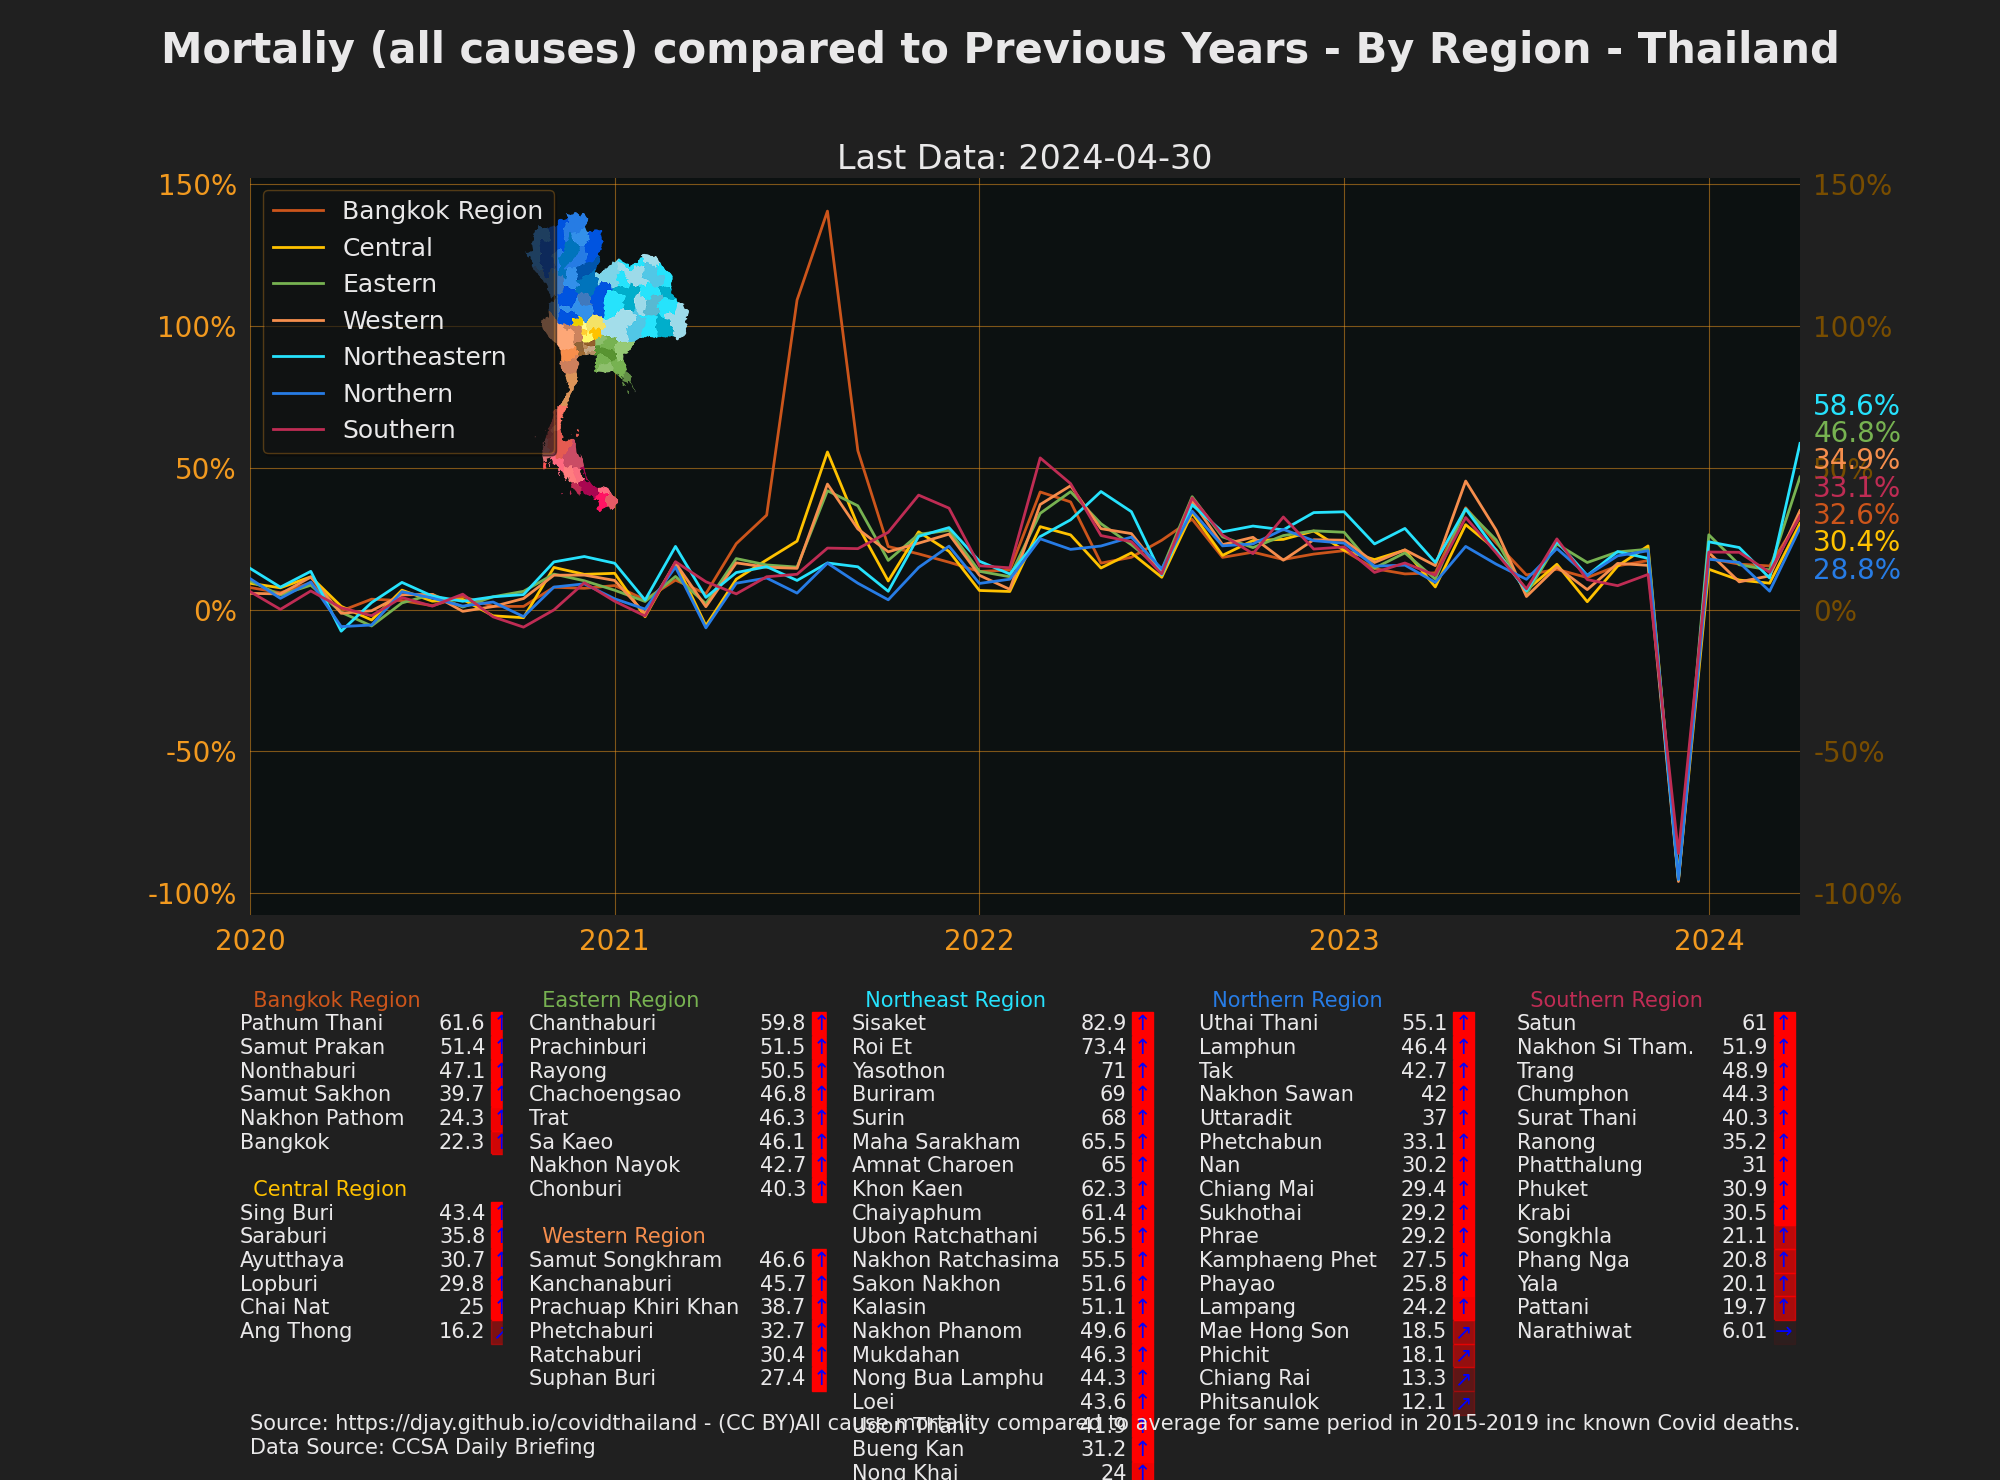
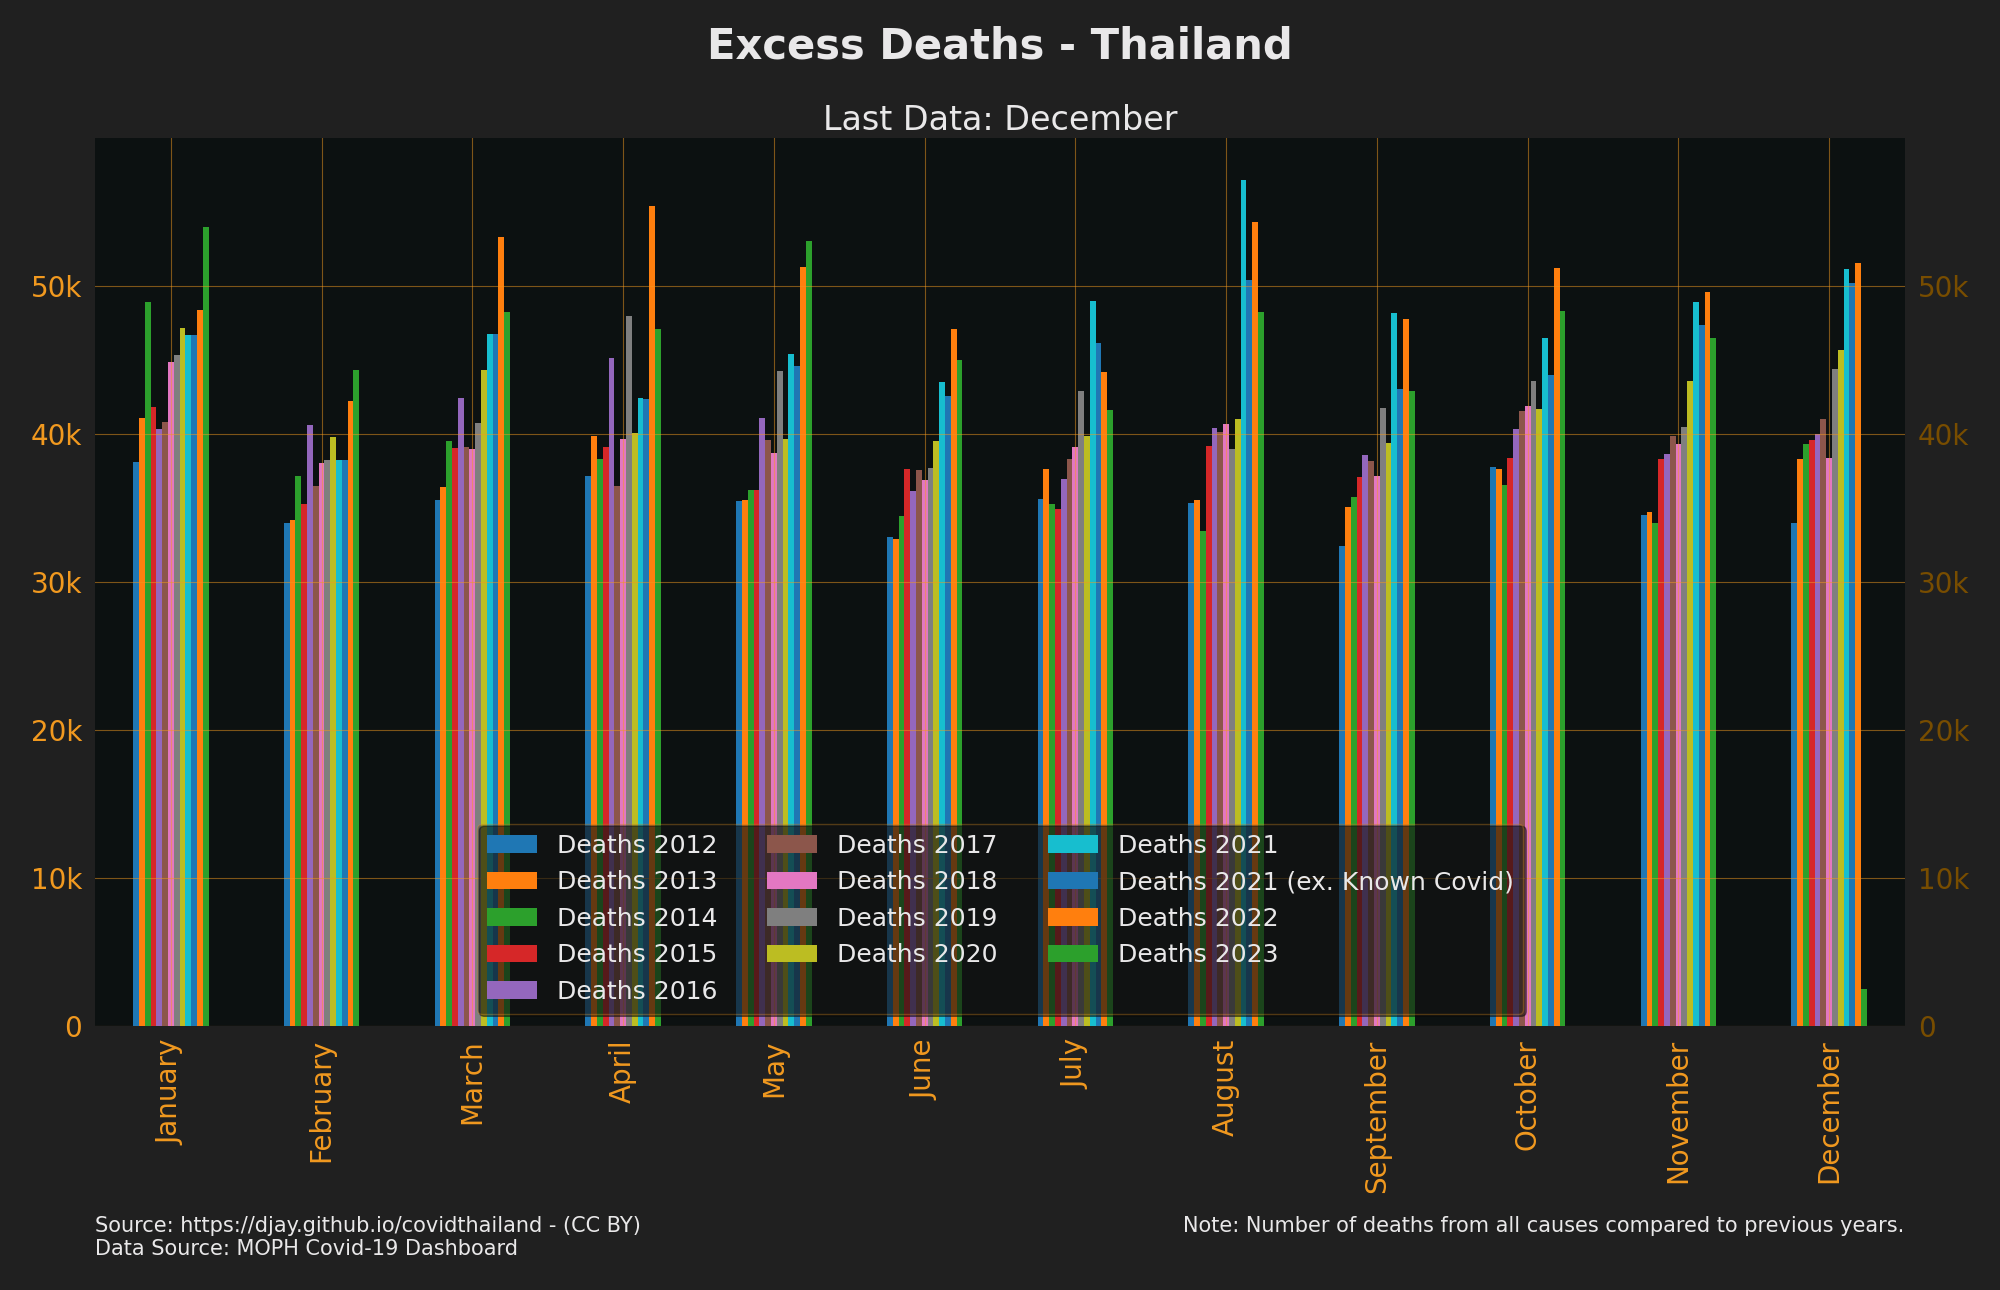
- [2019 had an unusual increase in deaths compared to the previous 4 years](https://practical-ritchie-cca141.netlify.app/outputs/deaths_excess_years_all.png) but is unclear yet why. Excess deaths Plots excluding 2019
[All](https://practical-ritchie-cca141.netlify.app/outputs/deaths_excess_covid_all.png) | [by region](https://practical-ritchie-cca141.netlify.app/outputs/deaths_excess_region_all.png) | [by age](https://practical-ritchie-cca141.netlify.app/outputs/deaths_excess_age_bar_all.png) show clearer baseline more similar to other countries.
- Compare Excess deaths across countries with [OWID Excess Deaths](https://ourworldindata.org/excess-mortality-covid#excess-mortality-p-scores-by-age-group) or
[Economist Excess Death Tracker](https://www.economist.com/graphic-detail/coronavirus-excess-deaths-tracker).
- Source [Office of Registration Administration, Department of Provincial Administration](downloads.md#dl-deaths-all)

## Testing, isolation and Vaccine assistance
- Annoucements on free testing, free hospitalisation, free vaccines and rules changes
- English: [Thailand PRD Twitter](https://twitter.com/prdthailand) - [Thailand PRD FB](https://www.facebook.com/thailandprd)
- Thai: [ThaiGov Covid-19 FB](https://www.facebook.com/informationcovid19) - [MOPH Twitter](https://www.facebook.com/thailandprd)
- Stats: [DDC Dashboard](https://ddc.moph.go.th/covid19-dashboard/) - [MOPH Hospital Capacity](https://public.tableau.com/app/profile/karon5500/viz/moph_covid_v3/Story1) - [TheResearcherTH (Maps)](https://covid-19.researcherth.co/) - [IHME Forecasts](https://covid19.healthdata.org/thailand?view=cumulative-deaths&tab=trend) - [Reuters World Covid Tracker](https://graphics.reuters.com/world-coronavirus-tracker-and-maps/vaccination-rollout-and-access/)
- Call [1422](tel:1422) if you have Covid with mild symptoms
- With only a positive ATK you can register for [free support during home isolation](https://twitter.com/prdthailand/status/1479301770388000768).
- If you can't isolate at home you can opt for [free field hospital care](https://twitter.com/prdthailand/status/1479301770388000768) once confirmed with a PCR test
- You can sign up for this [early prevention clinical trial](https://form.typeform.com/to/v3lCPFrj?typeform-source=com.google.android.googlequicksearchbox) if you had symptoms less than 48 hours
- Call [1668](tel:1668) if you have Covid with [severe symptoms](https://twitter.com/prdthailand/status/1479301770388000768)
- Unsure of your risks with or without a vaccine? [AU Risk Calc](https://corical.immunisationcoalition.org.au/) (updated for omicron) - [UK Risk Calc](https://www.qcovid.org/Calculation) (based on delta?)
## How to contribute
- As the different sources of the data has increased so has the code needed fetch, extract and
display this data. All the code is fairly simple python however. It is a fun way to learn scraping
data and/or pandas and matplotlib.
- Find a [github issue](https://github.com/djay/covidthailand/issues) and have a go. Many are marked as suitable for beginners
- making new plots
- improve existing plots
- adding tests so it's faster to make future fixes
- improving scrapers that miss past data, e.g. vaccination reports
- [Spotting breaking updates](https://github.com/djay/covidthailand/actions) and submitting a pull request to revise the scraper
- If unsure if you are on the right track, submit a draft pull request and request a review
- Spotted a problem or got an idea how to improve? [Submit an issue](https://github.com/djay/covidthailand/issues) and then have a go making it happen.
- Got Questions? [Start a discussion](https://github.com/djay/covidthailand/discussions) or comment on an issue
### Install
- If you are using anaconda you will need to also run this
```sh
conda install -c conda-forge python-crfsuite
```
- To install (requires python >=3.9)
```sh
python -m venv .venv
.venv/bin/pip install -r requirements.txt
```
### Running just plots (or latest files)
The plots are produced from csv files made in covid_data.py.
1. Get the [latest datasets](https://github.com/djay/covidthailand/releases/download/1/datasets.tar.gz) release to speed up the process.
- Manually: extract [latest datasets](https://github.com/djay/covidthailand/releases/download/1/datasets.tar.gz)
into the top level of the project. It will put csv files into ```api``` and ```inputs/json``` folders.
- CLI: linux(or WSL); change into the root directory of your clone of the repository and then:
```sh
wget https://github.com/djay/covidthailand/releases/download/1/datasets.tar.gz && \
tar xzf datasets.tar.gz && \
rm datasets.tar.gz
```
2. You can run only the plot function using the USE_CACHE_DATA=True MAX_DAYS=0 env vars
- CLI (linux)
```sh
USE_CACHE_DATA=True MAX_DAYS=0 bin/python covid_plot.py
```
- IDE: setup a run profile in your IDE similar to this
```
{
"name": "covidthailand - plot",
"type": "python",
"request": "launch",
"program": "covid_plot.py",
"console": "integratedTerminal",
"env": {
"USE_CACHE_DATA":"True",
"MAX_DAYS":"0",
}
}
```
3. You can comment out parts of covid_plot.py to skip some plots.
- In USE_CACHE_DATA only ```*_3.svg``` files are produced. 3 is for 3rd wave (since April 2021).
- When debugging, to scrape just one part first, rearrange the lines in covid_data.py/scrape_and_combine so that the scraping function you want to debug gets called before the others do
### Running full code
1. Extract the [latest input files (~1.3G)](https://github.com/djay/covidthailand/releases/download/1/inputs.tar.gz).
This get the latest cache of documents to speed up scraping.
- Manually: extract [latest input files (~1.3G)](https://github.com/djay/covidthailand/releases/download/1/inputs.tar.gz)
into the top level of the project. It will put documents/json etc ```inputs/*``` folders.
- CLI: linux(or WSL); change into the root directory of your clone of the repository and then:
```sh
wget https://github.com/djay/covidthailand/releases/download/1/inputs.tar.gz && \
tar xzf inputs.tar.gz && \
rm inputs.tar.gz
```
- Manually
2. To build the CSV files needed for plotting from the inputs downloaded above, from the root directory of the repo, run:
```sh
USE_CACHE_DATA=True python covid_data.py
```
3. If many days have passed since the last run then return to step 1. or slightly slow but smaller download is to
download the [latest datasets](https://github.com/djay/covidthailand/releases/download/1/datasets.tar.gz) files
which will speed up dashboard scrapping which is the slowest part.
4. If you really need to ensure all the files are scraped again then
- To run the full scrape (warning this will take a long time as it downloads all the documents into a local cache)
```sh
bin/python covid_plot.py
```
### Running Tests (scraping)
- To run the tests (will only get files needed for tests)
```sh
bin/pytest
```
- To add a test
- Only add test data for dates where the format changed and so the scraper had to get updated. See commit history for dates where this happened or use code coverage.
- Logs from a full scrape can be used to also identify files/dates that are not scraped correctly
- if you are trying to add in past regression tests you can also use [```git blame covid_data.py```](https://github.com/djay/covidthailand/blame/45ab729d5cdba862de2c5940264f790a5504907a/covid_data.py) on the scraping function to see the dates that lines were added or changed. in some cases comments indicated important dates where code had to change.
- Add empty file in tests/*scraper_type*/*dl_name*.json
- for some tests can be use date of file instead or filename.date.json (the date is ignored but helps for readability)
- Run tests. This will download just the document needed for that test, scrape it and compare the results against the json.
- of course this will fail but you can look at the generated data and compare it to the original file or other sources to make sure it looks right
- If the results are correct there is commented out code in the test function to export the data to the test json file.
- if you are using vscode to run pytests you need to refresh the tests list at this point for some reason
- Note that not all scrapers have a test framework setup yet. But follow the existing code to add one or ask for help.
### Building Site
```
$ sudo gem update bundler
$ bundle config set --local path vendor/bundle
$ bundler install
$ bundle exec jekyll serve
```
# Contributors
- [Dylan Jay](https://github.com/djay)
- [Vincent Casagrande](https://github.com/flyingvince)
- [Peter Scully](https://github.com/pmdscully)
- [Jonathan Barratt](https://github.com/reduxionist) sponsored by [Intelligent-Bytes](https://github.com/intelligent-bytes)
- [Reinhold Lauer](https://github.com/modiholodri)
- join us?
# About

Made with python/pandas/matplotlib. Dylan Jay gave a talk on how easy it is to extract data from PDFs
and powerpoints and plot data at [Bangkok's Monthly ThaiPy Event](https://www.meetup.com/en-AU/ThaiPy-Bangkok-Python-Meetup) [Video: "How I scraped Thailand's covid data" (1h mark)](https://www.facebook.com/watch/live/?v=2890282134582879)
Why do this? Originally to answer the question ["Was Thailand doing enough testing?"](https://practical-ritchie-cca141.netlify.app/outputs) for myself and because too many people were wrong on the internets.
## License
!
This work is licensed under a Creative Commons Attribution 4.0 International License.
## Other sources of visualisations/Data for Thailand
- [Our World in Data: Thailand Profile](https://ourworldindata.org/coronavirus/country/thailand?country=~THA#what-is-the-daily-number-of-confirmed-cases) - the best way to compare against other countries
- [Pete Scully: COVID-19 Thailand Public Data](https://petescully.co.uk/research/covid19-thailand-dashboards/) for added visualisations and comparisons
- [The Researcher Covid Tracker](https://covid-19.researcherth.co)
- [Stefano Starita](https://twitter.com/DrSteStarita) - more excellent analysis and visualisations
- [Richard Barrow](https://www.facebook.com/richardbarrowthailand) - maybe the fastest way to get COVID-19 updates in English
- Thai Gov news feeds
- [Thai Gov Covid Information: FB](https://www.facebook.com/informationcovid19) - has daily briefing infographics and broadcast (eng and thai) updated quickly
- [Thai Gov Spokesman: FB](https://www.facebook.com/ThaigovSpokesman),
- [Thai Government PR: FB](https://www.facebook.com/thailandprd),
- [Ministry of Health: Twitter](https://twitter.com/thaimoph),
- [DMSC PR: FB](https://www.facebook.com/DMSc.PR.Network)
- [MOPH ArcGIS](https://mophgis.maps.arcgis.com/apps/opsdashboard/index.html#/210413ebb5ff49bb8914808af6473322) - PUI + worldwide covid stats
- [MOPH OPS Dashboard: ArcGIS](https://mophgis.maps.arcgis.com/apps/opsdashboard/index.html#/bcd61791c8b441fa9224d129f28e8be0?) - current usage of hospital resource but seems no longer updated (since mid last year?)
- [Institute for Health Metrics and Evaluation](http://www.healthdata.org/covid/data-downloads) - COVID estimates including mobility estimates from mobile phone data
## Change log
- No longer updated. see [commits](https://github.com/djay/covidthailand/commits/main) instead
- 2021-08-16 - Move ATK to tests plot and remove from types plot
- 2021-08-16 - Plots of more age ranges for deaths, excess deaths and cases
- 2021-08-15 - Dashboard parsing for provinces and ages with downloads
- 2021-08-02 - Add ATK cases parsing from dashboard and put in case_types plot
- 2021-07-30 - Add plots for excess deaths
- 2021-07-18 - Add data on vaccines by manufacturer from vaccine slides
- 2021-07-17 - Add estimate of death ages
- 2021-07-13 - Remove import vaccines due to coldchain data being restricted
- 2021-07-10 - Switch province plots to per 100,000
- 2021-07-10 - Put actuals on main case plots
- 2021-06-29 - Use coldchain data to plot deliveries and province vac data
- 2021-06-22 - Add trending provinces for contact cases
- 2021-06-12 - Add vaccination daily and improve cumulative vaccinations
- 2021-06-05 - update vaccination reports to parse summary timeline data only (missing source)
- 2021-06-30 - death reasons and hospitalisation critical plots
- 2021-05-21 - Estimate of infections from deaths
- 2021-05-18 - Include prisons as separate province/health district (because briefings do)
- 2021-05-15 - improve highest positive rate plot to show top 5 only
- 2021-05-10 - parse unofficial RB tweet to get cases and deaths earlier
- 2021-05-07 - add trending up and down provinces for cases
- 2021-05-06 - add top 5 fully vaccinated provinces
- 2021-05-05 - added recovered to active cases
- 2021-05-04 - plots of deaths and vaccinations
- 2021-04-28 - rolling averages on area graphs to make them easier to read
- 2021-04-25 - Add graph of cases by risk and active cases (inc severe)
- 2021-04-25 - Scrape hospitalisation stats from briefing reports
- 2021-04-23 - Fixed mistake in testing data where private tests was added again
- 2021-04-22 - data for sym/asymptomatic and pui private vs pui public
- 2021-04-20 - Added case age plot
- 2021-04-18 - Added clearer positive rate by district plot and made overall positive rate clearer
- 2021-04-15 - Quicker province case type breakdowns from daily briefing reports
- 2021-04-13 - get quicker PUI count from
- 2021-04-12 - Put in "unknown area" for tests and cases by district so totals are correct
- 2021-04-05 - add tweets with province/type break down to get more up to date stats
.github-corner:hover .octo-arm{animation:octocat-wave 560ms ease-in-out}@keyframes octocat-wave{0%,100%{transform:rotate(0)}20%,60%{transform:rotate(-25deg)}40%,80%{transform:rotate(10deg)}}@media (max-width:500px){.github-corner:hover .octo-arm{animation:none}.github-corner .octo-arm{animation:octocat-wave 560ms ease-in-out}}