https://github.com/dmey/extended-boxplots
Generator of extended box plots
https://github.com/dmey/extended-boxplots
box-plots python statistics
Last synced: 3 months ago
JSON representation
Generator of extended box plots
- Host: GitHub
- URL: https://github.com/dmey/extended-boxplots
- Owner: dmey
- License: mit
- Created: 2019-08-13T13:59:20.000Z (almost 7 years ago)
- Default Branch: master
- Last Pushed: 2019-09-11T19:07:11.000Z (almost 7 years ago)
- Last Synced: 2025-10-24T05:55:39.561Z (8 months ago)
- Topics: box-plots, python, statistics
- Language: Python
- Homepage:
- Size: 20.5 KB
- Stars: 1
- Watchers: 1
- Forks: 0
- Open Issues: 0
-
Metadata Files:
- Readme: README.md
- License: LICENSE.txt
Awesome Lists containing this project
README
# Extended BoxPlots [](https://badge.fury.io/py/Extended-BoxPlots)
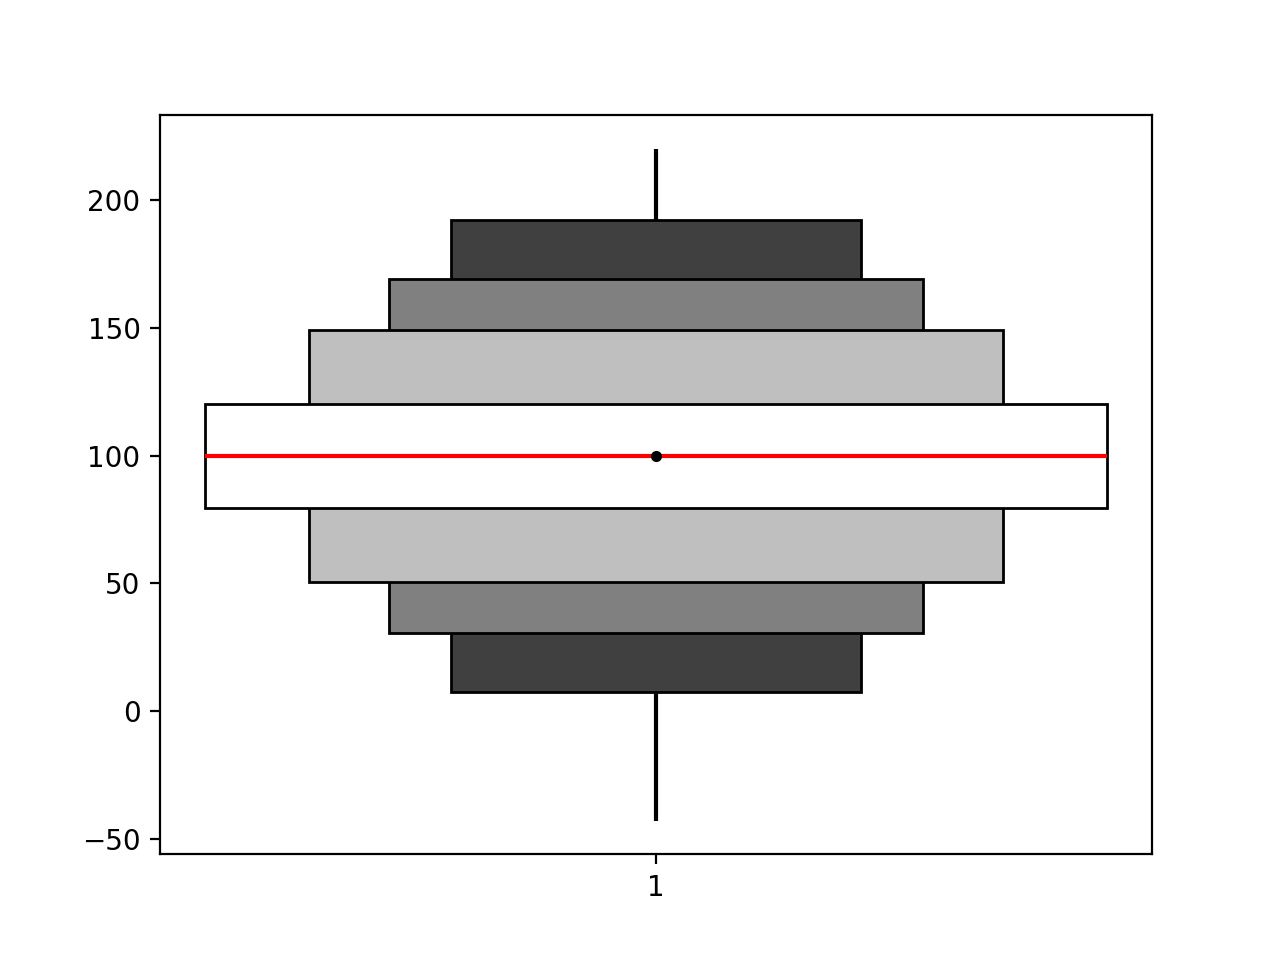
Extended box plot are customizable box plots drawn for a set of percentile pairs (c.f. p. 31 in [Harrell Jr (2014)][1]).
## Installation
```
pip install Extended-BoxPlots
```
## Example use
```py
import numpy as np
import matplotlib.pyplot as plt
from extended_boxplots import compute_extended_boxplot_stats, plot_extended_boxplot
# Create sample normal distribution
dist_norm = np.random.normal(100, 30, 100000)
# Compute extended box plot statistics
boxplot_stats = compute_extended_boxplot_stats(dist_norm)
# Plot the extended box plot
fig, ax = plt.subplots()
plot_extended_boxplot(ax, [boxplot_stats])
fig.savefig('extended_boxplot.svg', dpi=200)
```
## Versioning
This project uses [semantic versioning](https://semver.org/).
## Copyright and licence
Copyright 2018 D. Meyer. Licensed under [MIT](https://github.com/dmey/extended-boxplots/blob/master/LICENSE.txt).
[1]: http://biostat.mc.vanderbilt.edu/wiki/pub/Main/StatGraphCourse/graphscourse.pdf