https://github.com/dmnfarrell/pandastable
Table analysis in Tkinter using pandas DataFrames.
https://github.com/dmnfarrell/pandastable
data-analysis dataframe pandas plotting scientific tkinter
Last synced: about 1 year ago
JSON representation
Table analysis in Tkinter using pandas DataFrames.
- Host: GitHub
- URL: https://github.com/dmnfarrell/pandastable
- Owner: dmnfarrell
- License: other
- Created: 2015-03-16T12:26:38.000Z (over 11 years ago)
- Default Branch: master
- Last Pushed: 2025-03-25T11:26:21.000Z (over 1 year ago)
- Last Synced: 2025-05-10T00:47:01.973Z (about 1 year ago)
- Topics: data-analysis, dataframe, pandas, plotting, scientific, tkinter
- Language: Python
- Homepage:
- Size: 8.99 MB
- Stars: 646
- Watchers: 29
- Forks: 124
- Open Issues: 23
-
Metadata Files:
- Readme: README.md
- Changelog: CHANGES
- Contributing: CONTRIBUTING.md
- License: LICENSE
Awesome Lists containing this project
README
# pandastable
[](https://pypi.python.org/pypi/pandastable/)
[](https://www.gnu.org/licenses/gpl-3.0)
## Introduction

The pandastable library provides a table widget for Tkinter with plotting and data manipulation functionality.
It uses the pandas DataFrame class to store table data. Pandas is an open source Python library providing high-performance data structures and data analysis tools. Tkinter is the standard GUI toolkit for python. It is intended for the following uses:
* for python/tkinter GUI developers who want to include a table in their application that can store and process
large amounts of data
* for non-programmers who are not familiar with Python or the pandas API and want to use
the included DataExplore application to manipulate/view their data
* it may also be useful for data analysts and programmers who want to get an initial interactive look at their tabular data without coding
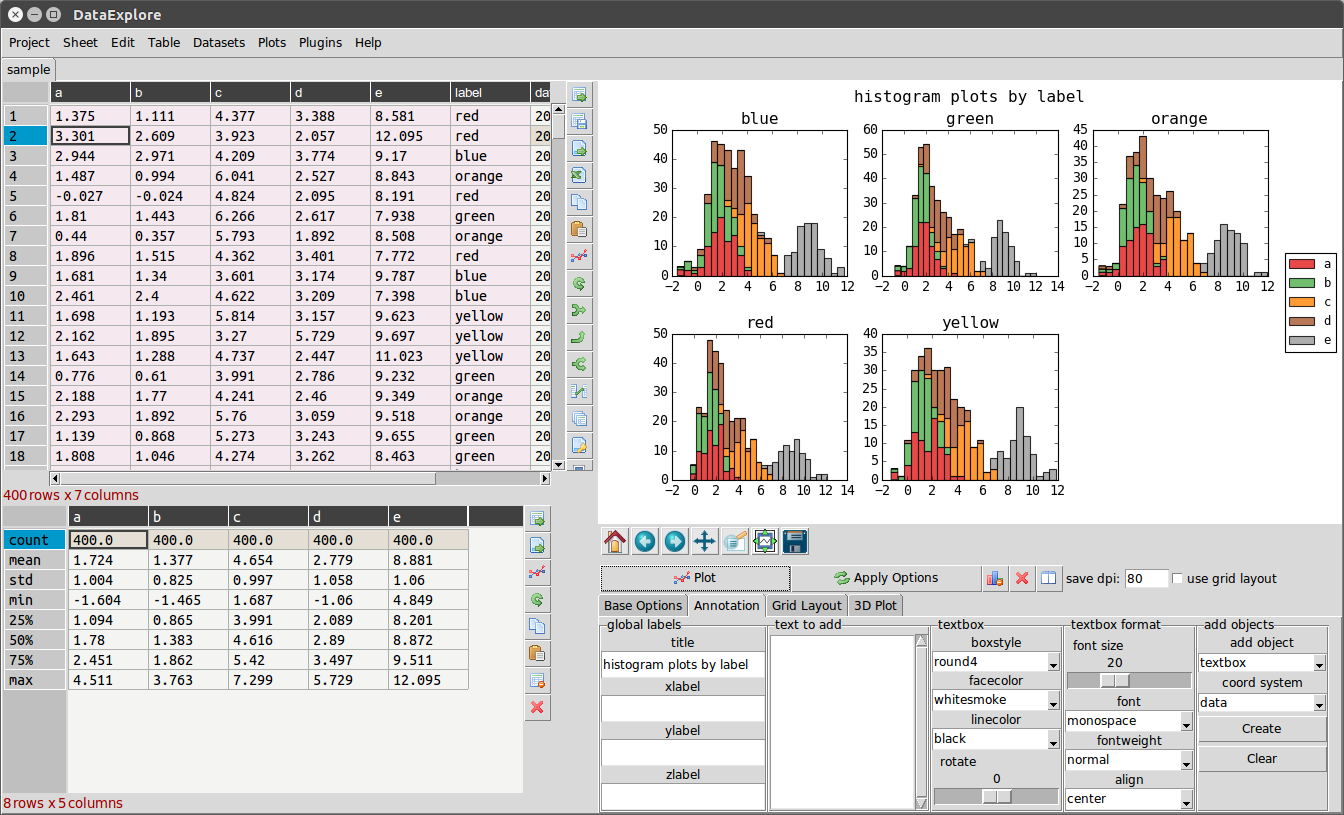
The DataExplore application using these classes is included in the distribution and is a self-contained application for educational and research use. Currently this focuses on providing a spreadsheet like interface for table manipulation withconfigurable 2D/3D plotting. A windows standalone installer is available that does not require Python installation.
**Documentation** is at http://pandastable.readthedocs.io/
**Note:** dataexplore has now been re-implemented in the Qt toolkit in a new app called [Tablexplore](https://github.com/dmnfarrell/tablexplore). If you're only interested in the application and not the Tkinter widget, the new app is recommended.
**Note 2:** pandas 1.0 no longer supports msgpack format so the project files now use pickle. You will not be able to open your old project files in pandastable versions >0.12.1.
## Installation
Requires python>=3.6 or 2.7 and numpy, matplotlib and pandas. These requirements should be satisfied automatically when using: (You may need to use pip3 to specify python version 3).
```pip install pandastable```
Install latest from github:
```pip install -e git+https://github.com/dmnfarrell/pandastable.git#egg=pandastable```
see the [docs](https://pandastable.readthedocs.io/en/latest/description.html#installation) for more details on installing.
## Current features
* add, remove rows and columns
* spreadsheet-like drag, shift-click, ctrl-click selection
* edit individual cells
* sort by column, rename columns
* reorder columns dynamically by mouse drags
* set some basic formatting such as font, text size and column width
* save the DataFrame to supported pandas formats
* import/export of supported text files
* rendering of very large tables is only memory limited
* interactive plots with matplotlib, mostly using the pandas plot functions
* basic table manipulations like aggregate and pivot
* filter table using built in dataframe functionality
* graphical way to perform split-apply-combine operations
## FAQ
*What version of Python?*
Python versions >=2.7 and >=3.6 are compatible. Python 3 is recommended if possible. For a similar table widget that works without pandas dataframes and has minimal dependencies see the previous incarnation, tkintertable.
*Why use Tkinter?*
Tkinter is still the standard GUI toolkit for python though it is sometimes disliked
for its outdated appearance (especially on linux) and somewhat limited widget set. However largely
because this library is based on an older one called tkintertable for drawing the table,
I have stuck with tkinter rather than start from scratch using another toolkit.
*Is this just a half-baked spreadsheet?*
Hopefully not. Some of the basic functions are naturally present since it's a table.
But there is no point in trying to mimic a proper spreadsheet app. pandas can do
lots of stuff that would be nice for a non-programmer to utilize and that might
not be available in a spreadsheet application.
*Are there other better tools for dataframe visualization?*
This depends as always on what is required. The ipython notebook is good for interactive use.
bokeh is an advanced interactive plotting tool using modern generation web technologies for in browser
rendering. This can handle dataframes. The goal of this project is to use DataFrames as the back end
for a table widget that can be used in a desktop appplication.
## The DataExplore application
Installing the package creates a command *dataexplore* in your path. Just run this to open the program.
This is a standalone application for data manipulation and plotting meant for education and basic data analysis.
See the home page for this application at http://dmnfarrell.github.io/pandastable/
## For programmers
* Check the [Code examples](https://pandastable.readthedocs.io/en/latest/examples.html) section in the documentation.
* See https://pandastable.readthedocs.io/en/latest/modules.html for API docs.
## Links
* http://openresearchsoftware.metajnl.com/articles/10.5334/jors.94/
* http://dmnfarrell.github.io/pandastable/
* https://youtu.be/Ss0QIFywt74
* [Interview about dataexplore](http://decisionstats.com/2015/12/25/interview-damien-farrell-python-gui-dataexplore-python-rstats-pydata/)
## Citation
If you use this software in your work please cite the following article:
Farrell, D 2016 DataExplore: An Application for General Data Analysis in Research and Education.
Journal of Open Research Software, 4: e9, DOI: http://dx.doi.org/10.5334/jors.94