https://github.com/doitintl/google-workspace-metrics
A Repository designed to give an overview on visualizing Workspace metrics in Data Studio
https://github.com/doitintl/google-workspace-metrics
Last synced: over 1 year ago
JSON representation
A Repository designed to give an overview on visualizing Workspace metrics in Data Studio
- Host: GitHub
- URL: https://github.com/doitintl/google-workspace-metrics
- Owner: doitintl
- License: mit
- Created: 2022-06-21T12:56:42.000Z (about 4 years ago)
- Default Branch: main
- Last Pushed: 2022-06-21T14:08:02.000Z (about 4 years ago)
- Last Synced: 2025-02-16T13:30:23.590Z (over 1 year ago)
- Size: 1.95 KB
- Stars: 0
- Watchers: 1
- Forks: 0
- Open Issues: 0
-
Metadata Files:
- Readme: README.md
- License: LICENSE
Awesome Lists containing this project
README
# google-workspace-metrics
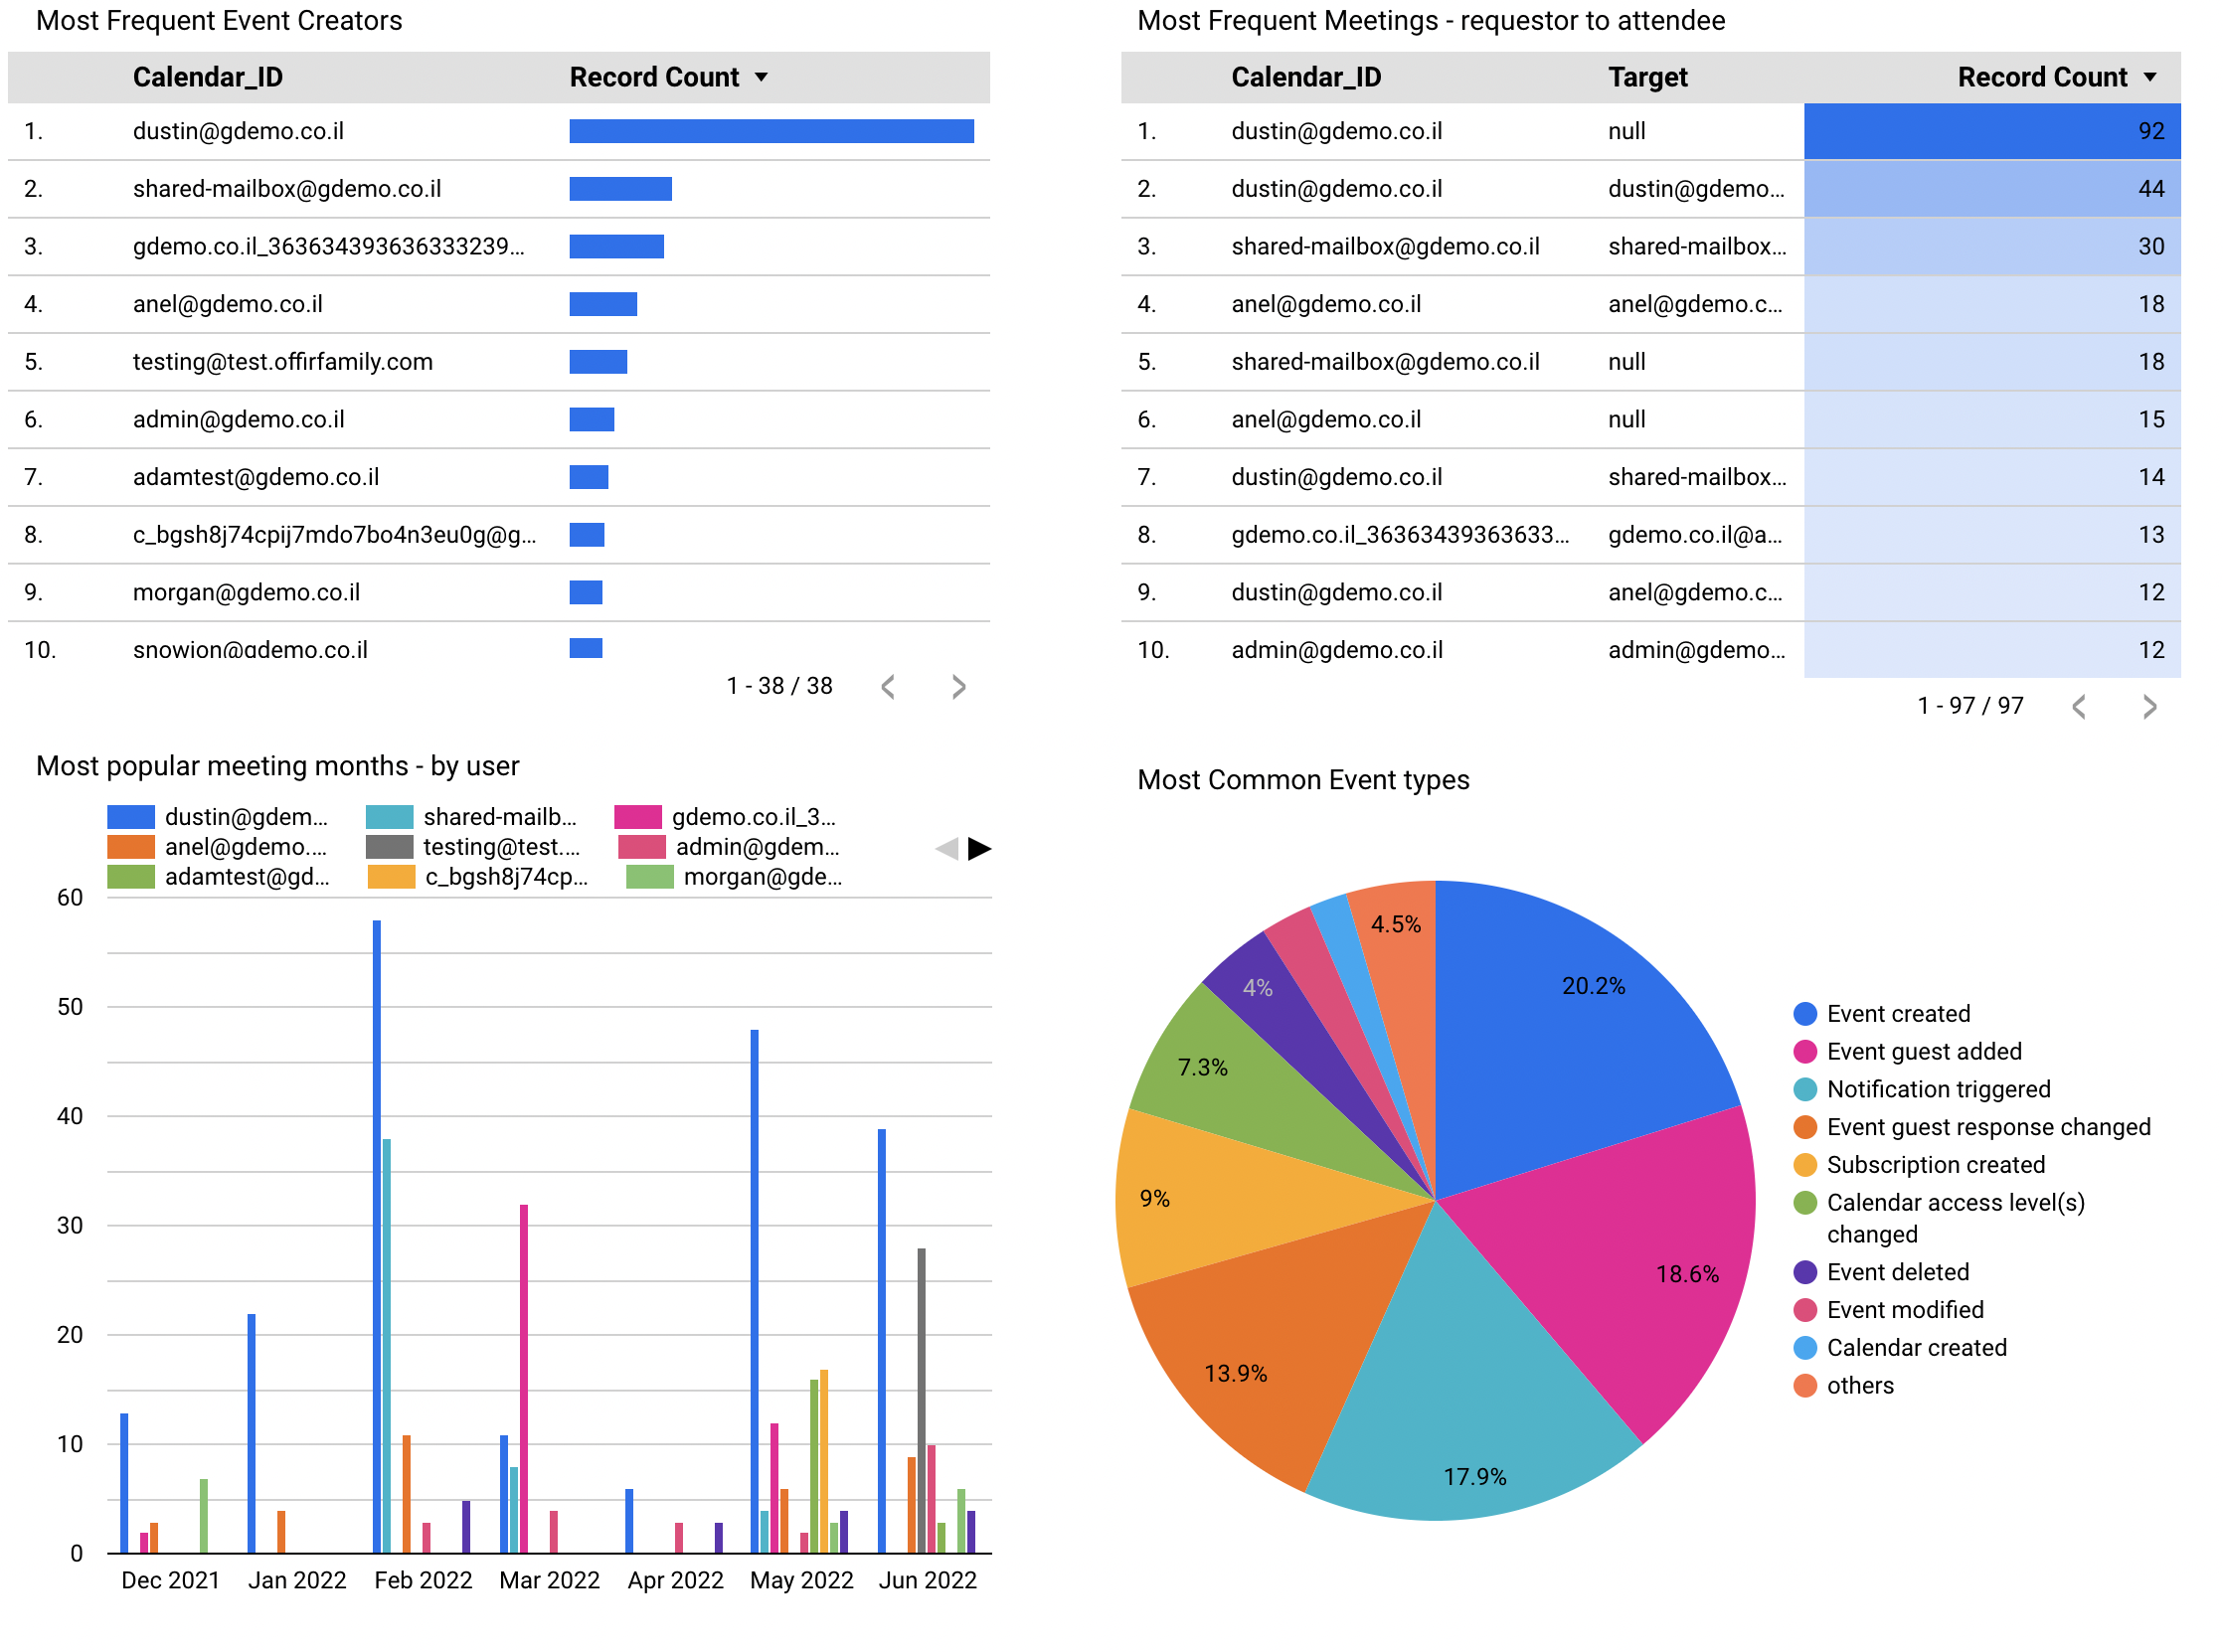
A Repository designed to give an overview on visualizing Workspace metrics in Data Studio, by creating a dashboard similar to the below.
# Getting started
## Prerequisites
In order to re-create this dashboard, a user must first export their Workspace Data into BigQuery, a guide on how to do this can be found here [^1].
The example dashboard & data source given here in this guide relates to Google Calendar data specifically, so to follow this guide, you will need to use Calendar data.
## Datasource
### 1.1 Create your datasource
Log in to Data Studio and create a new Data Source from the Workspace data you loaded into BigQuery. In this example we have showcased Google Calendar data, so to replicate this report the same data will be needed.
More information on creating data sources can be found here[^2].
A copy of the existing [data source] for this Dashboard, can be found within the embedded dashboard link below.
## Dashboard
### 2.1 Copy the dashboard
Create a copy of the [public dashboard](https://datastudio.google.com/embed/reporting/bec23acc-8445-4205-ae1b-947b04166290/page/XEduC).
You will be asked to select a new Datasource, you have to select the one you created in step 1. Click on create report and rename it as desired.
### 2.2 Modify the dashboard
Once the report is copied and all of the data is rendered, you can modify the dashboard to whatever format you see fit.
Examples could include modifying the default-daterange, colours, adding logos within the dashboard etc.
[^1] https://support.google.com/a/answer/9079365?hl=en
[^2] https://support.google.com/datastudio/topic/6370331?hl=en&ref_topic=7441382