https://github.com/douban/graph-index
index of Graphite & Diamond
https://github.com/douban/graph-index
Last synced: 3 months ago
JSON representation
index of Graphite & Diamond
- Host: GitHub
- URL: https://github.com/douban/graph-index
- Owner: douban
- License: mit
- Created: 2013-07-04T14:20:43.000Z (about 12 years ago)
- Default Branch: master
- Last Pushed: 2017-04-18T02:57:40.000Z (about 8 years ago)
- Last Synced: 2025-03-20T14:40:32.711Z (4 months ago)
- Language: Python
- Homepage:
- Size: 851 KB
- Stars: 128
- Watchers: 21
- Forks: 27
- Open Issues: 0
-
Metadata Files:
- Readme: README.md
- License: LICENSE
Awesome Lists containing this project
- awesome-starred - douban/graph-index - index of Graphite & Diamond (others)
README
# Graph Index
If you are using [Graphite](https://github.com/graphite-project/graphite-web) & [Diamond](https://github.com/BrightcoveOS/Diamond), graph-index will help you to build a wonderful index view !
* support regex search
* some pre-defined dashboard
* easily hack and a few lines of code
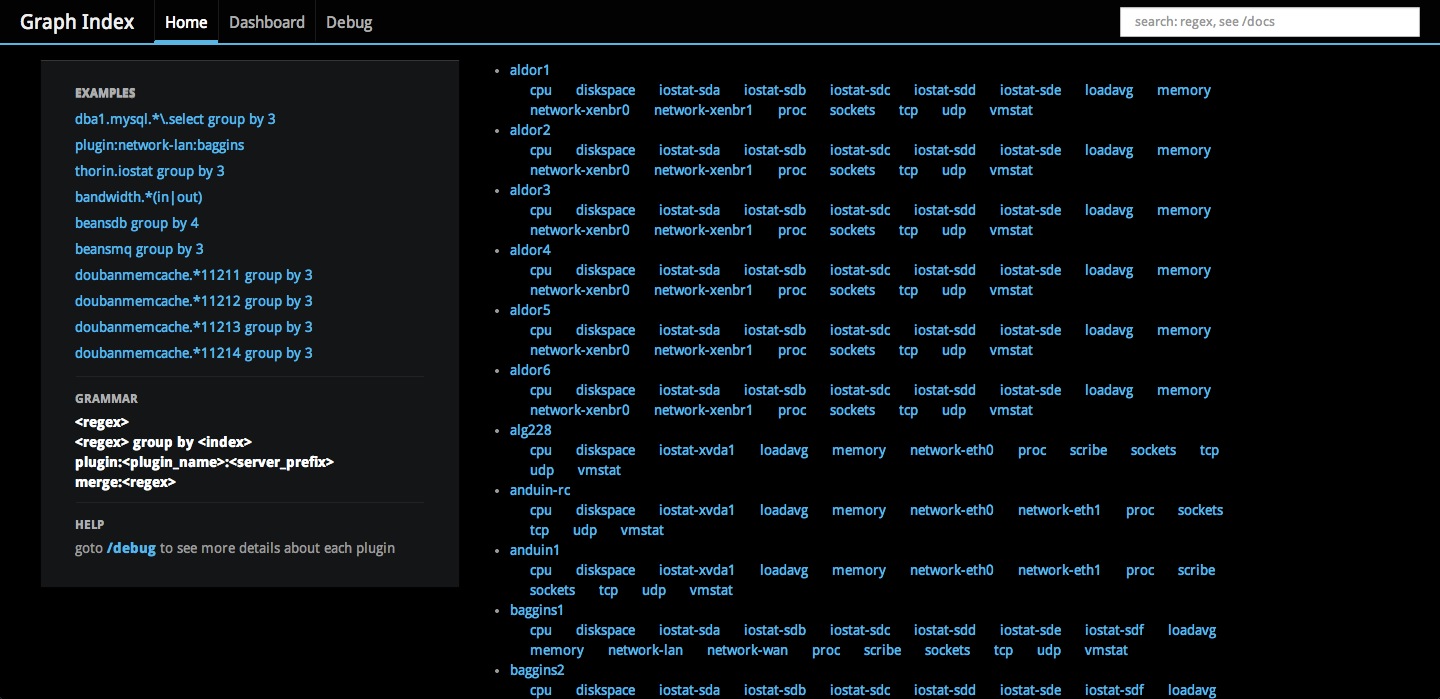
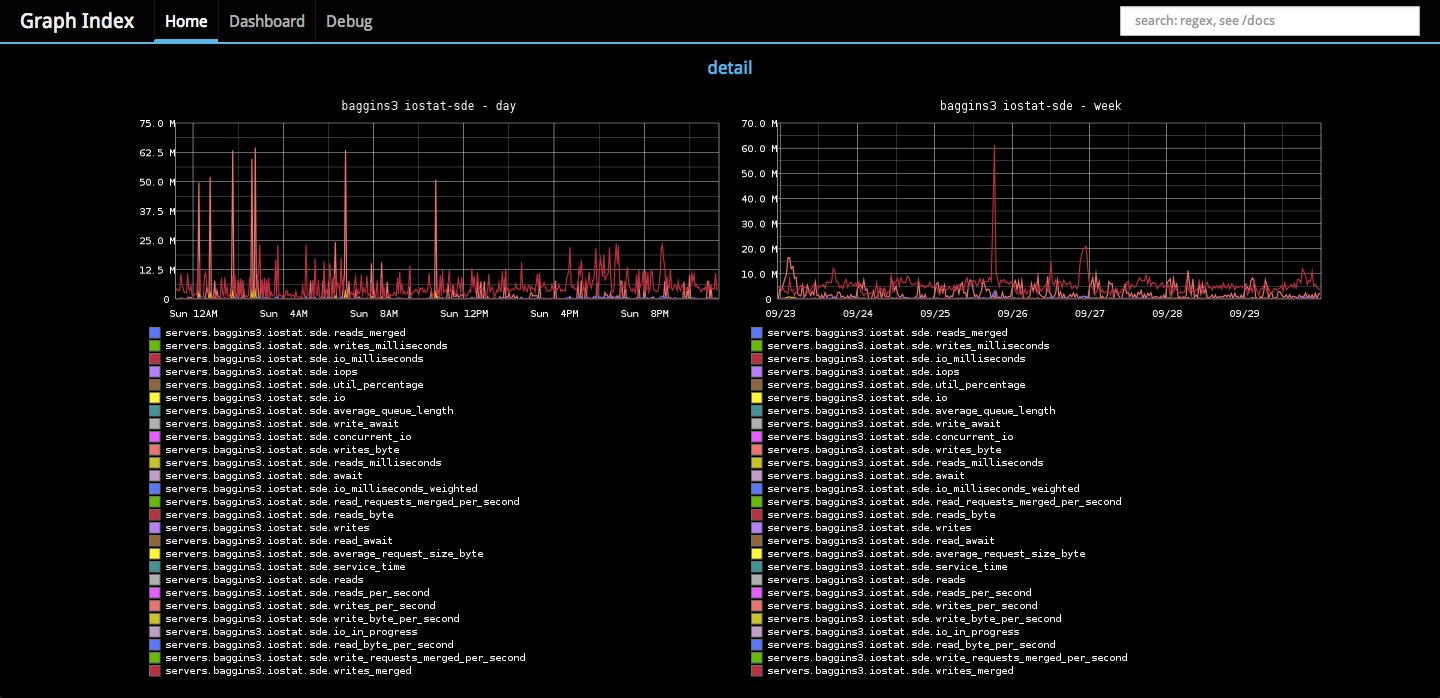
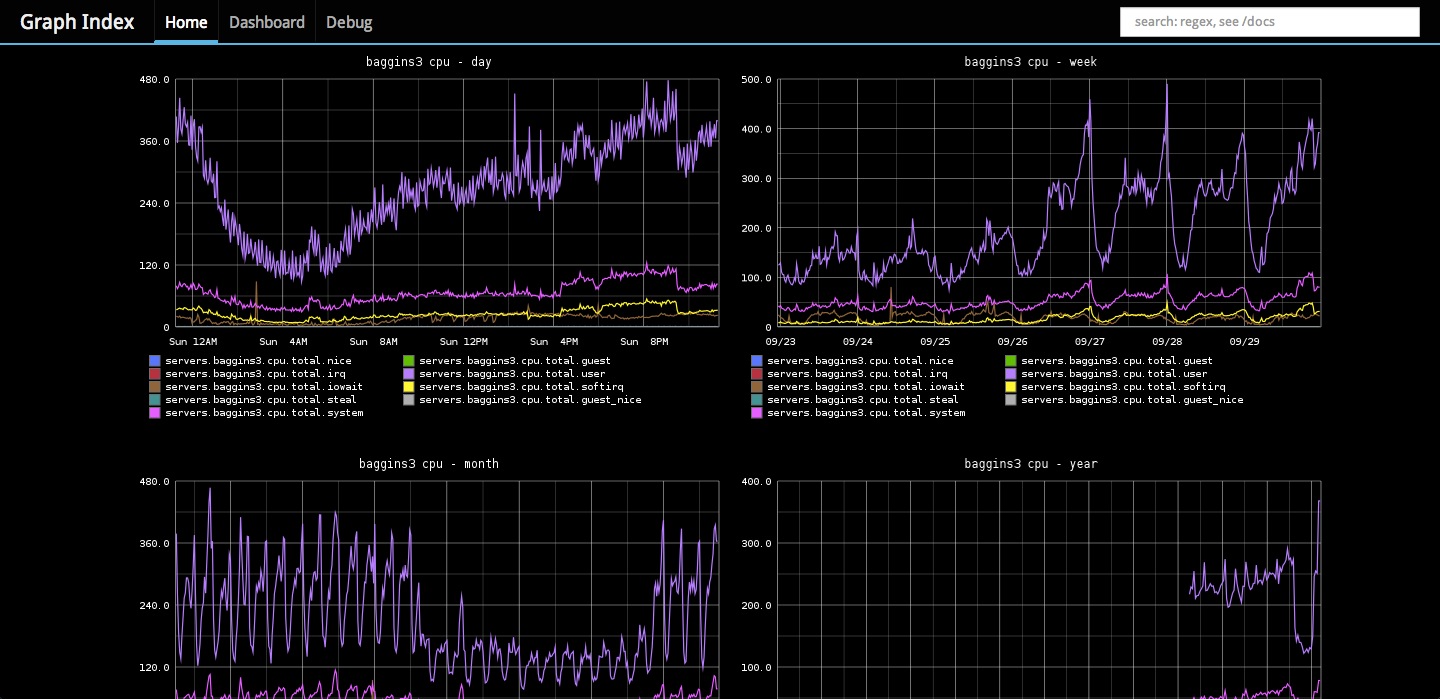
# Screenshot


# Running
First:
```shell
git clone https://github.com/douban/graph-index.git
cd graph-index
```
edit the config.py to modify `graphite_url`, in our case it is `http://graphite.intra.douban.com`
then:
as a dependency, you should add a cron to update metrics like this: `crontab -e`, and put `*/5 * * * * python /path/to/update-metrics.py` in it
finally:
now everything is ready, we can run it by:
```
./graph-index.py
```
graph-index also supports multi-workers with tools like gunicorn, In my case, I started it like this:
```
cd graph-index
/usr/bin/gunicorn -w 5 app:'default_app()' -b 0.0.0.0:8808
```
# Grammar
`regex` will draw a graph for each metric, for example: `servers.[^\.]+.loadavg.01$`
`plugin:server:regex` will display a graph with all metrics on `hostname`,for example: `plugin:cpu:hostname`
`merge:regex` will merge matched metrics in a single graph, for example: `merge:.*loadavg\.01$`
`group\s*by\s*\-?\d+` will draw multiple graphs group by the `\-?\d+`-th field, for example: `loadavg\.01$ groupby1`