https://github.com/dr-lego/gag-network
Network Visualizer for the 'Geschichten aus der Geschichte' Podcast
https://github.com/dr-lego/gag-network
data-science data-visualization database javascript network-analysis podcast python sqlite3 wikipedia wikipedia-dump
Last synced: 12 months ago
JSON representation
Network Visualizer for the 'Geschichten aus der Geschichte' Podcast
- Host: GitHub
- URL: https://github.com/dr-lego/gag-network
- Owner: Dr-Lego
- License: agpl-3.0
- Created: 2024-05-05T10:03:34.000Z (about 2 years ago)
- Default Branch: main
- Last Pushed: 2025-02-01T14:28:13.000Z (over 1 year ago)
- Last Synced: 2025-04-08T05:45:13.846Z (over 1 year ago)
- Topics: data-science, data-visualization, database, javascript, network-analysis, podcast, python, sqlite3, wikipedia, wikipedia-dump
- Language: Python
- Homepage: https://alpharee.de/geschichte/
- Size: 89.1 MB
- Stars: 17
- Watchers: 1
- Forks: 0
- Open Issues: 0
-
Metadata Files:
- Readme: README.md
- License: LICENSE
Awesome Lists containing this project
README
# `Geschichten aus der Geschichte` Network Visualizer
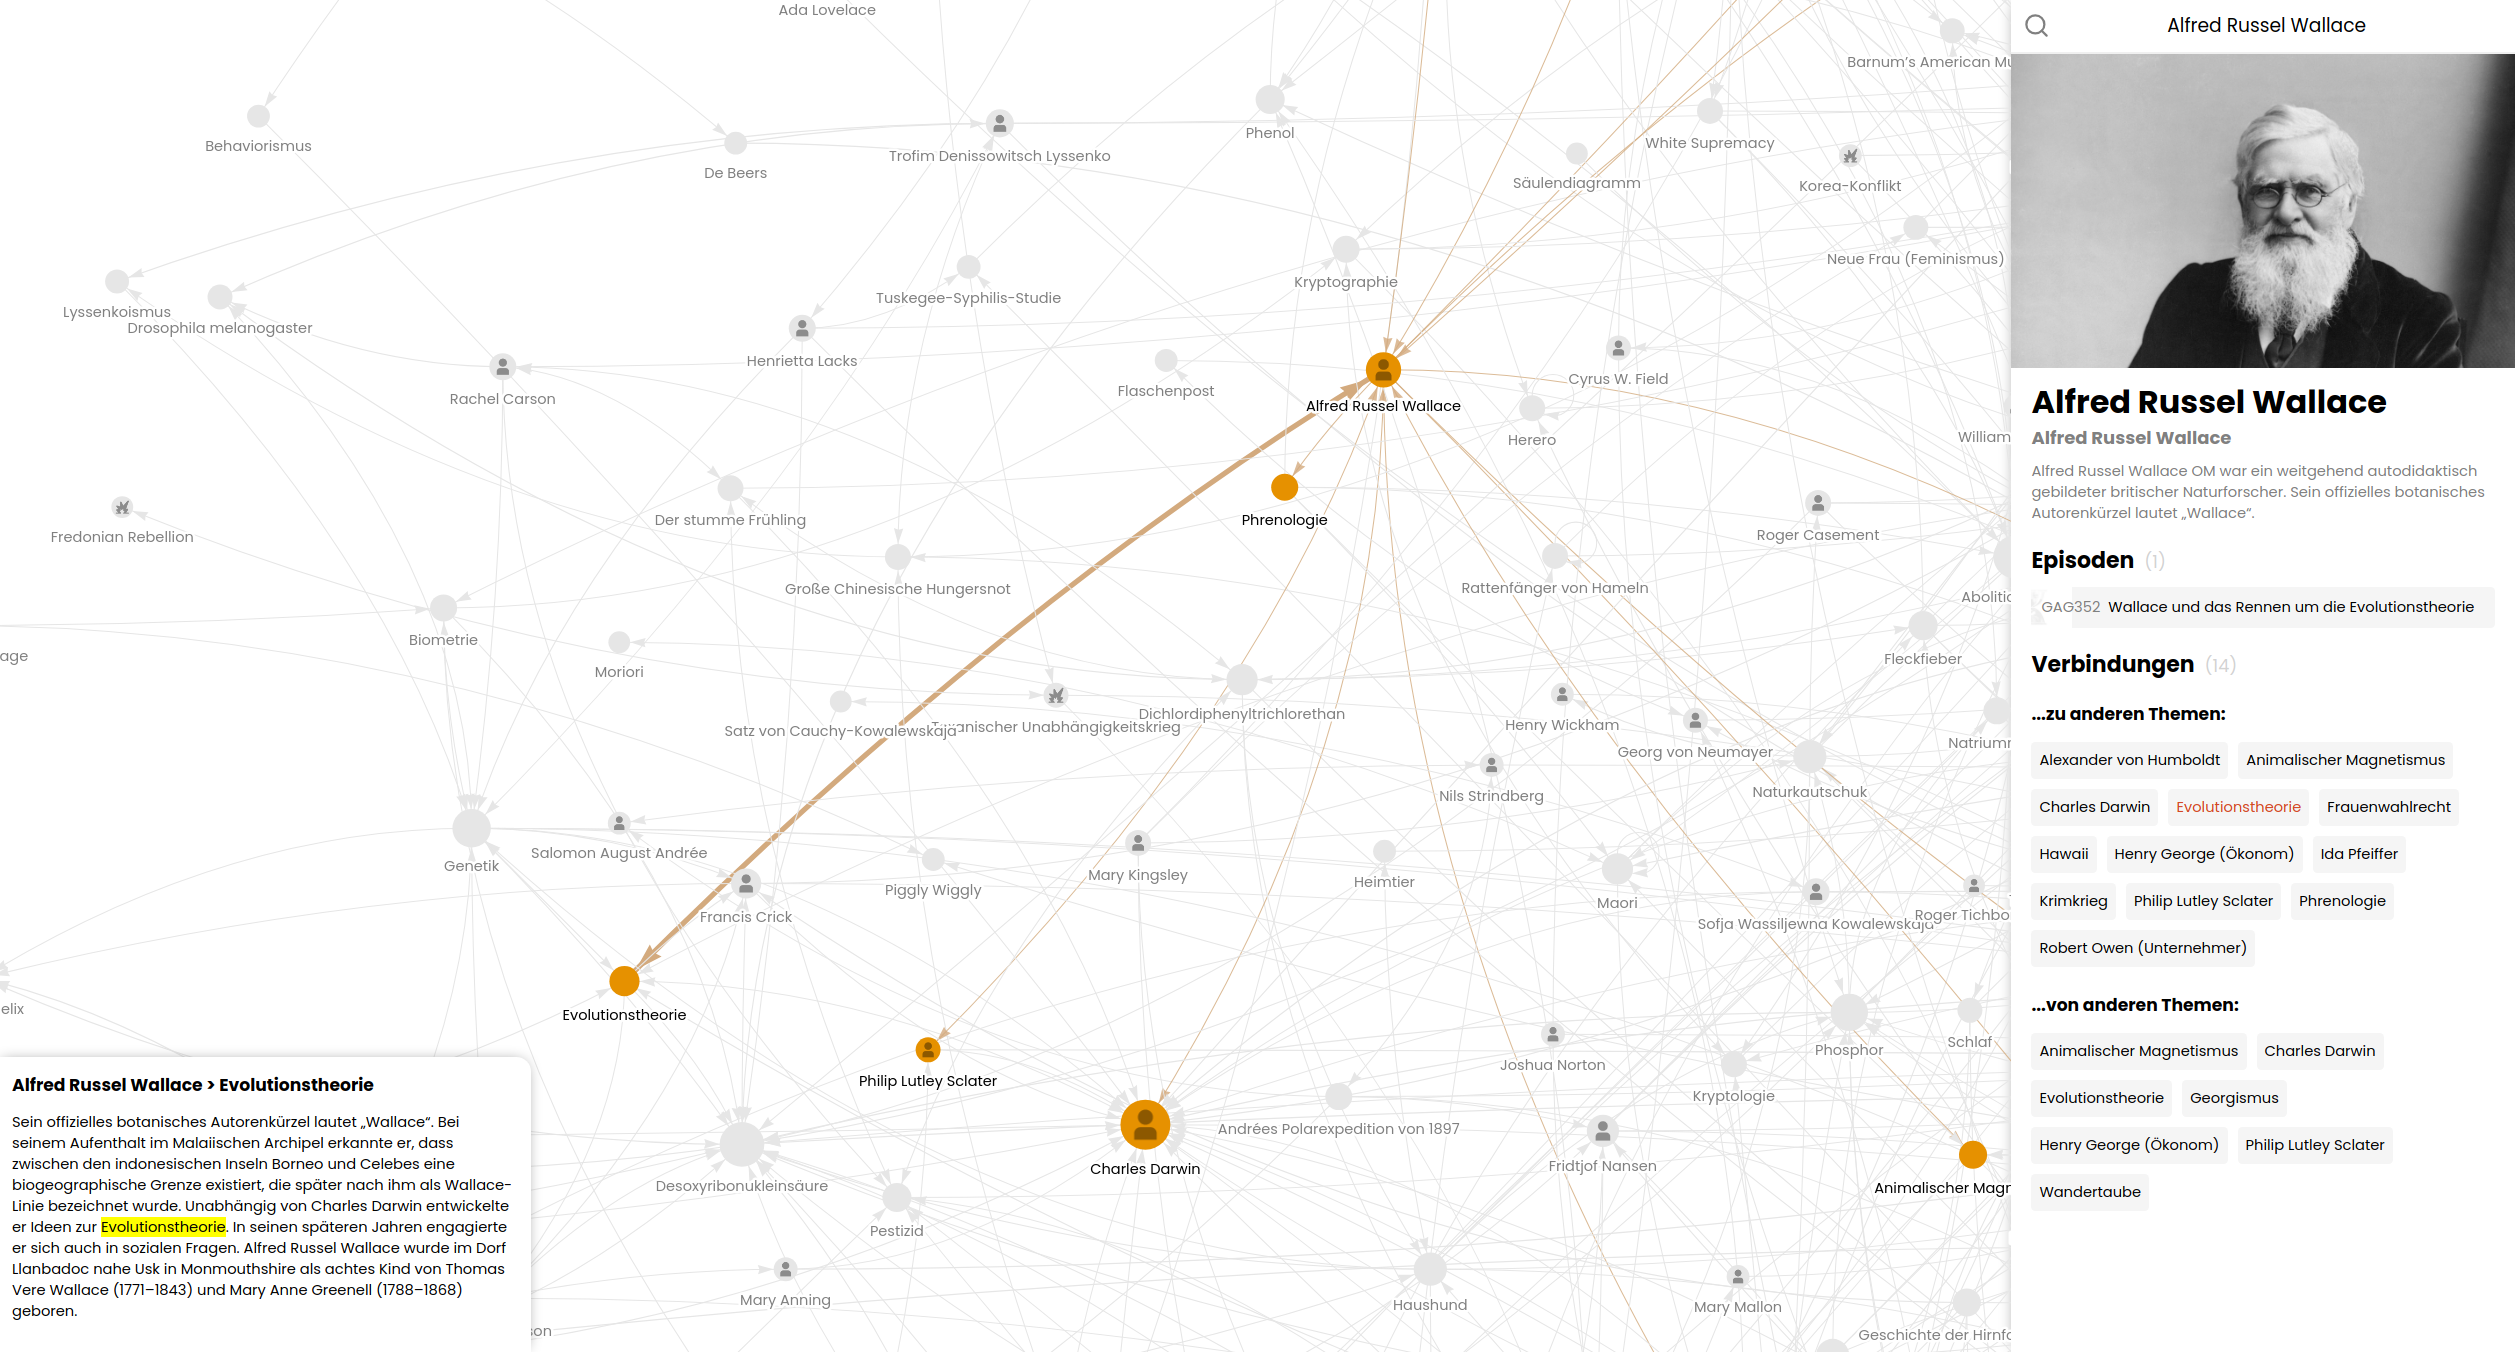
This project aims to visualize the intricate web of connections within the German podcast ["Geschichten aus der Geschichte"](https://www.geschichte.fm) (Stories from History). It creates a network visualization based on the podcast's [episode list on Wikipedia](https://de.wikipedia.org/w/index.php?title=Geschichten_aus_der_Geschichte_(Podcast)/Episodenliste&useskin=vector), showcasing how the Wikipedia articles of the topics mentioned in the podcast are interconnected.
> [!Note]
> I am 16 years old and made this in my spare time, so please don't blame me for inefficient code :)
## Project Overview
The GAG Network Visualizer scrapes data from Wikipedia, processes it, and generates a interactive network graph. It reveals interesting connections between historical topics discussed in the podcast episodes.
Key features:
- Scrapes podcast episode data and related Wikipedia articles
- Processes and analyzes links between articles
- Generates a visual network of interconnected topics
- Provides an interactive web interface to explore the network
### Tech Stack
- Python
- Web scraping: `requests`, `BeautifulSoup`, and `Selenium`
- Data processing: `pandas` and `numpy`
- Text parsing: `wikitextparser`
- Multiprocessing
- SQLite database
- SvelteKit as JavaScript frontend framework
- Network visualization with `vis.js`
### Performance Optimization
Significant effort has been put into optimizing the performance of this project as processing complete Wikipedia dumps:
- Wikipedia index file is converted to an sqlite database at the beginning to make it searchable more easily.
- Utilizes multiprocessing for parallel execution of tasks.
- Uses database indexing and optimized SQL queries to speed up data retrieval.
- Pre-loads and compresses network data to reduce initial loading times for the visualization.
## Prerequisites
- Chrome browser for Selenium WebDriver (or change it in build.py)
- Python packages: `pip install -r requirements.txt`
- Node.js tools: `sudo npm install terser roadroller -g`
- Initialize frontend: `cd frontend && npm install`
## Downloading Wikipedia Dumps
1. Visit [dumps.wikimedia.org/dewiki](https://dumps.wikimedia.org/dewiki/) and d[dumps.wikimedia.org/enwiki](https://dumps.wikimedia.org/enwiki/)
2. Choose the latest timestamp directory
3. Download the two topmost files: `*-pages-articles-multistream.xml.bz2` and `*-pages-articles-multistream-index.txt.bz2`
## Setting Up Environment Variables
You need to set several environment variables that define the user agent, database path, and paths to the Wikipedia dump files.
```bash
GAG_USER_AGENT="GAG-Network (your-email@example.com)"
GAG_DATABASE="/path/to/database"
GAG_WIKIDUMP_DE="/path/to/german/wikipedia-dump.xml.bz2"
GAG_WIKIDUMP_DE_INDEX="/path/to/german/wikipedia-dump-index.txt.bz2"
GAG_WIKIDUMP_EN="/path/to/english/wikipedia-dump.xml.bz2"
GAG_WIKIDUMP_EN_INDEX="/path/to/english/wikipedia-dump-index.txt.bz2"
```
## Running the Project
The project's main script (`main.py`) orchestrates the entire process of data collection, processing, and visualization creation. You can run it in different modes depending on your needs.
### Usage
You can run `main.py` in three different modes:
1. **Full Process**
To run the entire process (refresh data and create save):
```
python main.py
```
This will execute all steps in order:
- Create the database
- Transform icons
- Load the network
- Build the frontend
2. **Refresh Data Only**
To only refresh the data without creating a new save:
```
python main.py --data
```
This will:
- Create the database
- Transform icons
3. **Create Save Only**
To create a new preloaded network save without refreshing data:
```
python main.py --preload
```
This will:
- Load the network
- Build the frontend
### Output
After running `main.py`, you will have:
- A SQLite database with scraped and processed data
- JavaScript files containing network data and metadata
- A preloaded network save for faster initial loading
### Notes
- The full process can be time-consuming, especially when processing complete Wikipedia dumps. Ensure you have sufficient computational resources available.
- If you encounter any issues, check the console output for error messages and ensure all prerequisites are correctly set up.
- The `--data` option is useful when you want to update the underlying data without regenerating the visualization.
- The `--preload` option is helpful when you've made changes to the visualization code but don't need to refresh the underlying data.
After running the script, you can view the visualization by opening `build/index.html` in a web browser.
An up-to-date build can also be found at [Dr-Lego/gag-network-build](https://github.com/Dr-Lego/gag-network-build).