https://github.com/dubzzz/cuda-test-samples
Code samples to test CUDA on simple operations
https://github.com/dubzzz/cuda-test-samples
Last synced: 6 months ago
JSON representation
Code samples to test CUDA on simple operations
- Host: GitHub
- URL: https://github.com/dubzzz/cuda-test-samples
- Owner: dubzzz
- Created: 2014-07-16T16:19:32.000Z (about 11 years ago)
- Default Branch: master
- Last Pushed: 2014-07-23T01:03:46.000Z (about 11 years ago)
- Last Synced: 2025-03-25T13:45:44.858Z (7 months ago)
- Language: Shell
- Size: 215 KB
- Stars: 7
- Watchers: 2
- Forks: 1
- Open Issues: 0
-
Metadata Files:
- Readme: README.md
Awesome Lists containing this project
README
#Measurements on CUDA
##Configuration
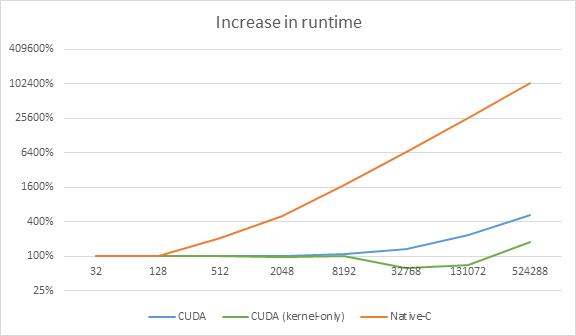
Implementing a source code using CUDA is a real challenge. It requires to know how CUDA manages its memory and which kind of operations can be accelerated using CUDA instead of native-C. Size matters when dealing with a CUDA implementation: the larger the better.
CUDA can be a blessing for your runtime but it can also be worse than a native implementation. Indeed, a naive implementation can be very inefficient.
The following measurements have been made using the configuration:
+ Processor: Intel(R) Xeon(R) CPU E5606 @ 2.13GHz
+ GPU: GeForce GTX 780 – Compute capability = 3.5
+ Memory: 8GB
+ Operating system: Ubuntu 13.04
+ Kernel: Linux version 3.8.0-35-generic
+ CUDA compiler (nvcc): 5.5.0
+ C/C++ compiler (gcc/g++): 4.7.3
These measures are the mean of 1,000 measurements. They are expressed in microseconds.
It was compiled and run using these instructions:
```bash
user@host:~$ /usr/local/cuda/bin/nvcc -m64 -gencode arch=compute_20,code=sm_20 -gencode arch=compute_30,code=sm_30 -gencode arch=compute_35,code=sm_35 -po maxrregcount=16 -I/usr/local/cuda/include -I. -I.. -I../../common/inc -I/usr/local/cuda/samples/common/inc -o main.o -c main.cu
user@host:~$ g++ -m64 -o a.out main.o -L/usr/local/cuda/lib64 –lcudart
user@host:~$ ./a.out > /dev/null ; ./a.out > /dev/null ; ./a.out
```
The first run of the program is always slower than the others. For that reason, measures are based on the 3rd run.
##Impact of memory allocation
###Source code:
https://github.com/dubzzz/cuda-test-samples/tree/master/map-mem-alloc
###Introduction:
Memory allocation in CUDA can be very expensive. The following code has been used in order to measure the cost of allocation compared to kernel execution and copies back and forth.
###Example of Map algorithm using CUDA:
```cuda
#include
#define MAX_THREADS 256
#define SIZE 256
__global__ void square_kernel(float *d_vector)
{
int i = blockIdx.x*blockDim.x + threadIdx.x;
if (i >= SIZE)
return;
d_vector[i] = d_vector[i]*d_vector[i];
}
int main(int argc, char **argv)
{
cudaFree(0); // Force runtime API context establishment
float h_vector[SIZE]; // For input and output
for (unsigned int i(0) ; i!=SIZE ; i++)
h_vector[i] = i;
float *d_vector;
cudaMalloc(&d_vector, SIZE*sizeof(float));
cudaMemcpy(d_vector, h_vector, SIZE*sizeof(float), cudaMemcpyHostToDevice);
square_kernel<<<(SIZE+MAX_THREADS-1)/MAX_THREADS, MAX_THREADS>>>(d_vector);
cudaThreadSynchronize(); // Block until the device is finished
cudaMemcpy(h_vector, d_vector, SIZE*sizeof(float), cudaMemcpyDeviceToHost);
cudaFree(d_vector);
}
```
###Time consumed line by line:
Vector size | cudaMalloc | cudaMemcpy (GPU>CPU) | kernel | cudaMemcpy (CPU>GPU) | cudaFree
------------|------------|----------------------|--------|----------------------|---------
32 | 144.31 | 11.15 | 22.50 | 17.31 | 108.84
128 | 143.79 | 11.21 | 22.48 | 17.69 | 108.23
512 | 144.60 | 11.77 | 22.67 | 17.95 | 110.30
2 048 | 144.23 | 13.72 | 22.44 | 20.68 | 110.46
8 192 | 142.33 | 22.44 | 22.30 | 31.29 | 111.00
32 768 | 145.53 | 65.15 | 24.06 | 73.02 | 114.70
131 072 | 144.03 | 206.38 | 26.17 | 240.76 | 115.45
524 288 | 145.37 | 685.64 | 45.03 | 783.88 | 120.28
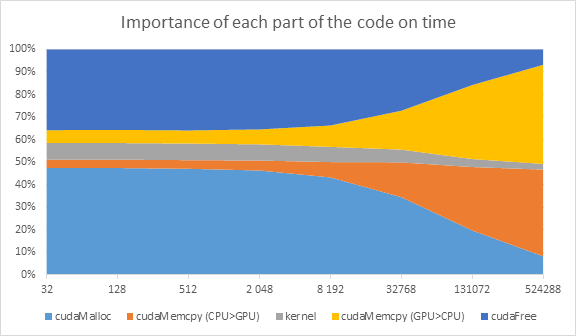
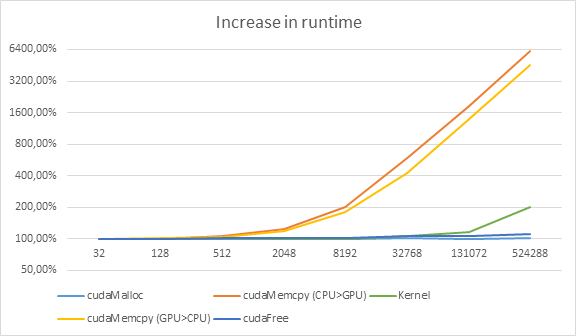
For small vectors, the most significant parts are `cudaMalloc` and `cudaFree`. The time consumed by these two operations is constant – independent of vector size. Increasing the vector size makes these parts irrelevant. As shown on next graph the most significant piece of code in terms of time consumed becomes `cudaMemcpy` as the size increase. Kernel time also increases but very slowly compared to `cudaMemcpy`.


##Data type: int vs float vs double
###Source code:
https://github.com/dubzzz/cuda-test-samples/tree/master/map-datatype
https://github.com/dubzzz/cuda-test-samples/tree/master/reduce-datatype
###Introduction:
Some tests have been carried out to test whether or not data type has an impact on runtime. Due to its size in memory it can be logical for `double` operations to take more time than `float`.
###Time consumed by Map-kernel:
Vector size | int | float | double
------------|-----|-------|-------
32 | 24.04 | 24.27 | 24.34
128 | 23.72 | 23.69 | 23.79
512 | 24.17 | 24.16 | 24.16
2 048 | 22.85 | 22.70 | 22.68
8 192 | 23.19 | 23.44 | 19.54
32 768 | 14.26 | 14.23 | 14.68
131 072 | 16.60 | 16.88 | 17.79
On GeForce GTX 780, Map code takes exactly the same amount of time for `int`, `float` and `double` (for kernel). It is important to remark that the time consumed by `cudaMemcpy` may differ due to differences between `sizeof(data type)`:
+ sizeof(int) = 4
+ sizeof(float) = 4
+ sizeof(double) = 8
For large vectors `cudaMemcpy` for `doubles` will take twice the time of `floats`.
Other tests have been done in order to compare the impact of `atomicAdd` on runtime. In order to carry out these tests, another algorithm was necessary. Here is the source code used for this algorithm: reduce. This algorithm has to sum all the elements of the input vector and store the result into a one-element-vector.
###Example of Reduce algorithm using CUDA:
```cuda
#include
#define MAX_THREADS 256
#define SIZE 32
__device__ double atomicAdd(double* address, double val)
{
unsigned long long int* address_as_ull = (unsigned long long int*) address;
unsigned long long int old = *address_as_ull, assumed;
do
{
assumed = old;
old = atomicCAS(address_as_ull, assumed, __double_as_longlong(val + __longlong_as_double(assumed)));
}
while (assumed != old);
return __longlong_as_double(old);
}
template
__global__ void sumall_kernel(T *d_vector, T *d_result)
{
__shared__ T cache[MAX_THREADS];
int cacheIdx = threadIdx.x;
int i = blockIdx.x * blockDim.x + threadIdx.x;
cache[cacheIdx] = i >= SIZE ? 0. : d_vector[i];
__syncthreads();
if (i >= SIZE)
return;
int padding = blockDim.x/2;
while (padding != 0)
{
if (cacheIdx < padding)
cache[cacheIdx] += cache[cacheIdx + padding];
__syncthreads();
padding /= 2;
}
if (cacheIdx == 0)
atomicAdd(&d_result[0], cache[0]);
}
int main(int argc, char **argv)
{
cudaFree(0); // Force runtime API context establishment
double h_vector_d[SIZE]; // For input and output
for (unsigned int i(0) ; i!=SIZE ; i++)
h_vector_d[i] = i;
double h_result_d;
double *d_vector_d, *d_result_d;
cudaMalloc(&d_vector_d, SIZE*sizeof(double));
cudaMalloc(&d_result_d, sizeof(double));
cudaMemcpy(d_vector_d, h_vector_d, SIZE*sizeof(double), cudaMemcpyHostToDevice);
cudaMemset(d_result_d, 0, sizeof(double));
sumall_kernel<<<(SIZE+MAX_THREADS-1)/MAX_THREADS, MAX_THREADS>>>(d_vector_d, d_result_d);
cudaThreadSynchronize(); // Block until the device is finished
cudaMemcpy(h_vector_d, d_vector_d, SIZE*sizeof(double), cudaMemcpyDeviceToHost);
cudaMemcpy(&h_result_d, d_result_d, sizeof(double), cudaMemcpyDeviceToHost);
cudaFree(d_vector_d);
cudaFree(d_result_d);
}
```
###Time consumed by Reduce-kernel:
Vector size | int | float | double | double/float
------------|-----|-------|--------|-------------
32 | 22.37 | 22.11 | 22.60 | x1.02
128 | 22.07 | 22.01 | 22.89 | x1.04
512 | 22.12 | 21.90 | 23.02 | x1.05
2 048 | 22.75 | 22.27 | 25.61 | x1.15
8 192 | 22.71 | 22.45 | 32.03 | x1.47
32 768 | 18.04 | 17.51 | 56.72 | x3.24
131 072 | 29.36 | 27.05 | 177.23 | x6.55
We can see that `atomicAdd(int)` and `atomicAdd(float)` are faster than `atomicAdd(double)` which is a non-built-in function. `atomicAdd(double)` becomes inefficient for large vectors.
##Shared vs Global memory
###Source code:
https://github.com/dubzzz/cuda-test-samples/tree/master/reduce-vs-shared
###Introduction:
CUDA has three main levels of memory:
+ `local`: within a thread
+ `shared`: within a block (several threads)
+ `global`: for every block and every thread
Using local/shared memory instead of global one is certainly a good thing to do when dealing with several consecutives access to the same piece of data among a given thread or a given block of threads. Most of the time, it is used for concealed accesses to global memory. In order to compare accesses to shared and global memories, reduce-kernel has been used and change to test both global and shared accesses.
###Adapted version of Reduce-kernel for shared memory:
```cuda
__global__ void sumall_kernel_shared(float *d_vector, float *d_result)
{
__shared__ float cache[MAX_THREADS];
int cacheIdx = threadIdx.x;
int i = blockIdx.x * blockDim.x + threadIdx.x;
cache[cacheIdx] = i >= SIZE ? 0. : d_vector[i];
__syncthreads();
if (i >= SIZE)
return;
int padding = blockDim.x/2;
while (padding != 0)
{
if (cacheIdx < padding && i+padding < SIZE)
cache[cacheIdx] += cache[cacheIdx + padding];
__syncthreads();
padding /= 2;
}
if (cacheIdx == 0)
atomicAdd(&d_result[0], cache[0]);
}
```
The only difference with previous kernel is the use of the condition: `i+padding= SIZE)
return;
int padding = blockDim.x/2;
while (padding != 0)
{
if (cacheIdx < padding && i+padding < SIZE)
d_vector[i] += d_vector[i + padding];
__syncthreads();
padding /= 2;
}
if (cacheIdx == 0)
atomicAdd(&d_result[0], d_vector[deltaIdx]);
}
```
###Time consumed by Reduce-kernel:
Vector size | shared | global | global/shared
------------|--------|--------|--------------
32 | 22.19 | 23.17 | x1.04
128 | 22.58 | 23.19 | x1.03
512 | 22.17 | 23.66 | x1.07
2 048 | 22.61 | 23.84 | x1.05
8 192 | 22.11 | 23.68 | x1.07
32 768 | 17.97 | 20.79 | x1.16
131 072 | 28.19 | 36.28 | x1.29
On my GPU, the difference is not very huge on that example. The use of `atomicAdd` on global memory for both cases certainly reduces the effect of using a cache stored into shared memory.
###Bandwidth global vs shared:
In order to measure the difference between shared and global memory access in terms of runtime, you can still run the code: https://raw.githubusercontent.com/parallel-forall/code-samples/master/series/cuda-cpp/transpose/transpose.cu
Here is the output for my computer:
```
Device : GeForce GTX 780
Matrix size: 1024 1024, Block size: 32 8, Tile size: 32 32
dimGrid: 32 32 1. dimBlock: 32 8 1
Routine Bandwidth (GB/s)
copy 203.96
shared memory copy 211.39
```
These results confirm my previous results.
##CUDA vs native-C: Map algorithm
###Source code:
https://github.com/dubzzz/cuda-test-samples/tree/master/map-vs-native
###Example of Map algorithm using native-C:
```c
for (unsigned int i(0) ; i!=SIZE ; i++)
h_vector[i] = h_vector[i]*h_vector[i];
```
###Runtime comparison:
Vector size | CUDA | CUDA (kernel-only) | Native-C
------------|------|--------------------|---------
32 | 306.10 | 23.50 | 2.26
128 | 310.98 | 23.77 | 2.33
512 | 311.92 | 23.77 | 4.78
2 048 | 313.11 | 22.64 | 11.52
8 192 | 330.88 | 23.77 | 40.04
32 768 | 415.98 | 14.46 | 151.91
131 072 | 708.28 | 16.63 | 588.12
524 288 | 1 612.18 | 42.34 | 2 359.40

##CUDA vs native-C: Reduce algorithm
###Source code:
https://github.com/dubzzz/cuda-test-samples/tree/master/reduce-vs-native
###Example of Reduce algorithm using native-C:
```c
h_result = 0.;
for (unsigned int i(0) ; i!=SIZE ; i++)
h_result += h_vector[i];
```
###Runtime comparison:
Vector size | CUDA | CUDA (kernel-only) | Native-C
------------|------|--------------------|---------
32 | 343.01 | 21.80 | 2.28
128 | 344.26 | 21.82 | 2.37
512 | 564.34 | 22.39 | 4.89
2 048 | 563.19 | 22.05 | 12.26
8 192 | 590.45 | 22.50 | 42.67
32 768 | 658.95 | 17.28 | 161.25
131 072 | 973.53 | 27.19 | 634.94
524 288 | 1 939.51 | 70.11 | 2 539.74
##Other improvements
+ Coalesced memory accesses to global memory
+ Aligned memory accesses
+ Non-strided memory accesses
+ Shared memory
+ No bank conflicts
+ Texture memory for read-only accesses can be an advantage
+ `use_fast_math` parameter for `nvcc`: better runtime but less accuracy
All these improvements are described in the document: http://shodor.org/media/content//petascale/materials/UPModules/dynamicProgrammingPartI/bestPractices.pdf