https://github.com/ductnn/domolo
A monitoring and logging solution for Docker hosts and containers with Prometheus, Grafana, Loki, cAdvisor, NodeExporter and alerting with AlertManager.
https://github.com/ductnn/domolo
container docker grafana logging loki monitoring nodeexporter prometheus promtail
Last synced: 4 months ago
JSON representation
A monitoring and logging solution for Docker hosts and containers with Prometheus, Grafana, Loki, cAdvisor, NodeExporter and alerting with AlertManager.
- Host: GitHub
- URL: https://github.com/ductnn/domolo
- Owner: ductnn
- License: mit
- Created: 2022-11-28T17:13:19.000Z (over 3 years ago)
- Default Branch: master
- Last Pushed: 2025-02-13T03:40:22.000Z (over 1 year ago)
- Last Synced: 2025-05-19T20:11:42.189Z (about 1 year ago)
- Topics: container, docker, grafana, logging, loki, monitoring, nodeexporter, prometheus, promtail
- Language: Shell
- Homepage: https://github.com/ductnn/domolo
- Size: 3.33 MB
- Stars: 78
- Watchers: 3
- Forks: 23
- Open Issues: 6
-
Metadata Files:
- Readme: README.md
- License: LICENSE
Awesome Lists containing this project
README
# domolo
[](https://github.com/ductnn/Dockerfile/pulls)
[](LICENSE)

A monitoring and logging solution for Docker hosts and containers with [Prometheus](https://prometheus.io/),
[Grafana](http://grafana.org/), [Loki](https://github.com/grafana/loki/), [cAdvisor](https://github.com/google/cadvisor),
[NodeExporter](https://github.com/prometheus/node_exporter) and alerting with
[AlertManager](https://github.com/prometheus/alertmanager).
Inspired by [dockprom](https://github.com/stefanprodan/dockprom)
## Install
Clone this repository on your Docker host, cd into `domolo` directory and run
`docker-compose up -d`:
```bash
git clone https://github.com/ductnn/domolo.git
cd domolo
docker-compose up -d
```
Containers:
- **Prometheus** (metrics database): `http://:9090`
- **Prometheus-Pushgateway** (push acceptor for ephemeral and batch jobs): `http://:9091`
- **AlertManager** (alerts management): `http://:9093`
- **Grafana** (visualize metrics): `http://:3000`
- **Loki** (likes prometheus, but for logs): `http://:3100`
- **Promtail** (is the agent, responsible for gathering logs and sending them to Loki)
- **NodeExporter** (host metrics collector)
- **cAdvisor** (containers metrics collector)
- **Caddy** (reverse proxy and basic auth provider for prometheus and alertmanager)
## Grafana
Change the credentials in file [config](config):
```
GF_SECURITY_ADMIN_USER=admin
GF_SECURITY_ADMIN_PASSWORD=changeme
GF_USERS_ALLOW_SIGN_UP=false
```
**Grafana** is preconfigured with dashboards, setup **Prometheus**(default) and
**Loki** in [datasources](grafana/provisioning/datasources/datasource.yml)
```yaml
apiVersion: 1
datasources:
- name: Prometheus
type: prometheus
access: proxy
orgId: 1
url: http://prometheus:9090
basicAuth: false
isDefault: true
editable: true
- name: Loki
type: loki
access: proxy
jsonData:
maxLines: 1000
basicAuth: false
url: http://loki:3100
isDefault: false
editable: true
```
### Prometheus + Node Exporter
Config `prometheus` for receiving *metrics* from `node_exporter`.
First, setup `node_exporter` in servers we need monitor with [docker-compose.agents.yml](docker-compose.agents.yml)
and run command:
```sh
docker-compose -f docker-compose.agents.yml up -d
```
This file will setup 3 agents:
- `node_exporter`
- `cAdvisor`
- `promtail`
Then, we need config scrape *metric* on **prometheus server**:
Live monitoring **prometheus server**:
```yaml
scrape_configs:
- job_name: 'nodeexporter'
scrape_interval: 5s
static_configs:
- targets: ['nodeexporter:9100']
```
Monitoring other Server, we need to add `external_labels`:
```yaml
external_labels:
monitor: 'docker-host-alpha'
scrape_configs:
- job_name: 'ApiExporter'
scrape_interval: 5s
static_configs:
- targets: [':Port']
```
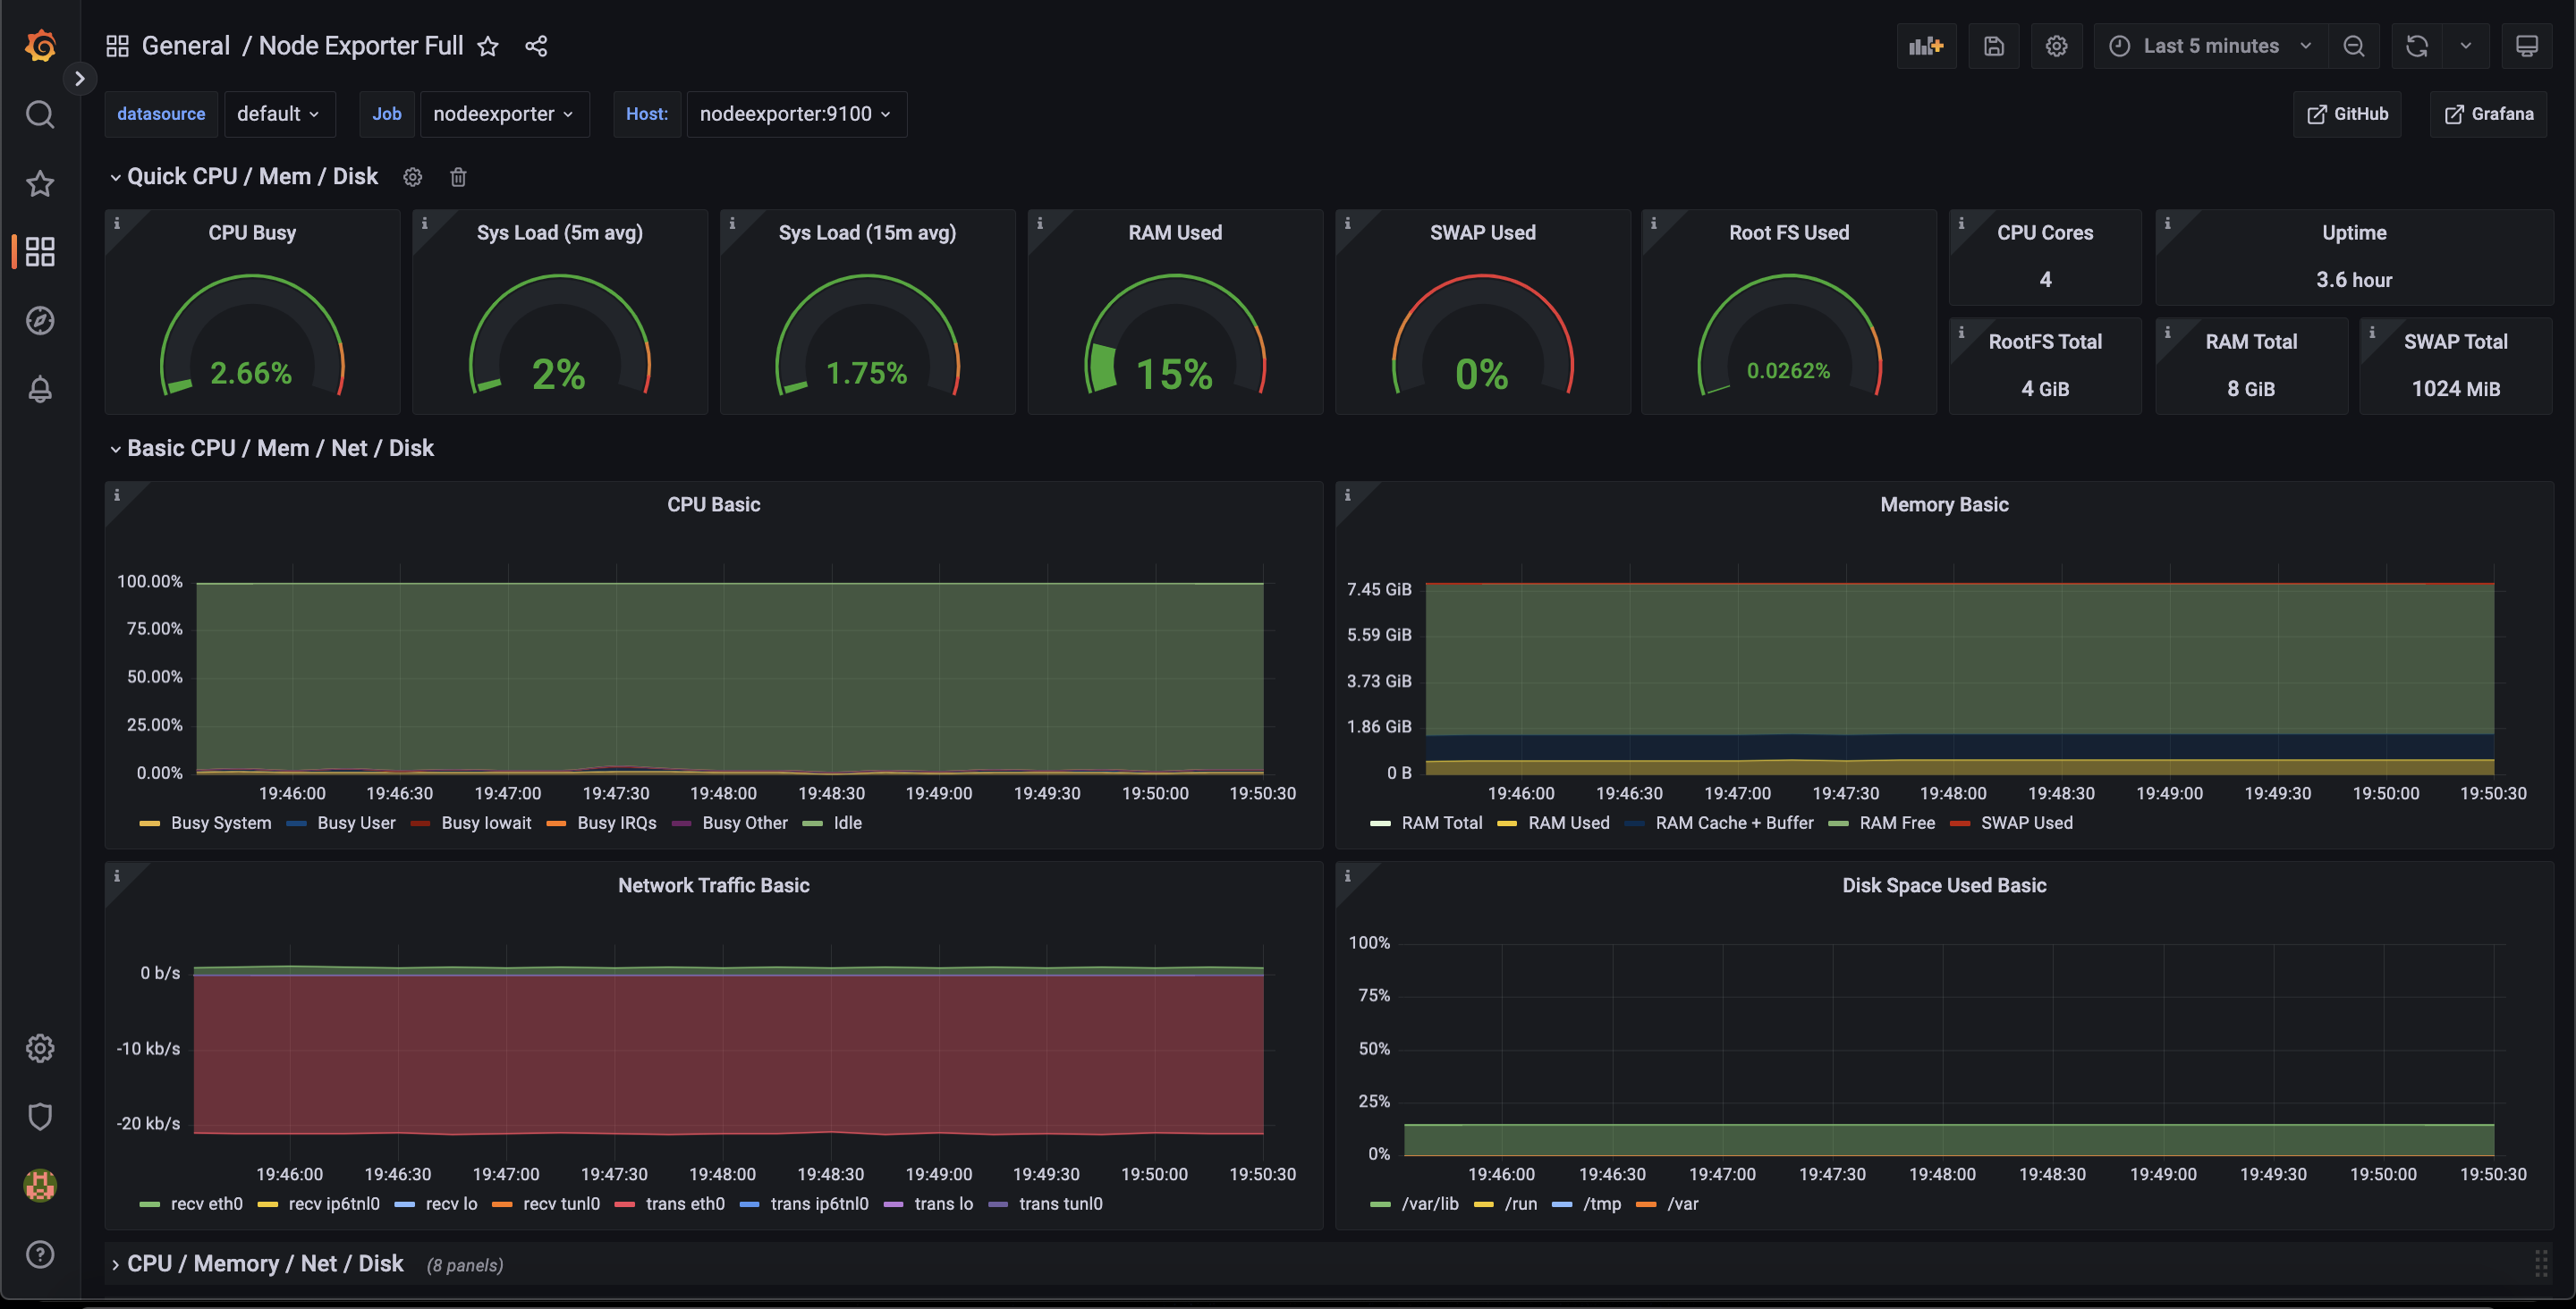
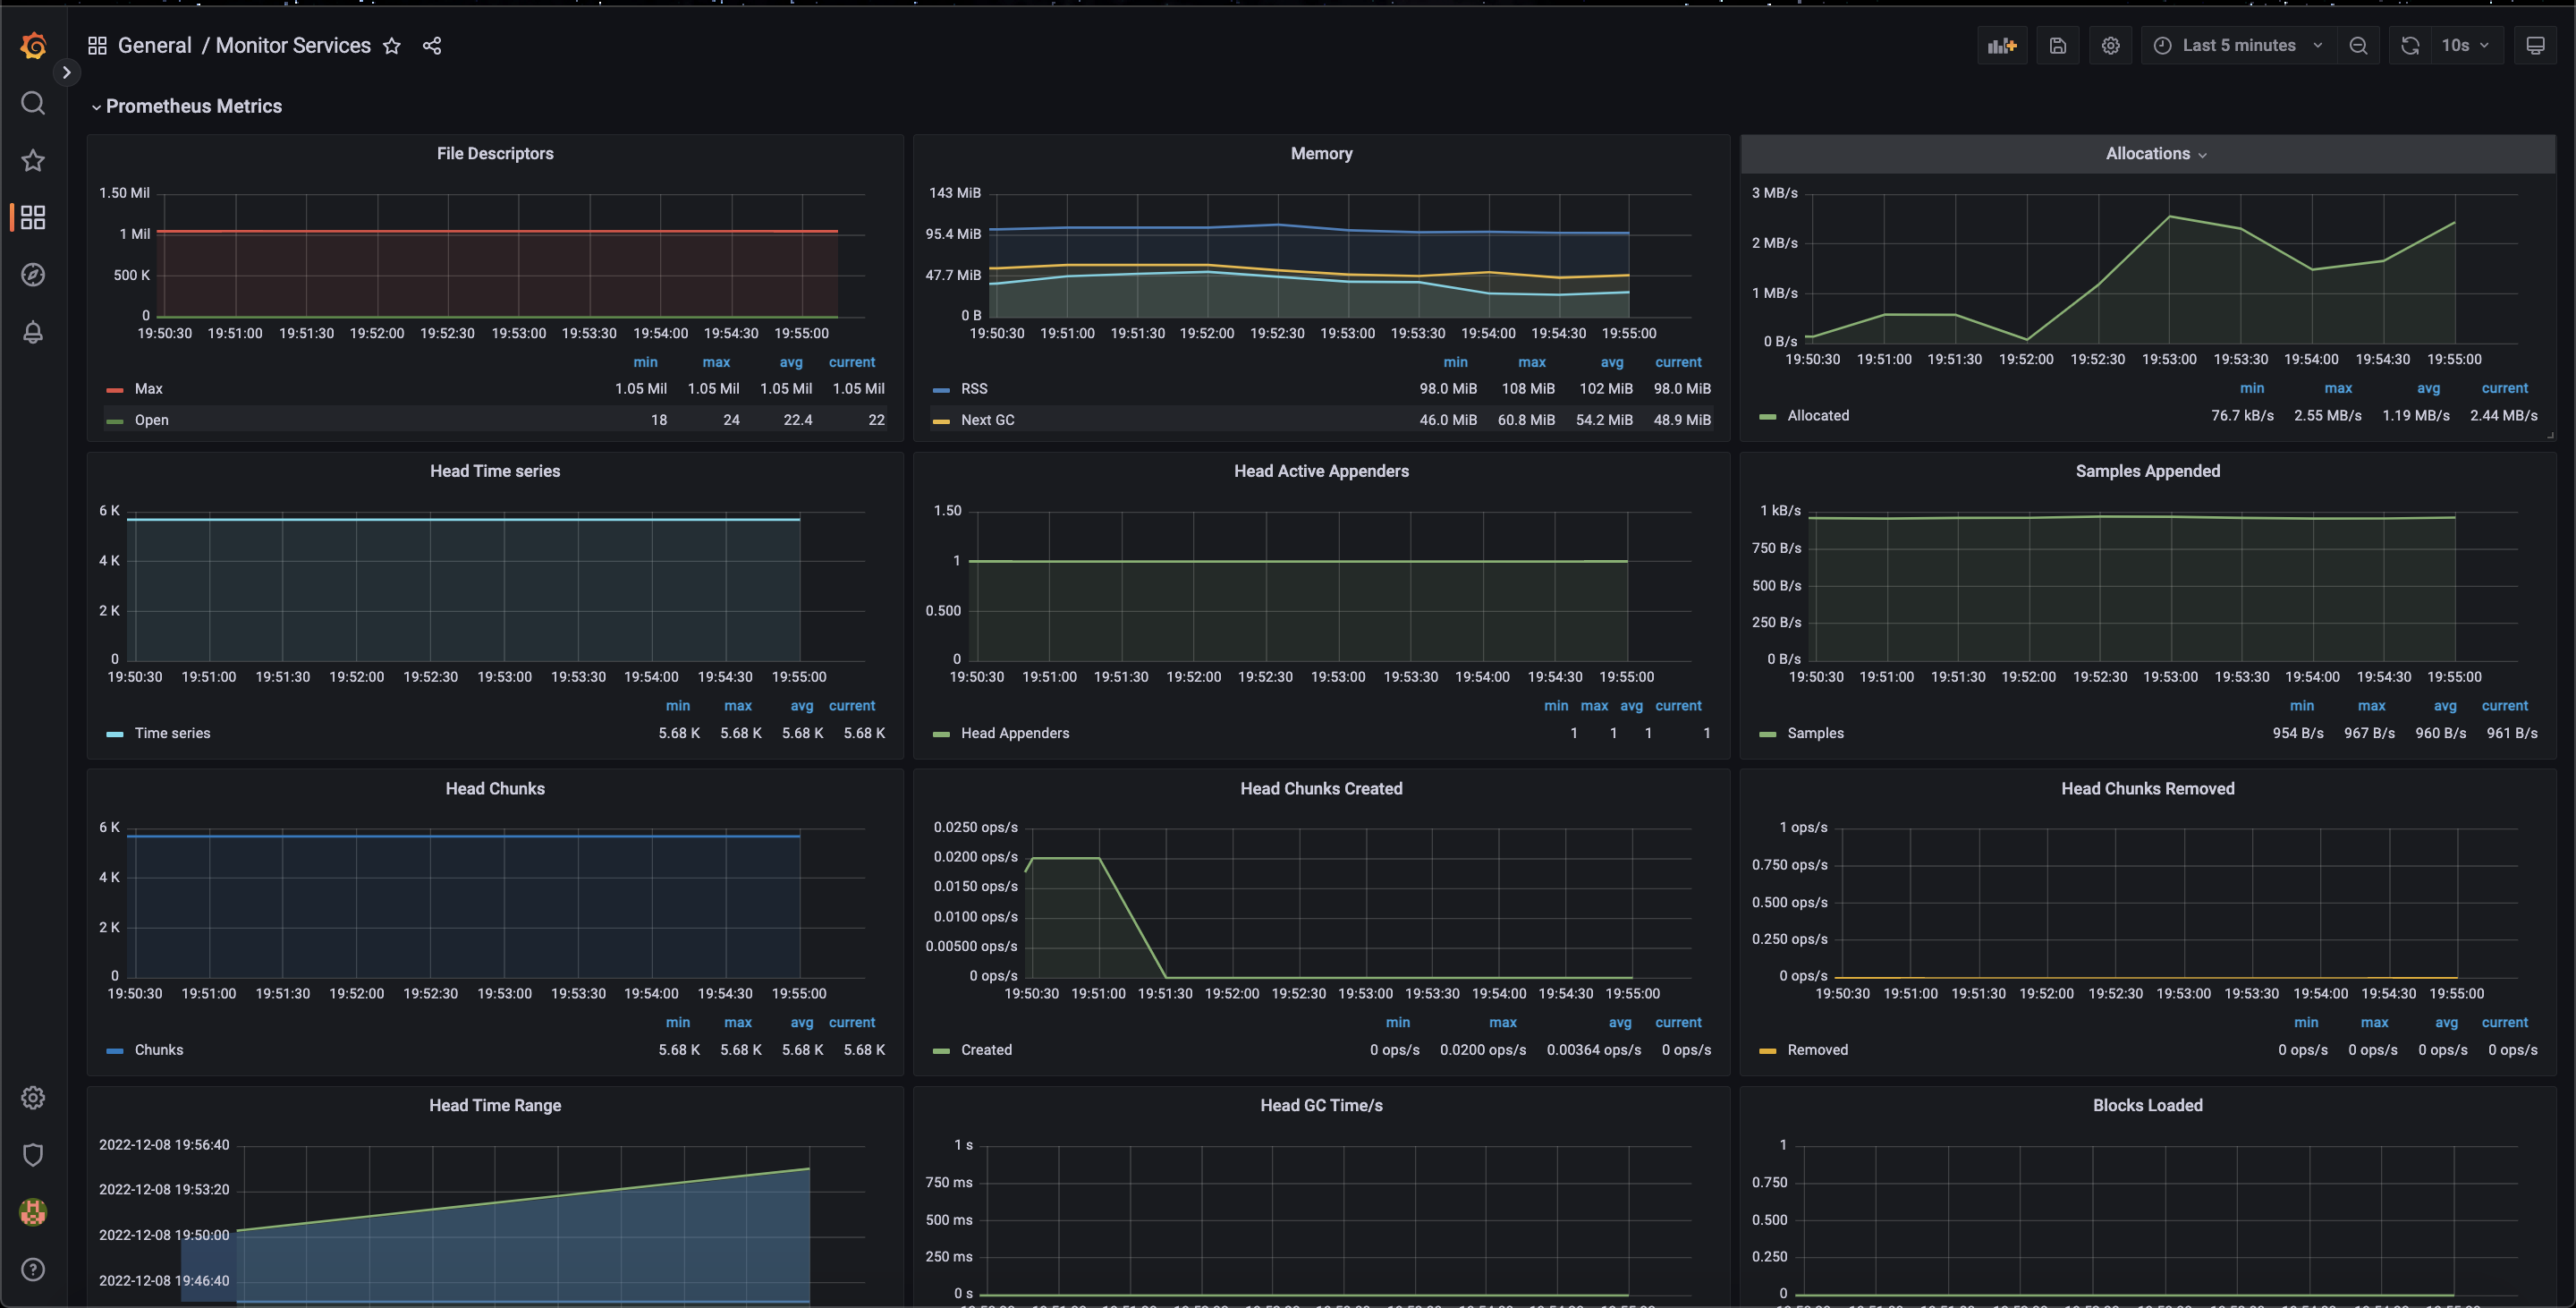
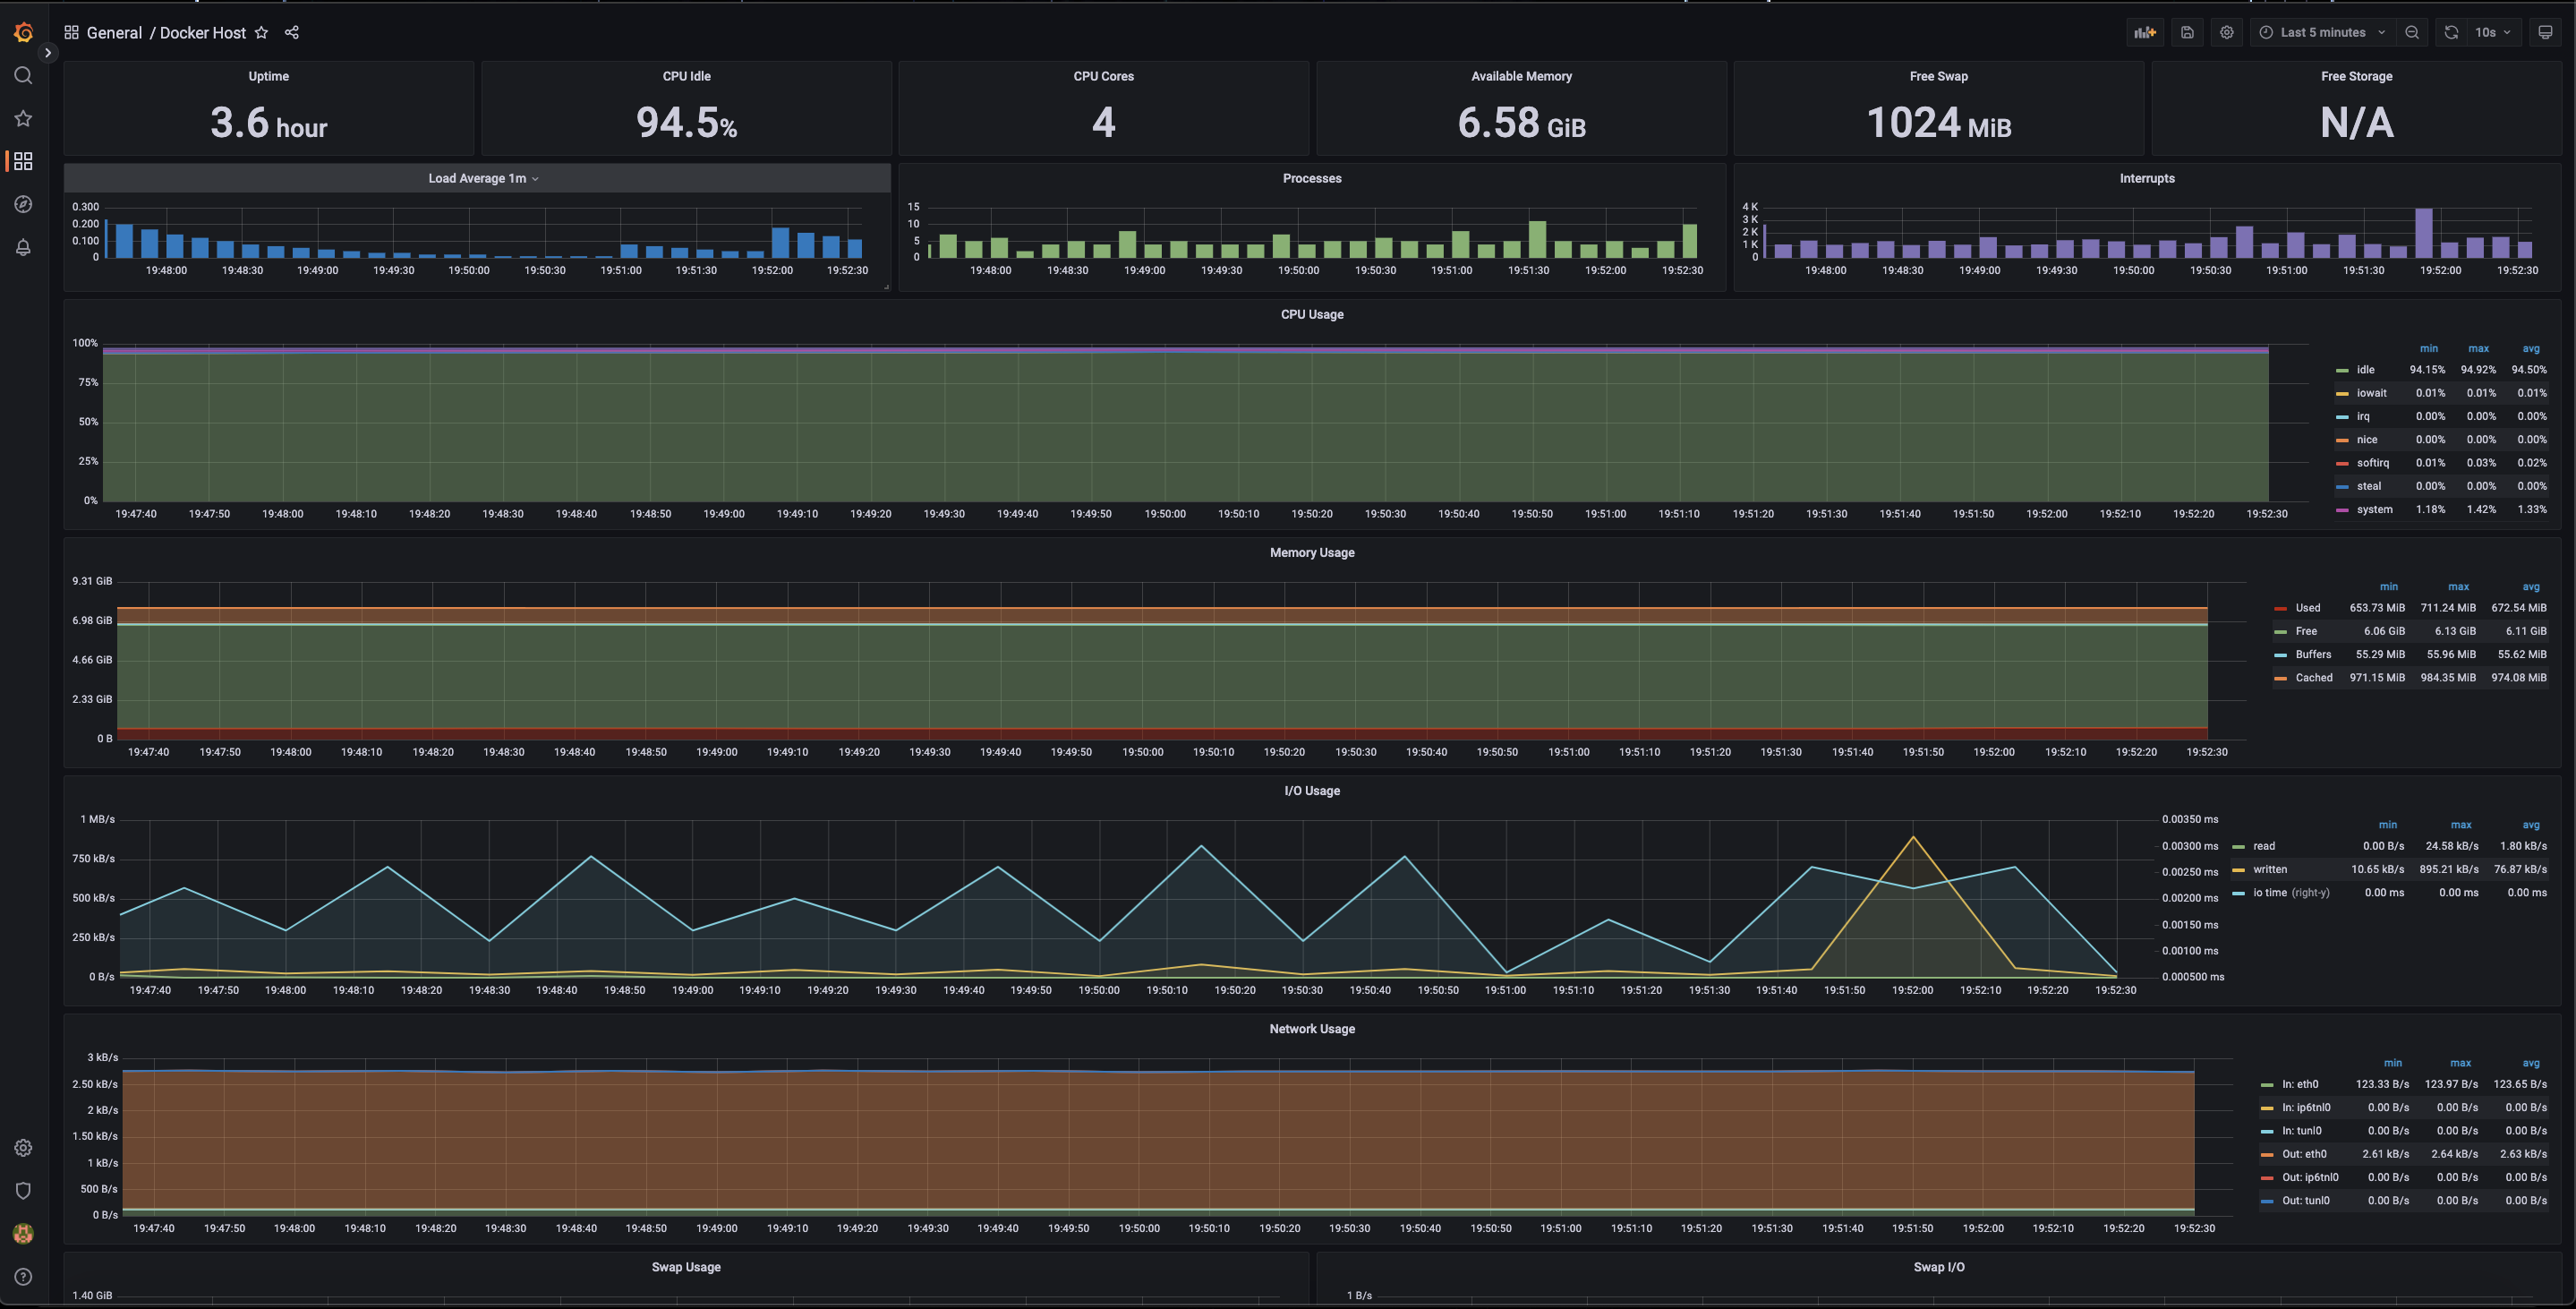
### Grafana Dashboards
Simple dashboards on *Grafana*:
***Node Exporter***
***Monitor Services***
***Docker Host***
## Loki
Setup config *loki* in file [loki-config](loki/loki-config.yaml)
*TODO: Setup s3*
Config scrape *logs* with *promtail*, create file `promtail-config.yaml` and setup:
- Scrape logs container:
```yaml
- job_name: container_logs
docker_sd_configs:
- host: unix:///var/run/docker.sock
refresh_interval: 5s
relabel_configs:
- source_labels: ['__meta_docker_container_name']
regex: '/(.*)'
target_label: 'container'
```
- Scrape logs systems:
```yaml
- job_name: system
static_configs:
- targets:
- localhost
labels:
job: varlogs
__path__: /var/log/*log
```
### Demo
Create simple tool generate logs and containerization this tool. Navigate to file
[entrypoint.sh](fake-logs/entrypoint.sh) and run test:
```bash
➜ domolo git:(master) cd fake-logs
➜ fake-logs git:(master) ✗ chmod +x entrypoint.sh
➜ fake-logs git:(master) ✗ ./entrypoint.sh
2022-12-08T13:20:00Z ERROR An error is usually an exception that has been caught and not handled.
2022-12-08T13:20:00Z DEBUG This is a debug log that shows a log that can be ignored.
2022-12-08T13:20:01Z WARN A warning that should be ignored is usually at this level and should be actionable.
2022-12-08T13:20:03Z ERROR An error is usually an exception that has been caught and not handled.
2022-12-08T13:20:05Z ERROR An error is usually an exception that has been caught and not handled.
2022-12-08T13:20:09Z INFO This is less important than debug log and is often used to provide context in the current task.
2022-12-08T13:20:13Z ERROR An error is usually an exception that has been caught and not handled.
2022-12-08T13:20:15Z DEBUG This is a debug log that shows a log that can be ignored.
2022-12-08T13:20:16Z INFO This is less important than debug log and is often used to provide context in the current task.
2022-12-08T13:20:17Z INFO This is less important than debug log and is often used to provide context in the current task.
...
```
Then, add `fake-logs` in [docker-compose.yml](docker-compose.yml)
```yaml
# Fake Logs
flogs:
image: ductn4/flog:v1 # Set your name image :)
build:
context: ./fake-logs
dockerfile: Dockerfile
container_name: fake-logs
restart: always
networks:
- monitor-net
labels:
org.label-schema.group: "monitoring"
```
or checkout [docker-compose.with-flogs.yml](docker-compose.with-flogs.yml)
and run command `docker-compose -f docker-compose.with-flogs.yml up -d`
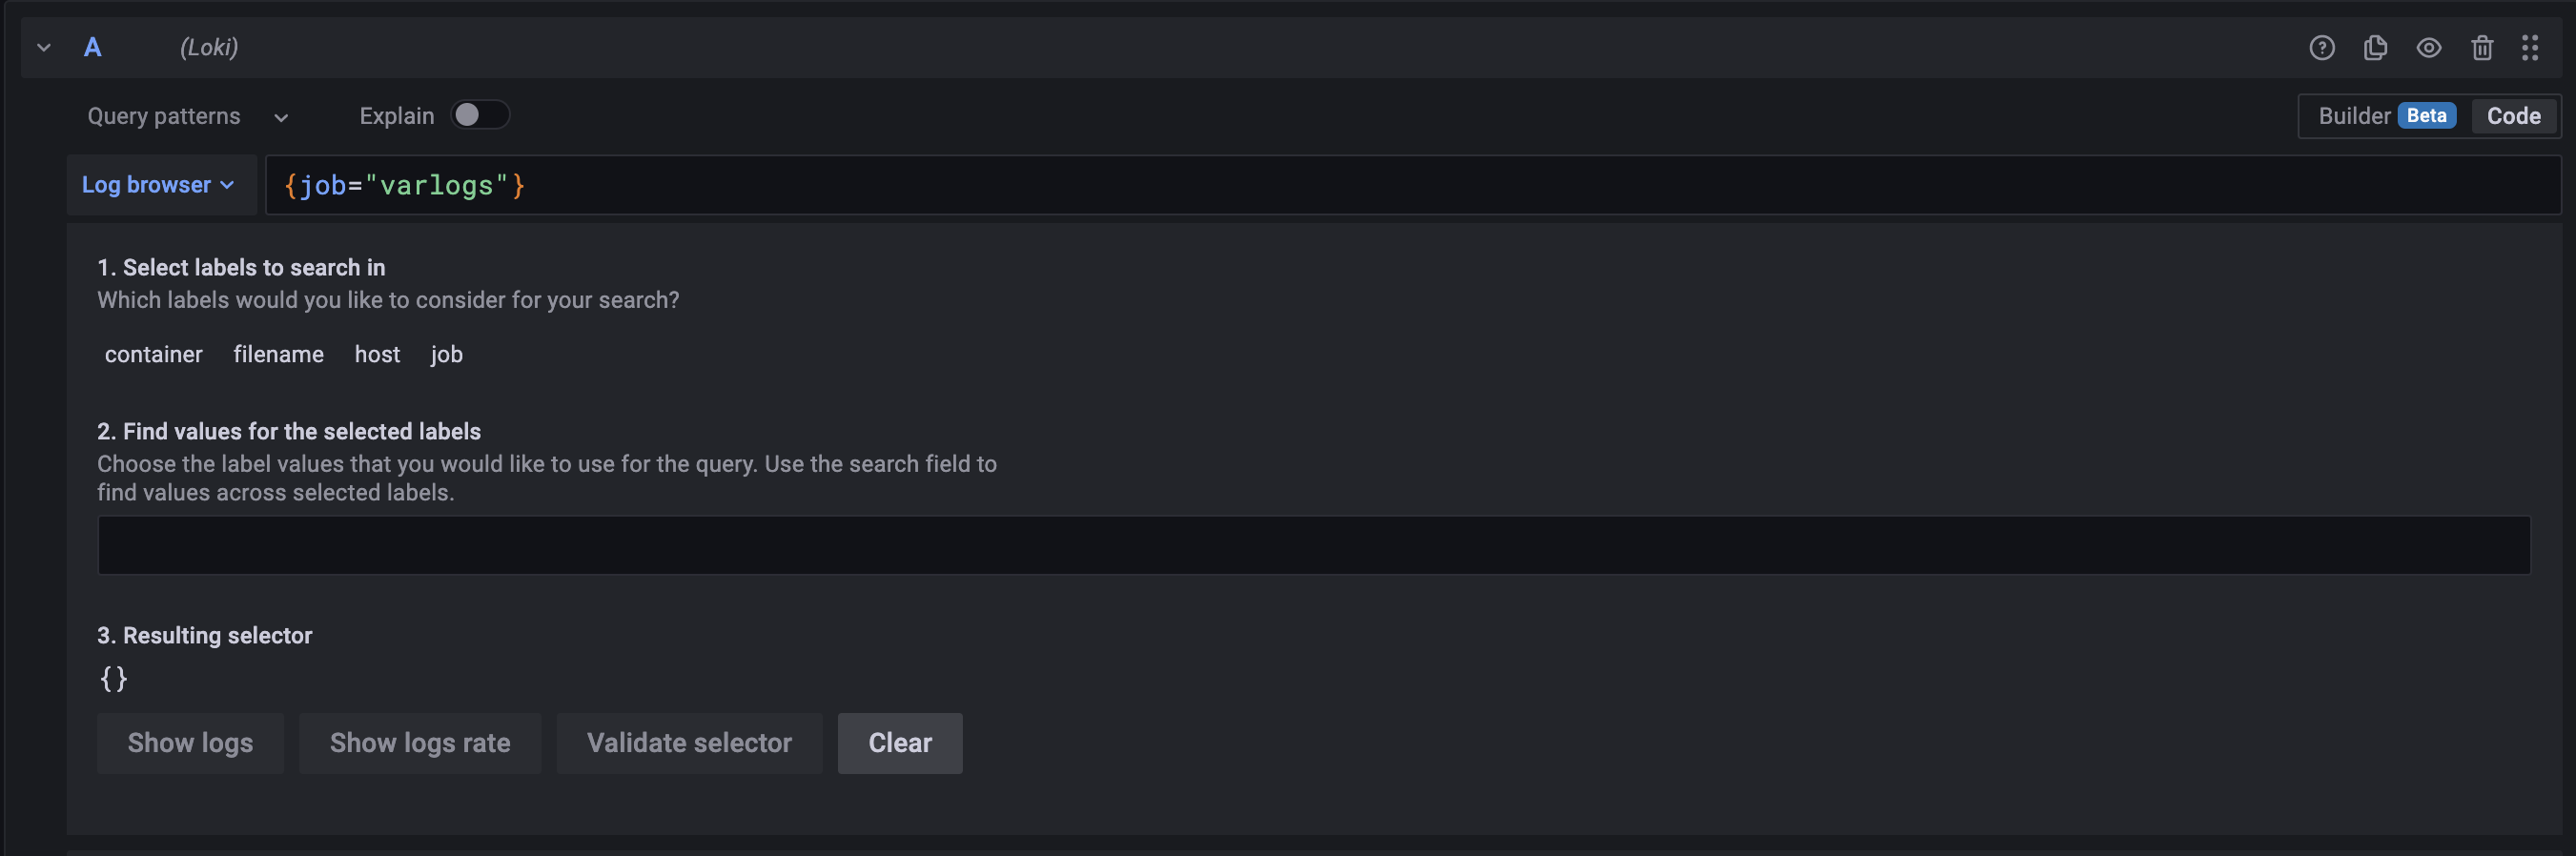
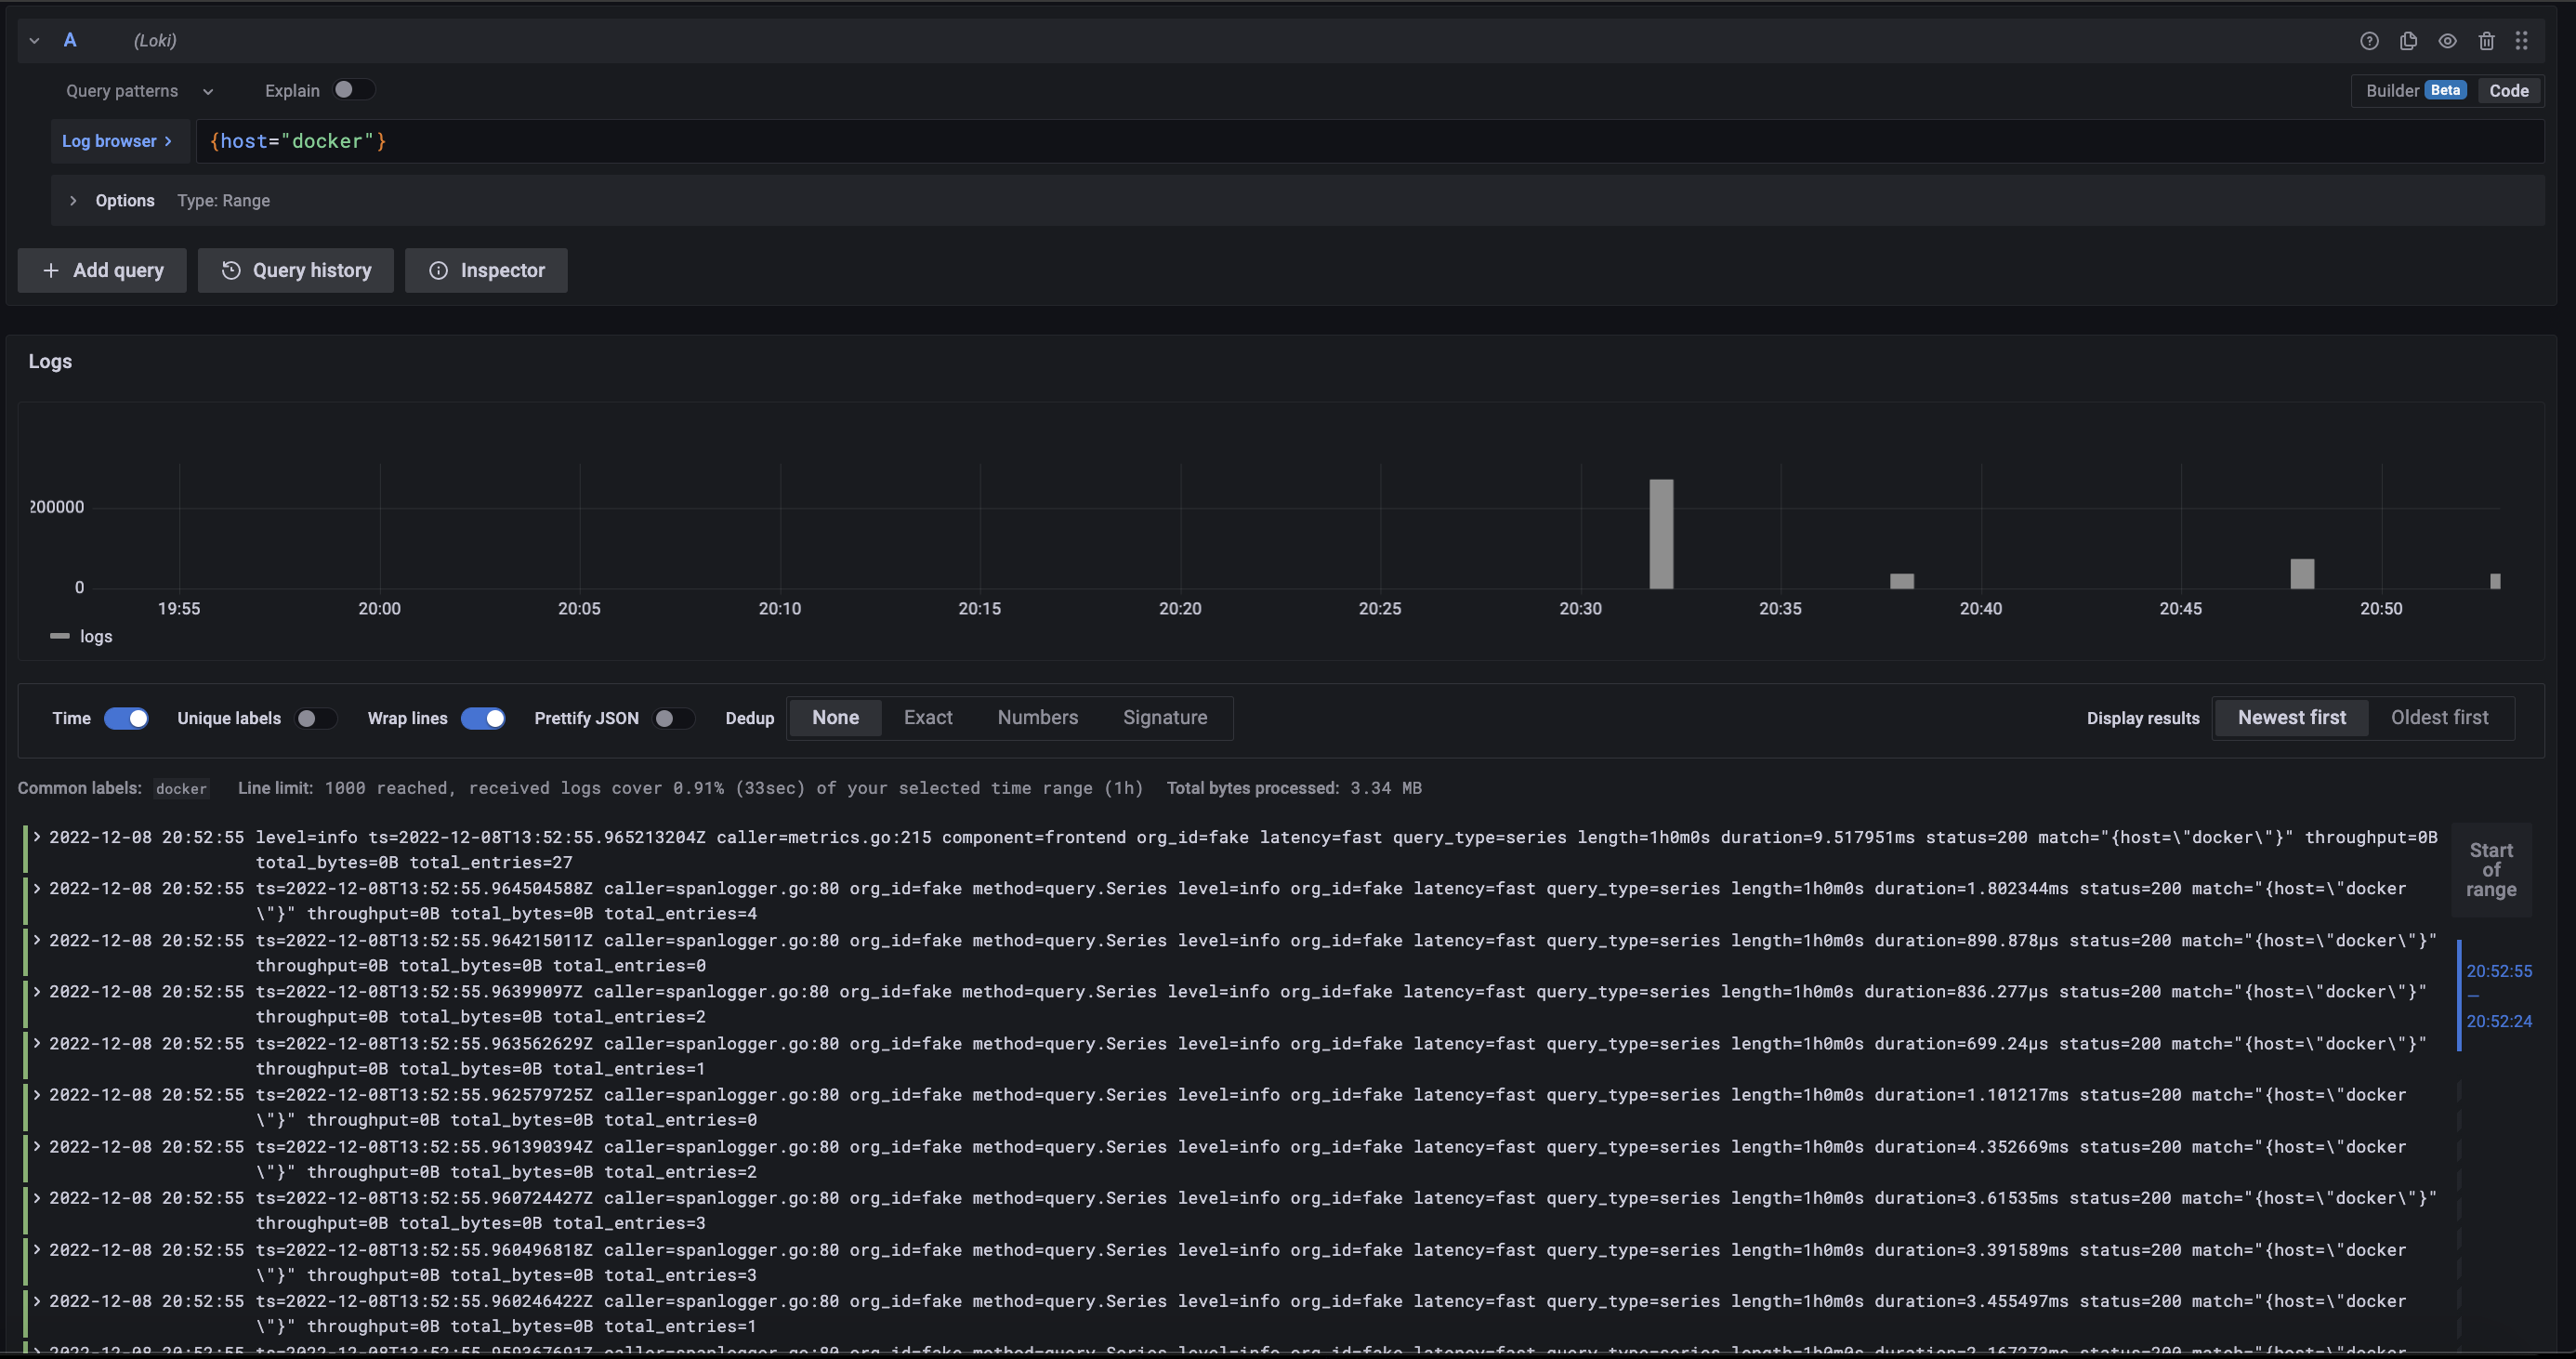
Navigate *[grafana](localhost:3000)* and open `Explore`:
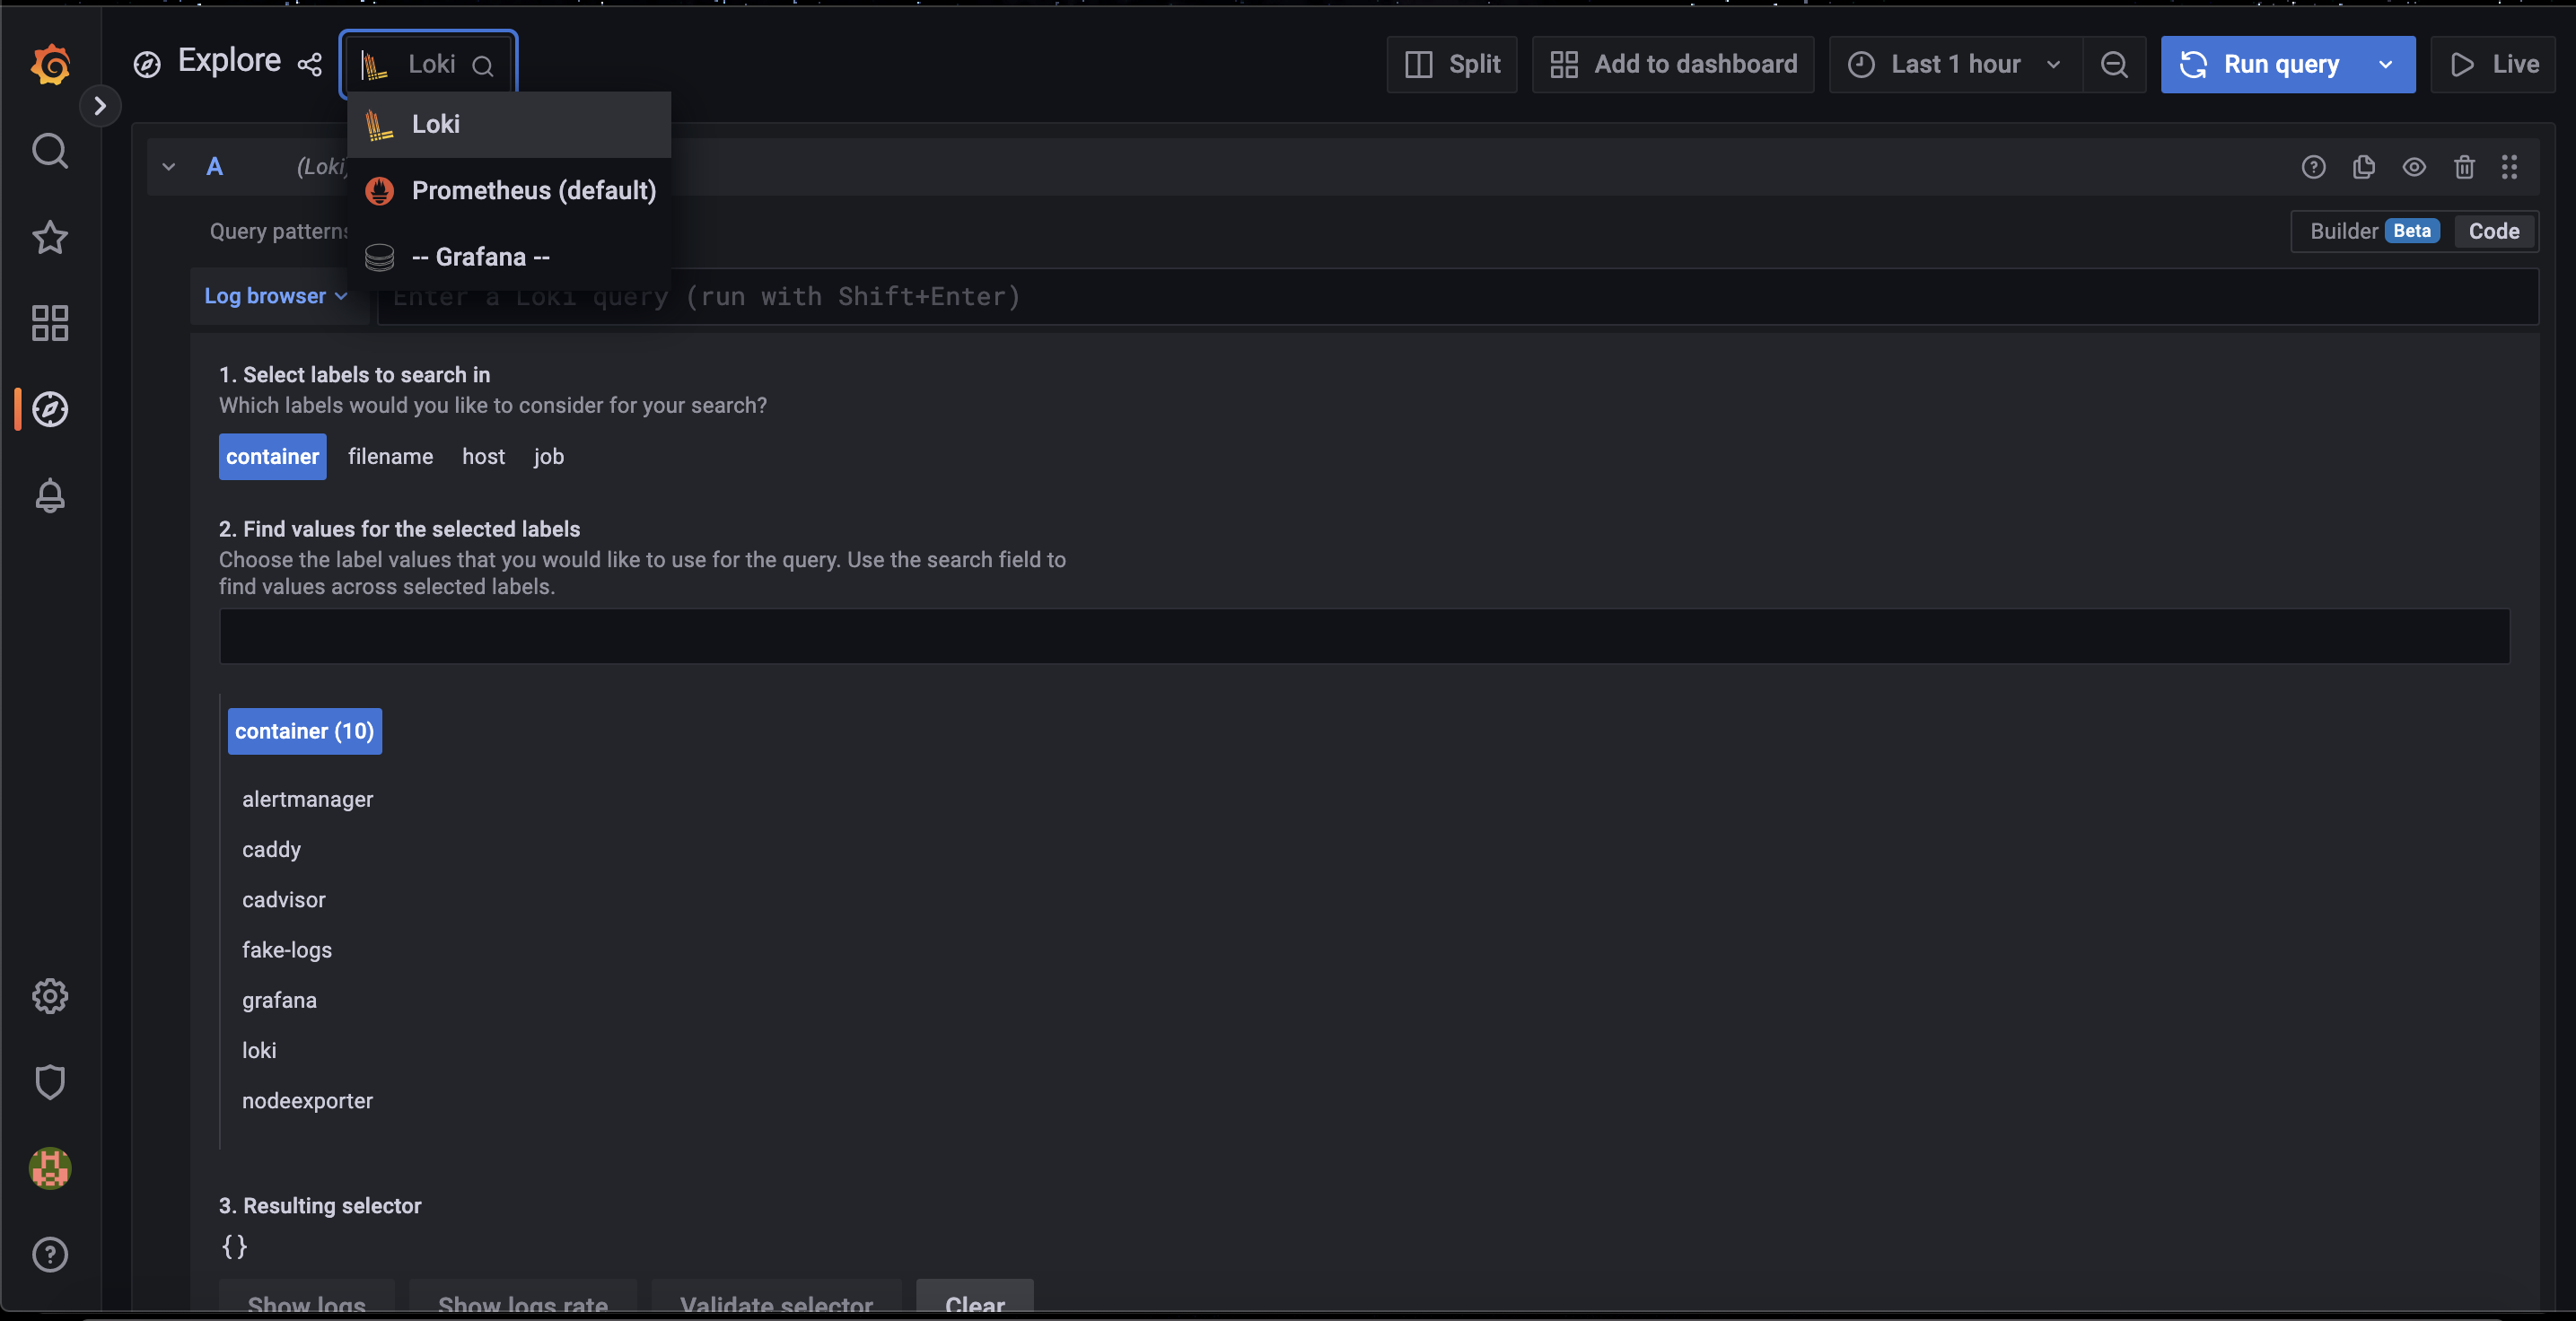
So, we can select `labels` and views `logs`:
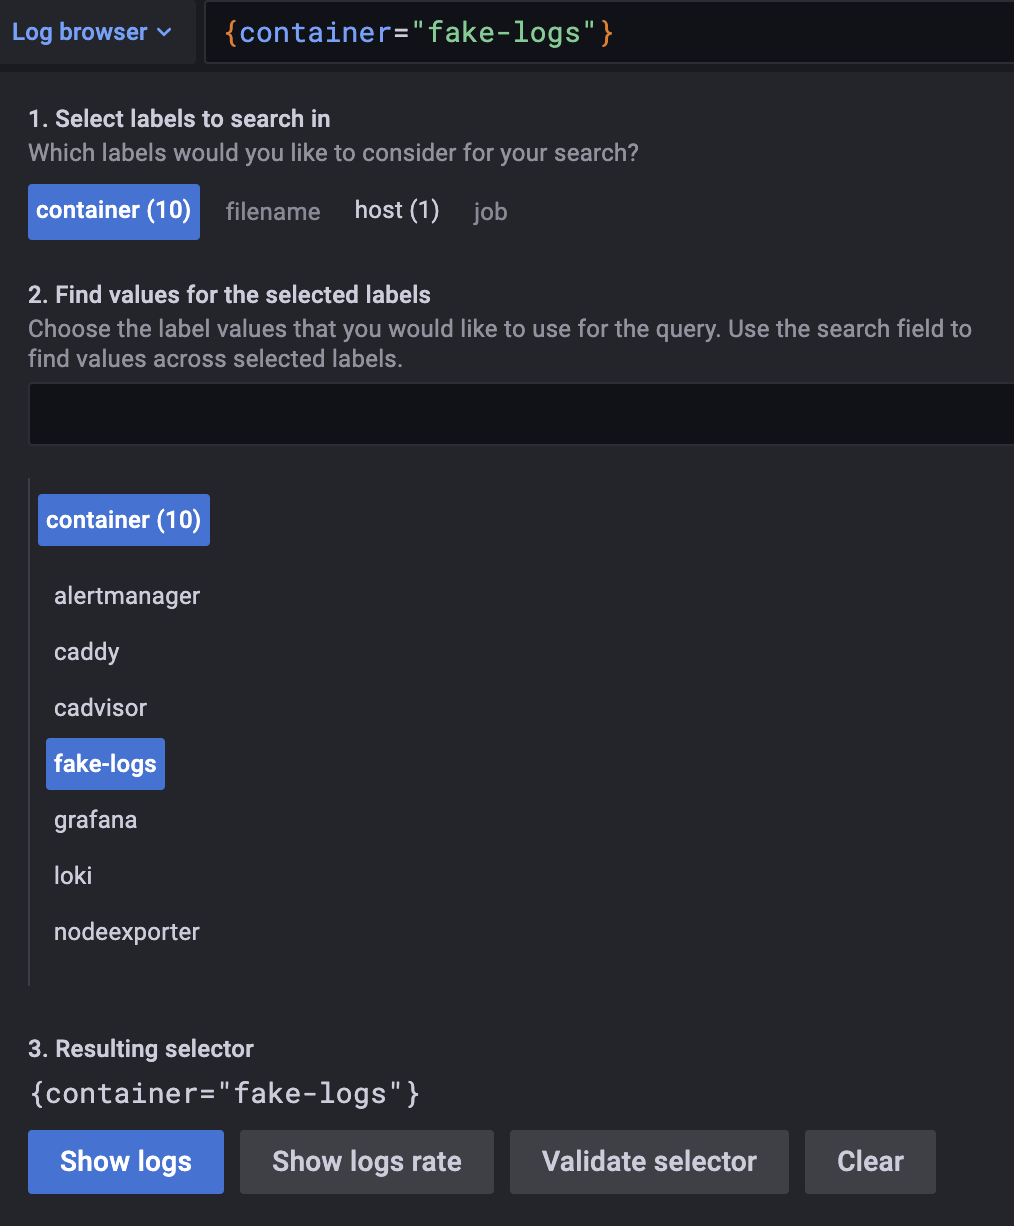
Ex: Select `label container` and view log container `fake-logs`:
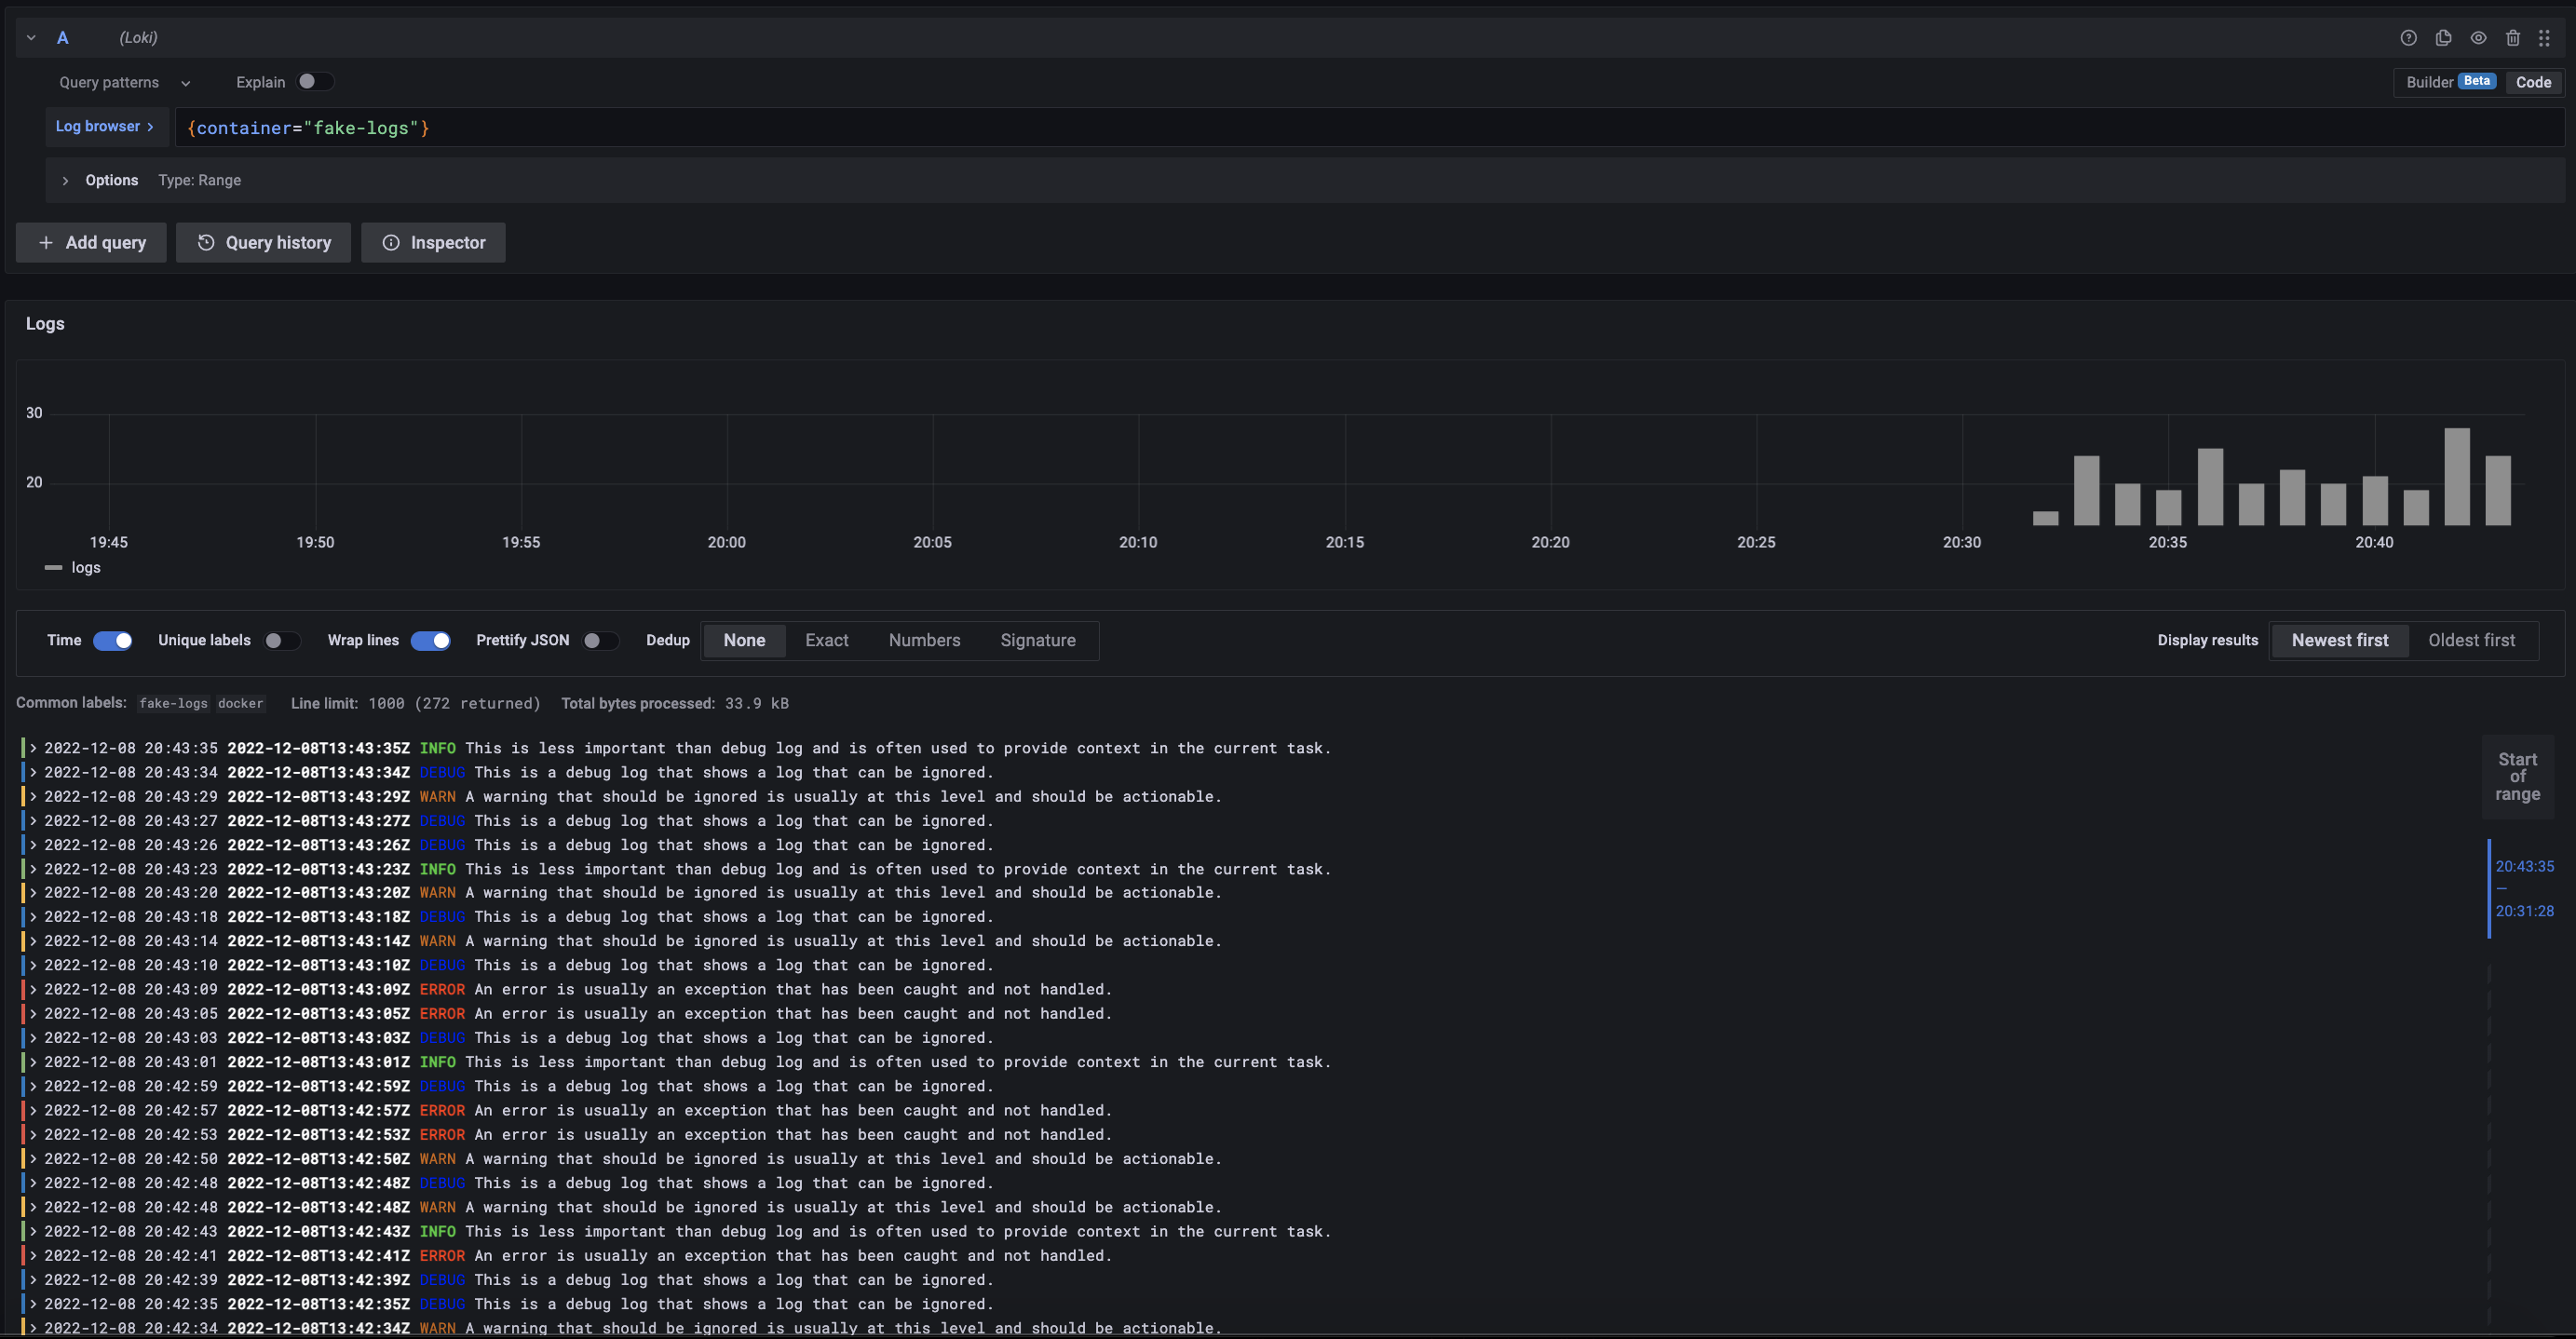
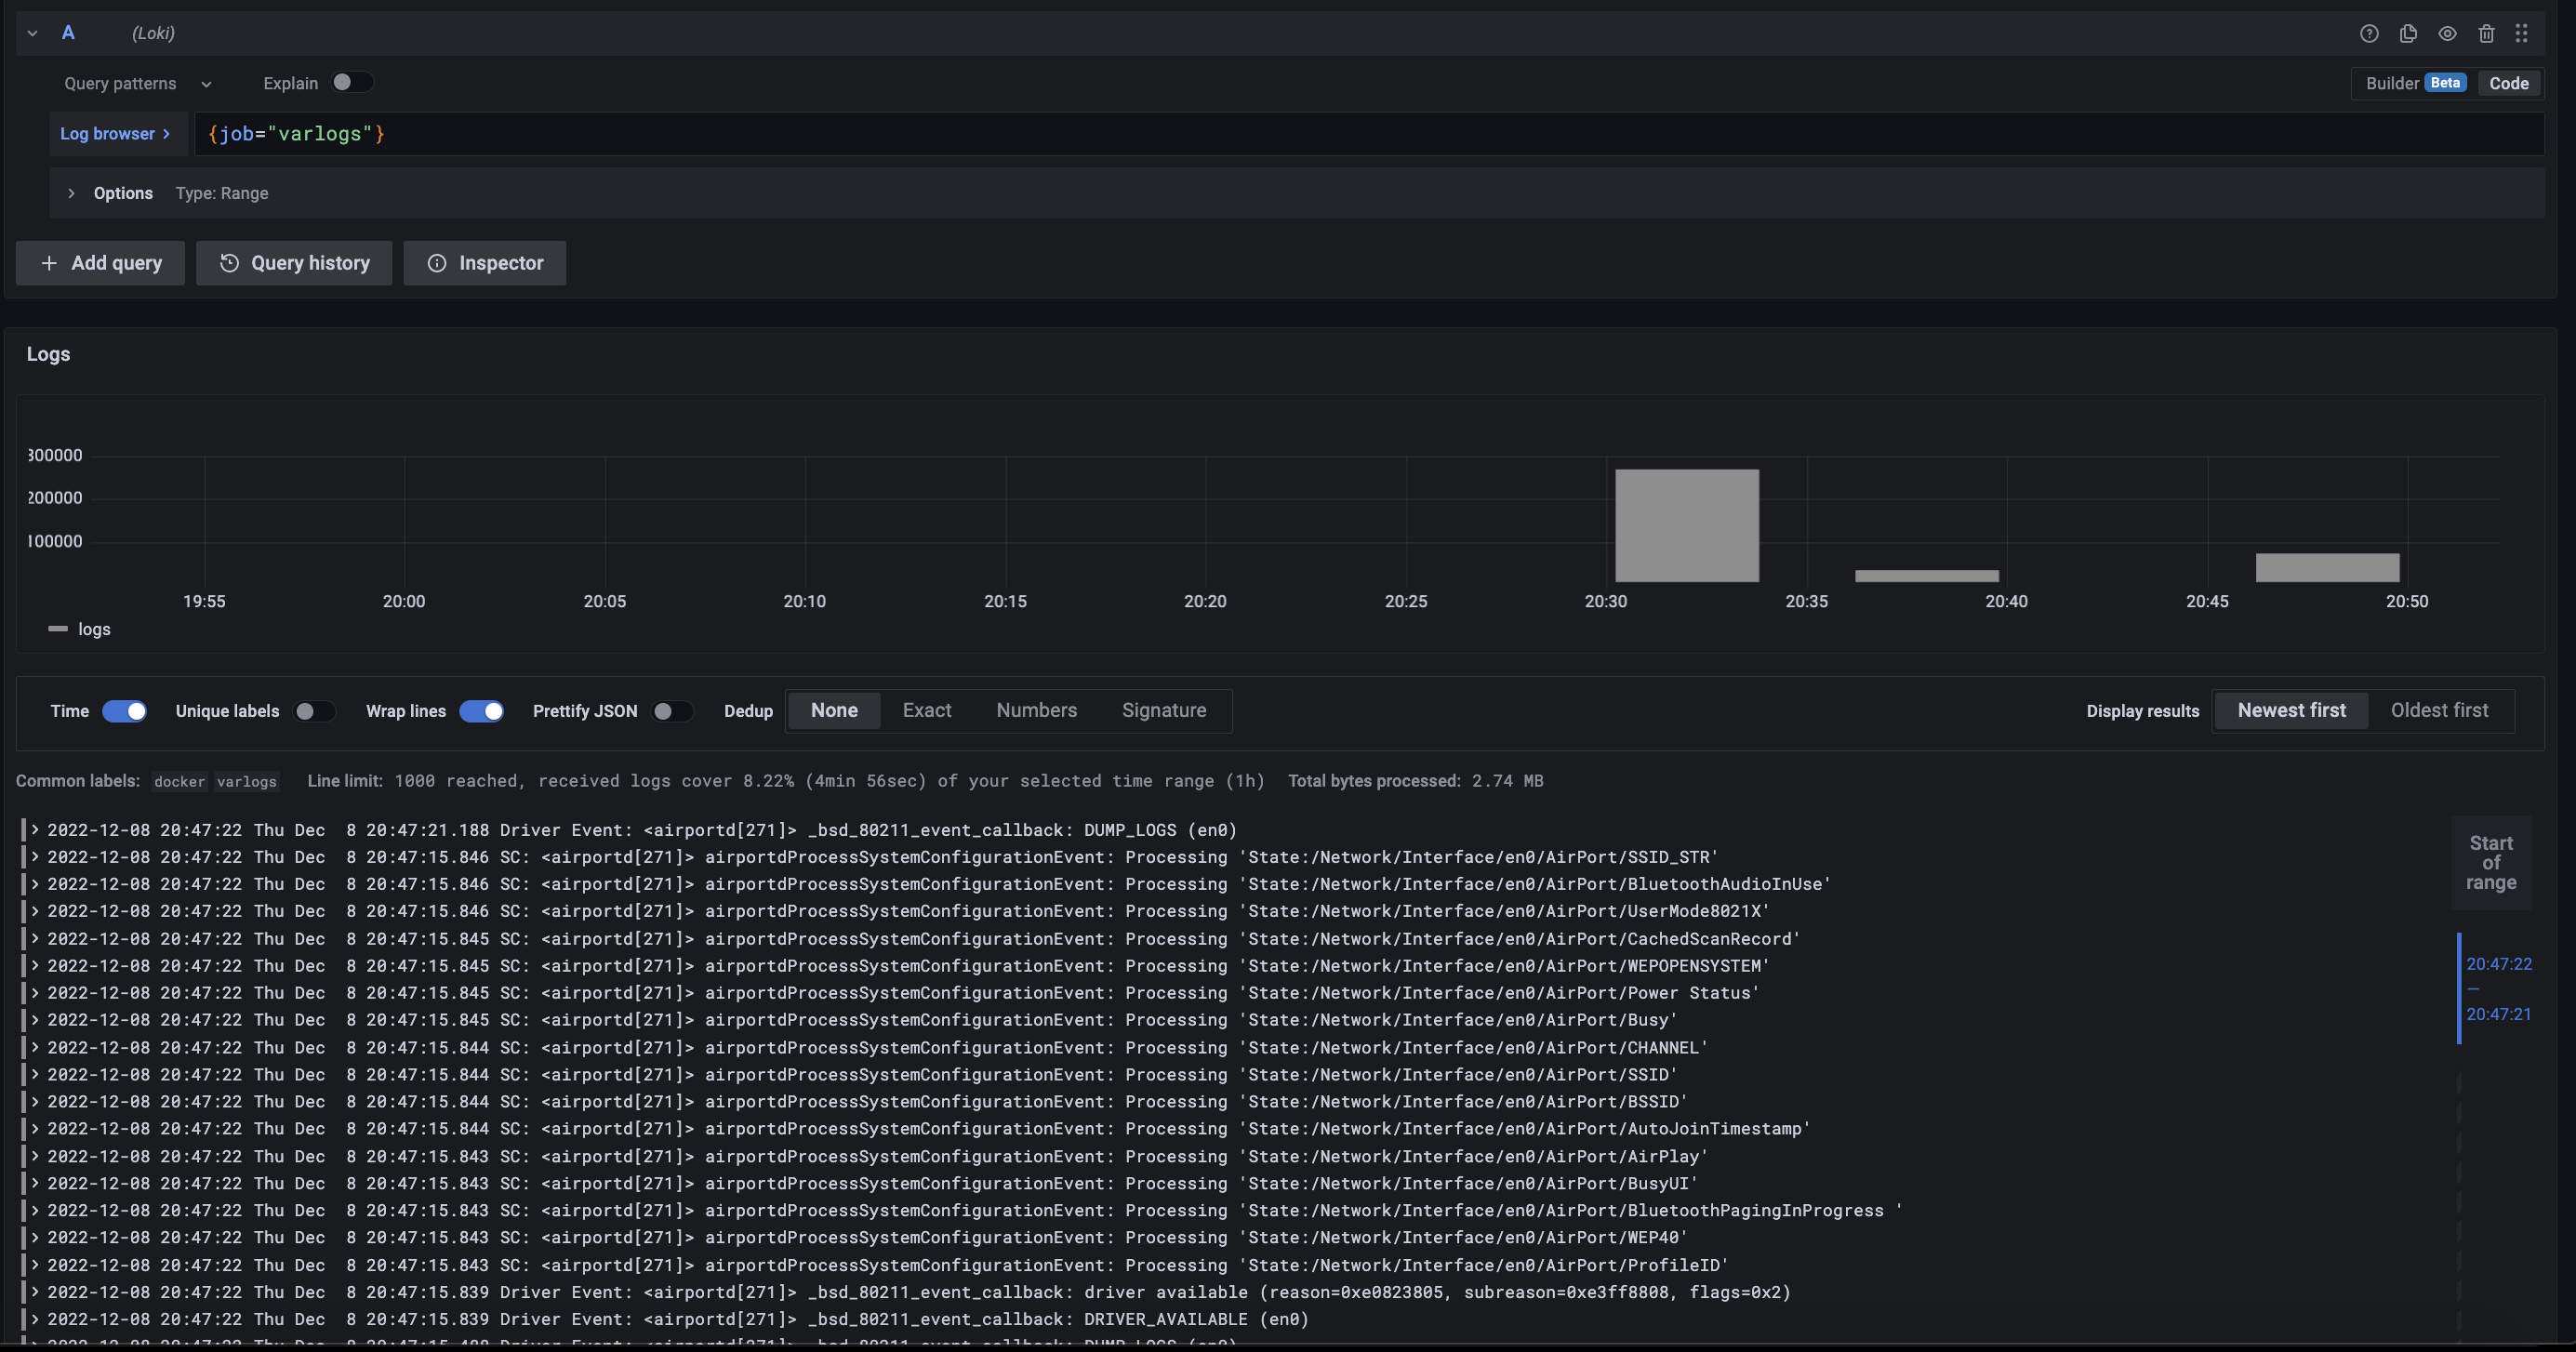
More logs: *logs system, other containers, ....*
## Show your support
Give a ⭐ if you like *domolo* ❤️
## Contribution
All contributions are welcomed in this project!
## License
The MIT License (MIT). Please see [LICENSE](LICENSE) for more information.