https://github.com/dylanljones/mplstyles
Collection of scientific Matplotlib styles
https://github.com/dylanljones/mplstyles
Last synced: 4 months ago
JSON representation
Collection of scientific Matplotlib styles
- Host: GitHub
- URL: https://github.com/dylanljones/mplstyles
- Owner: dylanljones
- License: mit
- Created: 2022-11-03T14:22:16.000Z (over 2 years ago)
- Default Branch: master
- Last Pushed: 2025-03-10T18:53:13.000Z (4 months ago)
- Last Synced: 2025-03-17T17:38:38.364Z (4 months ago)
- Language: Python
- Homepage:
- Size: 1.35 MB
- Stars: 3
- Watchers: 1
- Forks: 0
- Open Issues: 1
-
Metadata Files:
- Readme: README.md
- License: LICENSE
Awesome Lists containing this project
README
        # Matplotlib styles for scientific computing

## Installation

Install from GitHub via

```commandline

pip install git+https://github.com/dylanljones/mplstyles.git@VERSION

```

where `VERSION` is a optional release, tag or branch name.

## Introduction

Matplotlib allows you to customize the properties and default styles of plots.

There are three ways to customize Matplotlib (see [mplstyle] for more information):

- [Setting rcParams at runtime](https://matplotlib.org/stable/tutorials/introductory/customizing.html#customizing-with-dynamic-rc-settings)

- [Using style sheets](https://matplotlib.org/stable/tutorials/introductory/customizing.html#customizing-with-style-sheets)

- [Changing your matplotlibrc file](https://matplotlib.org/stable/tutorials/introductory/customizing.html#customizing-with-matplotlibrc-files)

> **Warning**: Setting rcParams at runtime takes precedence over style sheets,

style sheets take precedence over ``matplotlibrc`` files.

This project uses the third option and is intended as a collection of usefull

matplotlibrc style files for scientific plotting.

Please feel free to add your own favourite styles to the libary! Start from the empty

template file ``default.mplstyle`` and change the parameters you like.

If you are happy with the style, add the file to the ``mplstyles`` package and open

a pull request.

> **Note**: If you are using PyCharm to edit the ``*.mplstyle`` files, right-click on the file

and click 'Override File Type'. There, choose the ``Ini`` file-type. This enables

some synthax highlighting, which makes it easier to find uncommented sections.

## Usage

The included styles of ``mplstyles`` can be applied with the ``use_mplstyle`` method:

````python

from mplstyles import use_mplstyle

use_mplstyle("figure")

...

````

The can also be used in a context:

````python

from mplstyles import mplstyle_context

with mplstyle_context("figure"):

    ...

````

Alternatively, the included styles can be registered and used via the normal

``plt.style`` method:

````python

from mplstyles import init_mplstyles

init_mplstyles()  # register the styles

plt.style.use("figure")

...

with plt.style.context("figure"):

    ...

````

You can also combine styles:

````python

from mplstyles import use_mplstyle

use_mplstyle("figure", "aps")

...

````

A list of all included style files can be printed like this:

````python

from mplstyles import get_mplstyles

print(get_mplstyles())

````

The rc-files are contained in the ``.../mplstyles/styles/`` directory.

## Primary styles

The main styles are ``plot`` and ``figure``. The ``plot`` style is intended for plotting

results while working, preparing or creating a pre-print. The ``figure`` style should be

used for generating the final figures for publications.

## Journal styles

The journal styles are *additive* and should be used with the primary styles.

They define the format specifications for each jornal. The style for a single

column figure for the APS fournal, for example, can be used as follows:

````python

from mplstyles import use_mplstyle

use_mplstyle("figure", "aps")

...

````

You also can mix in the figure size of 1.5- or double-column figures via the context

manager:

````python

from mplstyles import use_mplstyle, mplstyle_context

use_mplstyle("figure", "aps")

...  # single-coluimn plots

with mplstyle_context("aps1.5"):

    ... # 1.5-column plots

with mplstyle_context("aps2"):

    ... # double-column plots

````

## Examples

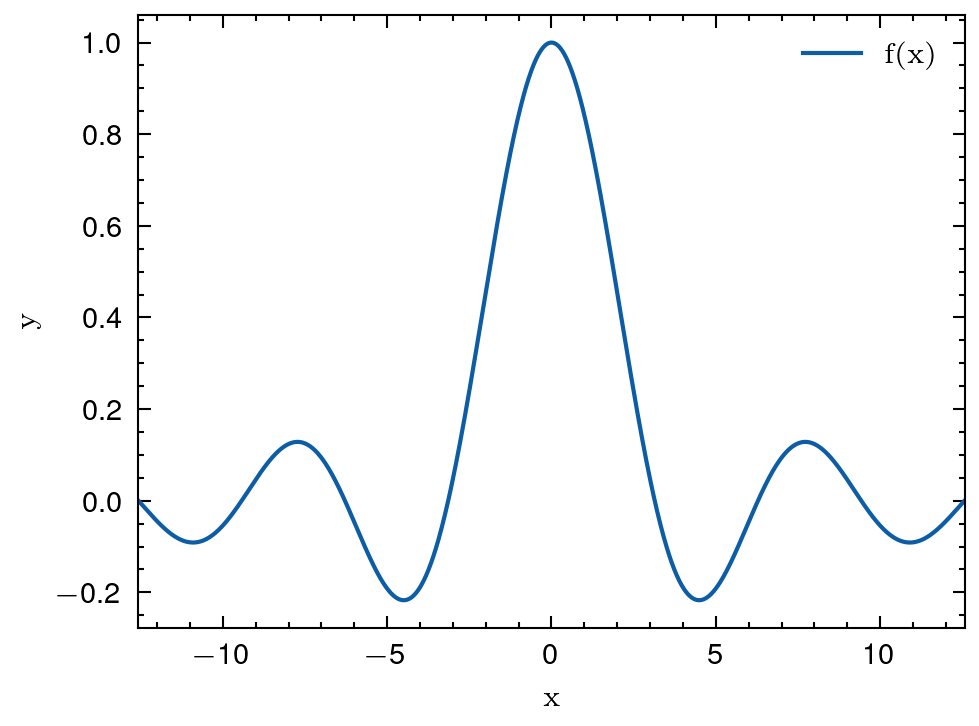
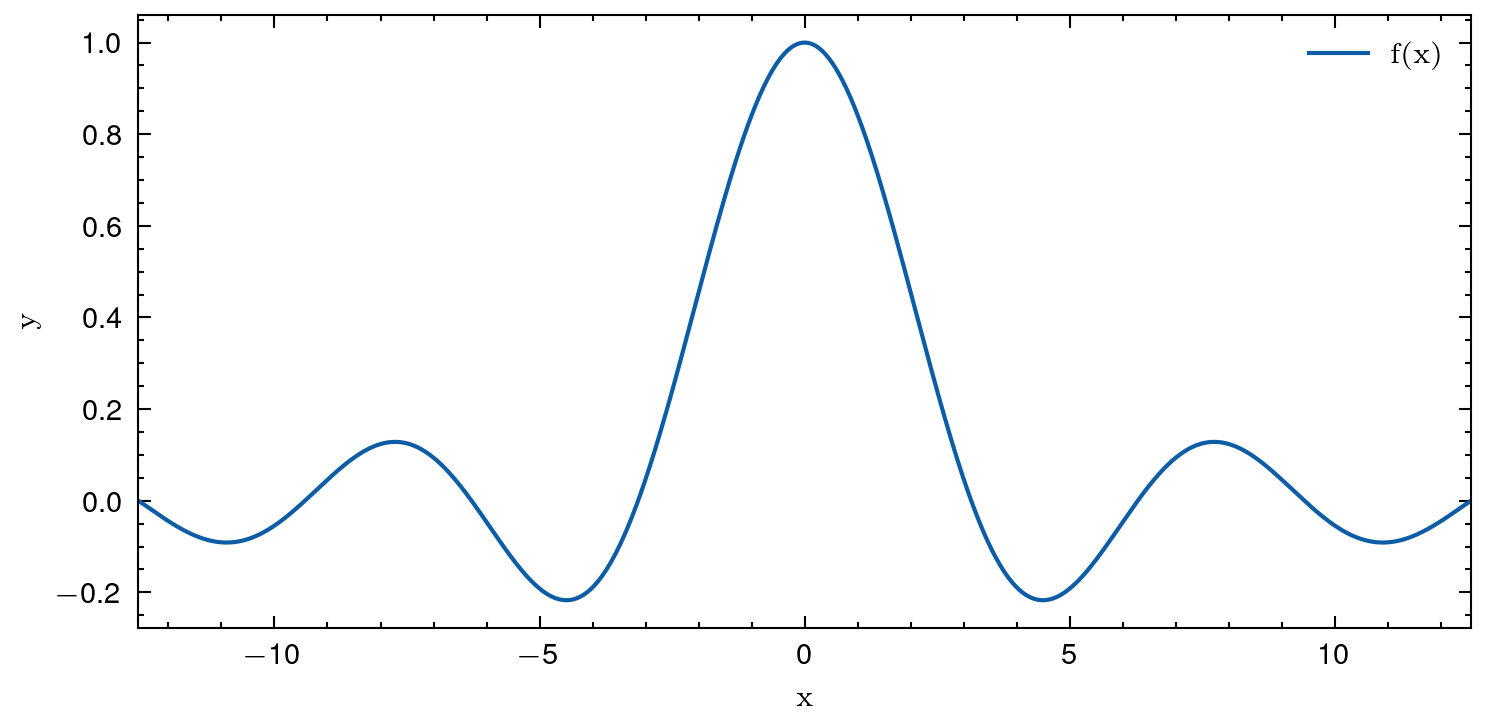
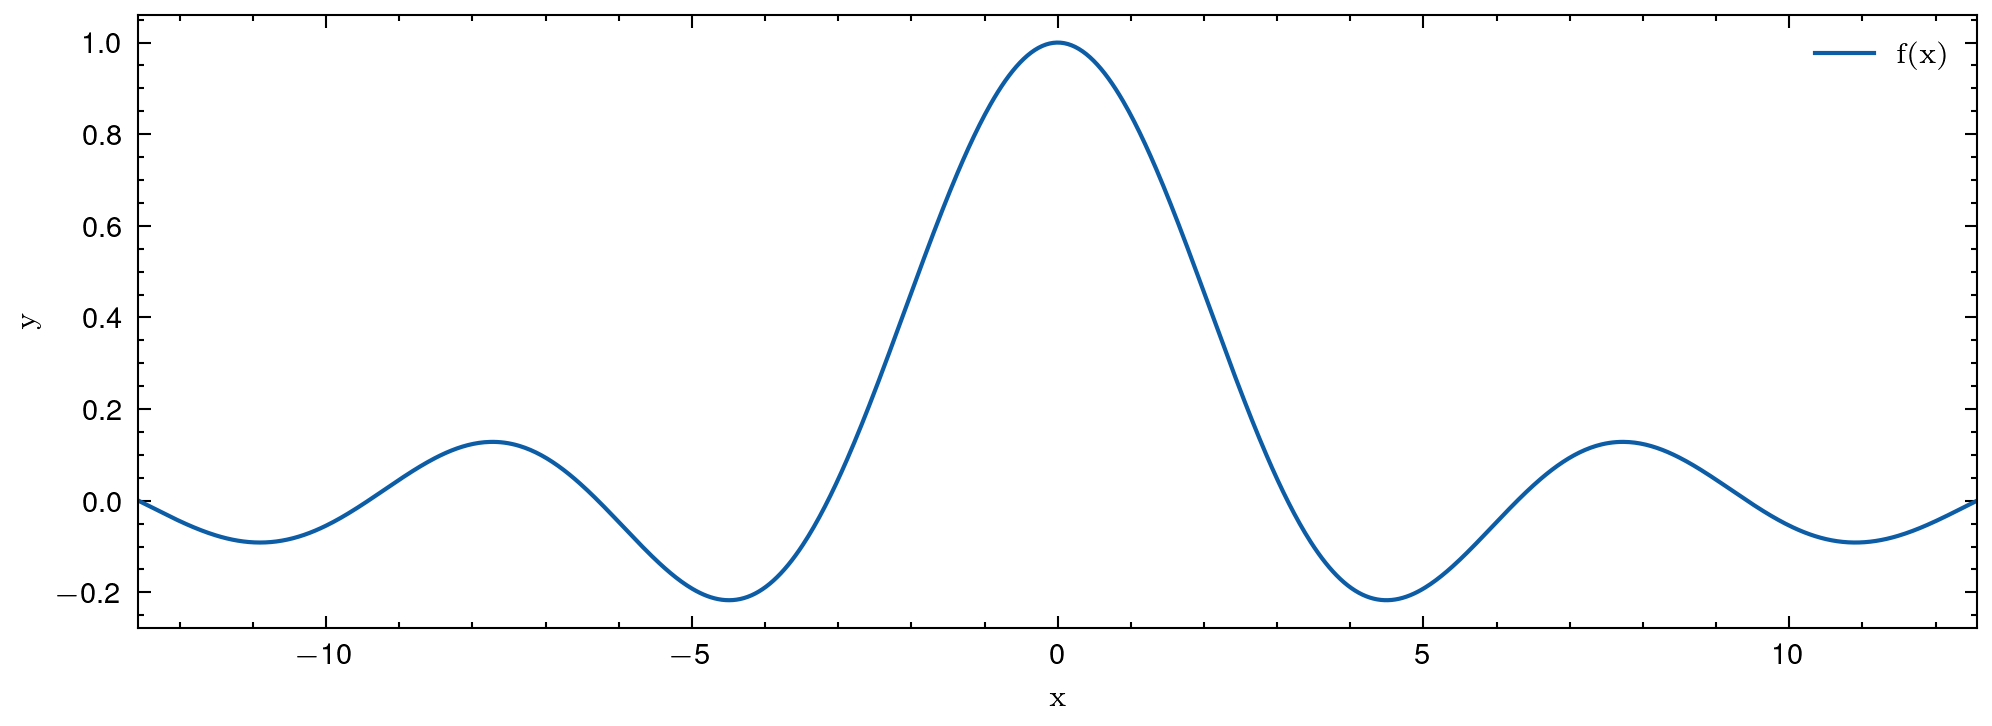
All examples are generated with the following code and by applying the different styles:

````python

fig, ax = plt.subplots()

ax.plot(x, y, label="f(x)")

ax.set_xlabel("x")

ax.set_ylabel("y")

ax.legend()

````

### Primary styles

````python

use_mplstyle("plot")

````


````python

use_mplstyle("figure")

````


### Journals

#### APS

Style for generatig single-column figures for APS journals (physical review, ...)

````python

use_mplstyle("figure", "aps")

````


Extend to 1.5- or double-column figures:

````python

use_mplstyle("figure", "aps", "aps1.5")

````


````python

use_mplstyle("figure", "aps", "aps2")

````


[mplstyle]: https://matplotlib.org/stable/tutorials/introductory/customizing.html