https://github.com/ecandotti/data-visualizer
📊 Data Analyzer | Project in ReactJS
https://github.com/ecandotti/data-visualizer
fusejs react
Last synced: about 1 month ago
JSON representation
📊 Data Analyzer | Project in ReactJS
- Host: GitHub
- URL: https://github.com/ecandotti/data-visualizer
- Owner: ecandotti
- License: mit
- Created: 2021-01-28T04:06:52.000Z (over 5 years ago)
- Default Branch: master
- Last Pushed: 2021-03-23T16:35:27.000Z (about 5 years ago)
- Last Synced: 2025-06-20T18:43:41.093Z (12 months ago)
- Topics: fusejs, react
- Language: JavaScript
- Homepage:
- Size: 534 KB
- Stars: 0
- Watchers: 1
- Forks: 0
- Open Issues: 1
-
Metadata Files:
- Readme: README.md
- License: LICENSE
Awesome Lists containing this project
README
# 📊 Data Visualizer
## Project in ReactJS for Front End cours (Ynov)
### Size of project (builded) : 1,2MB
Library used | Utility
------------ | -------------
ReactJS | Framwork Front-End
React Router | Router in app
React Icons | Icons
Prop-Types | Validation of props type
FuseJS | Search in object
ChartJS | Graphics
Snowpack ✨ : lightning-fast frontend build tool
Babel
ESLint / Prettier for beautiful code 🥰
Launch the code :
*I used APIKEY of google to display the position of human in google maps*
```
git clone https://github.com/ecandotti/data-visualizer
cd /data-visualizer
npm i
npm start
```
Build the project :
```
npm run build
```
We can :
- Read data in array 📁
- Search specific details thanks to search bar 🔍
- See graphs that adapt according to the data received 📊
- Edit data 📝
- Reset all data ❌
- Filter the data (by gender or/and favorite fruit) 👨🎨🍇
- Download the data (edited) ⬇︎
To Do :
- [X] Creating project
- [X] getData from URL
- [X] Display data in array
- [X] Search function
- [X] Chart JS
- [X] Edit data
- [X] Download data edited
- [X] Comment all project
- [X] Custom filter
- [ ] Test unitaire
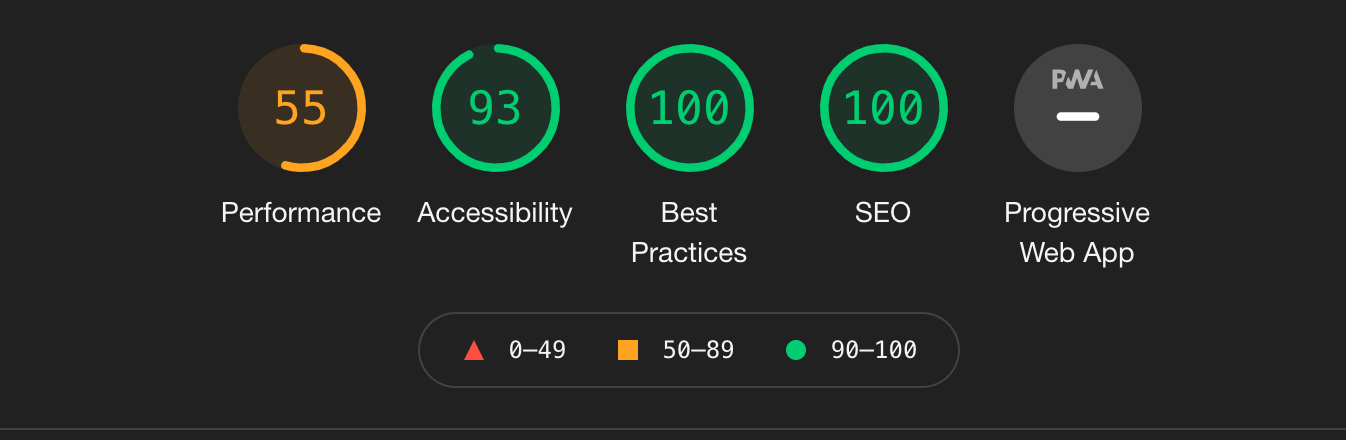
### Lighthouse Desktop
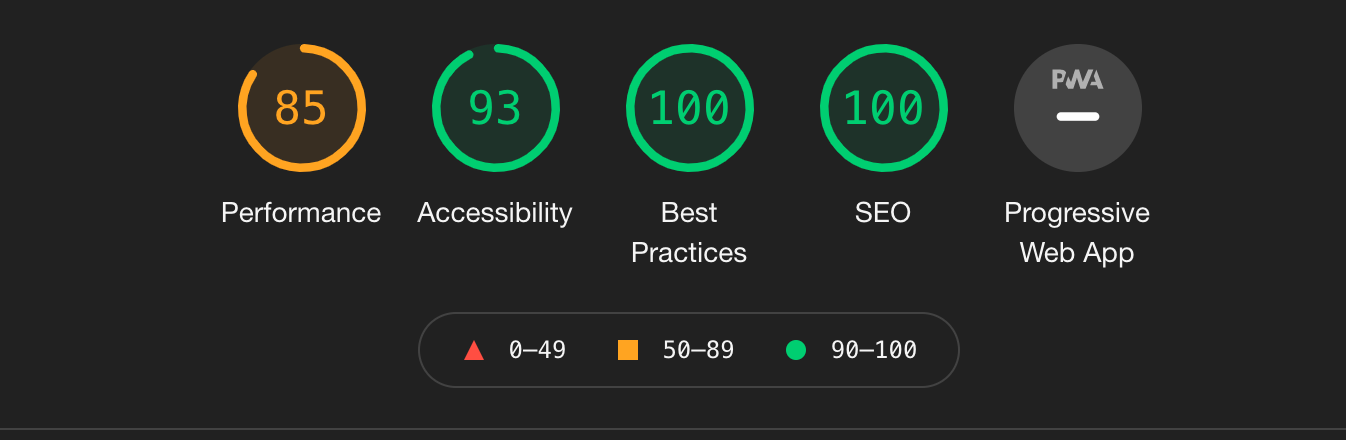
### Lighthouse Mobile