https://github.com/eddelbuettel/td
R interface to 'twelvedata' API
https://github.com/eddelbuettel/td
Last synced: about 1 year ago
JSON representation
R interface to 'twelvedata' API
- Host: GitHub
- URL: https://github.com/eddelbuettel/td
- Owner: eddelbuettel
- Created: 2021-02-06T14:16:09.000Z (over 5 years ago)
- Default Branch: master
- Last Pushed: 2024-11-17T23:26:44.000Z (over 1 year ago)
- Last Synced: 2025-06-20T17:06:12.737Z (about 1 year ago)
- Language: R
- Size: 177 KB
- Stars: 16
- Watchers: 4
- Forks: 4
- Open Issues: 0
-
Metadata Files:
- Readme: README.md
- Changelog: ChangeLog
Awesome Lists containing this project
- awesome-quant - td - Interfaces the 'twelvedata' API for stocks and (digital and standard) currencies. (R / Data Sources)
README
## td: R Access to twelvedata
[](https://github.com/eddelbuettel/td/actions?query=workflow%3Aci)
[](https://www.gnu.org/licenses/gpl-2.0.html)
[](https://cran.r-project.org/package=td)
[](https://cran.r-project.org/package=td)
[](https://www.r-pkg.org/pkg/td)
[](https://github.com/eddelbuettel/td)
### Motivation
[twelvedata](https://twelvedata.com) provides a very rich REST API, see
the [documentation](https://twelvedata.com/docs). While a (free) login
and a (free, permitting limited but possibly sufficient use) API key are
required, the provided access is rich to set up simple R routines. This
package does that.
### Example
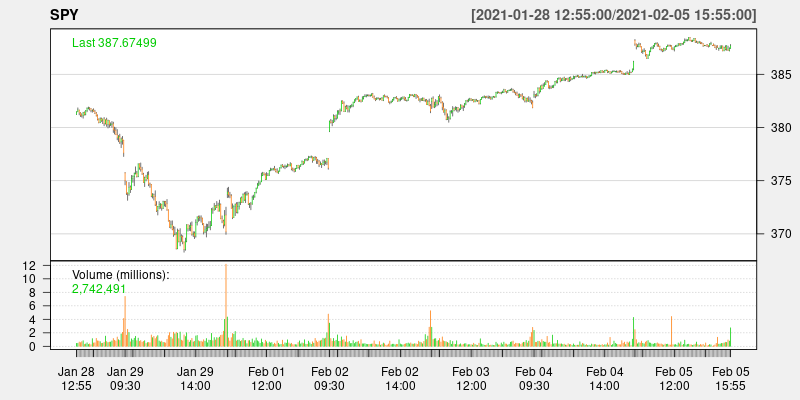
Here we are running (some) code from shown in `example(time_series)`
```r
> library(td)
> data <- time_series("SPY", "5min", outputsize=500, as="xts")
> if (requireNamespace("quantmod", quietly=TRUE)) {
> suppressMessages(library(quantmod)) # suppress some noise
> chartSeries(data, name=attr(data, "symbol"), theme="white") # convenient plot for OHLCV
> }
```
retrieves an `xts` object (provided [xts](https://cran.r-project.org/package=xts) is installed)
and produces a chart like this:
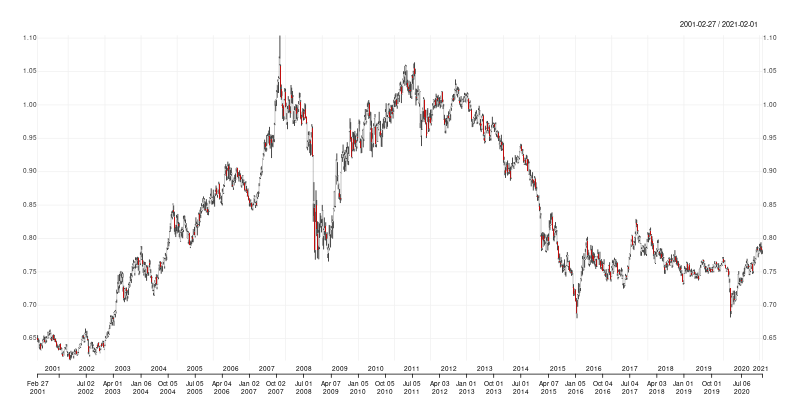
The package can also be used without attaching it. The next example retrieves twenty years of weekly
CAD/USD foreign exchange data using a direct `td::time_series()` call with having the package
loaded. The API key is automagically set (if it is in fact provided either in the user config file
or as an environment variable). Also shown by calling `str()` on the return object is the metadata
attach after each request:
```r
> cadusd <- td::time_series(sym="CAD/USD", interval="1week", outputsize=52.25*20, as="xts")
> str(cadusd)
An ‘xts’ object on 2001-02-27/2021-02-01 containing:
Data: num [1:1045, 1:4] 0.651 0.646 0.644 0.638 0.642 ...
- attr(*, "dimnames")=List of 2
..$ : NULL
..$ : chr [1:4] "open" "high" "low" "close"
Indexed by objects of class: [Date] TZ: UTC
xts Attributes:
List of 6
$ symbol : chr "CAD/USD"
$ interval : chr "1week"
$ currency_base : chr "Canadian Dollar"
$ currency_quote: chr "US Dollar"
$ type : chr "Physical Currency"
$ accessed : chr "2021-02-06 15:16:29.209635"
>
```
As before, it can be plotted using a function from package
[quantmod](https://cran.r-project.org/package=quantmod); this time we use the newer
`chart_Series()`:
```r
> quantmod::chart_Series(cadusd, name=attr(data, "symbol"))
```
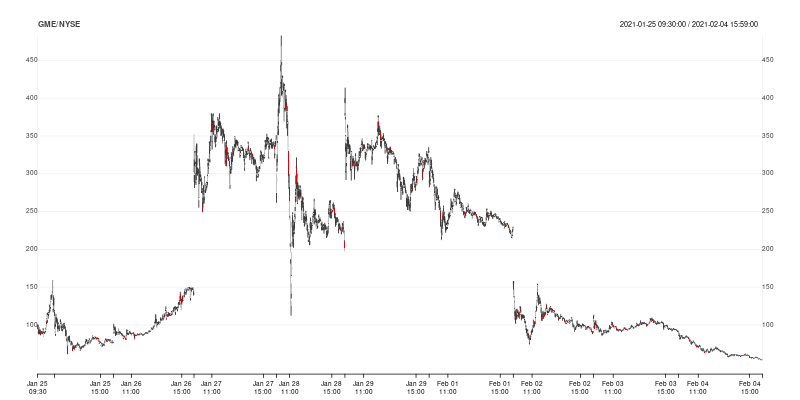
As the returned is a the very common and well-understood [xts] format, many other plotting functions
can be used as-is. Here is an example also showing how historical data can be accessed. We retrieve
minute-resolution data for `GME` during the late January / early February period:
```r
> gme <- time_series("GME", "1min",
+ start_date="2021-01-25 09:30:00",
+ end_date="2021-02-04 16:00:00", as="xts")
```
Note the use of exchange timestamps (NYSE is open from 9:30 to 16:00 local time).
We can plot this again using `quantmod::chart_Series()` showing how to display ticker symbol
and exchange as a header:
```r
> quantmod::chart_Series(gme, name=paste0(attr(gme, "symbol"), "/", attr(gme, "exchange")))
```
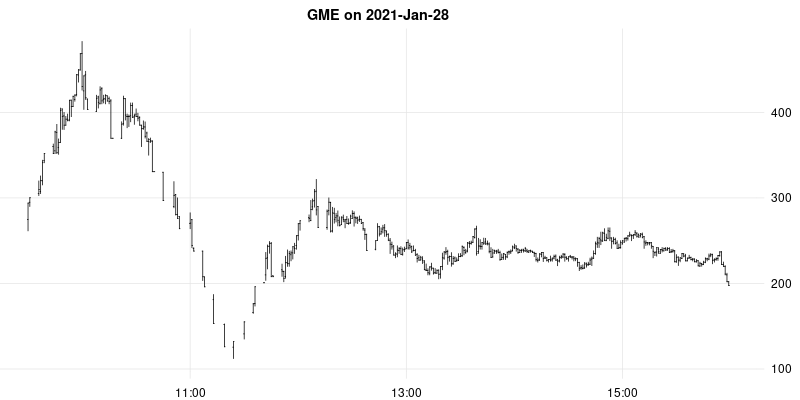
Naturally, other plotting functions and packages can be used. Here we use the _same dataset but
efficiently subset_ using a key `xts` feature and fed into CRAN package
[rtsplot](https://rtsvizteam.bitbucket.io/pkg/rtsplot/#/) and requesting OHLC instead of line plot.
```r
> rtsplot::rtsplot(gme["20210128"], main="GME on 2021-Jan-28", type="ohlc")
```
If a vector of symbols is used in the query, a list of results is returned:
```r
> res <- time_series(c("SPY", "QQQ", "IWM", "EEM"), outputsize=300, as="xts")
> op <- par(mfrow=c(2,2))
> sapply(res, function(x) quantmod::chart_Series(x, name=attr(x, "symbol")))
> par(op)
```
As of version 0.0.2, additional `get_quote()` and `get_price()` accessors are available.
As of version 0.0.5, support for reference data has been added.
### Status
Still relatively, but already fairly feature-complete. The package is also officially [recommended
and approved](https://github.com/twelvedata/twelvedata-r-sdk) by [Twelve
Data](https://twelvedata.com), but is developed independently. For an officially supported package,
see their [twelvedata-python](https://github.com/twelvedata/twelvedata-python) package.
### Contributing
Any problem, bug report, or feature request for the package can be submitted and handled most
conveniently as a [Github issue](https://github.com/eddelbuettel/td/issues) in the repository.
Before submitting pull requests, it is frequently preferable to first discuss need and scope in such
an issue ticket. See the file
[Contributing.md](https://github.com/RcppCore/Rcpp/blob/master/Contributing.md) (in the
[Rcpp](https://github.com/RcppCore/Rcpp) repo) for a brief discussion.
### Author
Dirk Eddelbuettel and Kenneth Rose
### License
GPL (>= 2)