https://github.com/edmundmiller/altair-upset
Create interactive UpSet plots using Altair
https://github.com/edmundmiller/altair-upset
altair plot sets upset upsetplot vega vega-lite visualization
Last synced: 16 days ago
JSON representation
Create interactive UpSet plots using Altair
- Host: GitHub
- URL: https://github.com/edmundmiller/altair-upset
- Owner: edmundmiller
- License: mit
- Created: 2025-01-19T00:24:33.000Z (3 months ago)
- Default Branch: main
- Last Pushed: 2025-03-29T17:25:34.000Z (29 days ago)
- Last Synced: 2025-04-05T18:17:41.718Z (22 days ago)
- Topics: altair, plot, sets, upset, upsetplot, vega, vega-lite, visualization
- Language: Python
- Homepage: https://altair-upset.readthedocs.io/
- Size: 3.22 MB
- Stars: 4
- Watchers: 1
- Forks: 1
- Open Issues: 2
-
Metadata Files:
- Readme: README.md
- Changelog: CHANGELOG.md
- License: LICENSE
- Citation: CITATION.cff
Awesome Lists containing this project
README
# Altair UpSet
[](https://badge.fury.io/py/altair-upset)
[](https://pypi.org/project/altair-upset/)
[](https://altair-upset.readthedocs.io/en/latest/?badge=latest)
[](https://opensource.org/licenses/MIT)
Create beautiful and interactive UpSet plots using Altair. UpSet plots are a powerful alternative to Venn diagrams for visualizing set intersections, especially when dealing with many sets.
## Features
- 🎨 Beautiful, interactive visualizations powered by Altair/Vega-Lite
- 🔄 Dynamic sorting by frequency or degree
- 🎯 Interactive highlighting and filtering
- 📱 Responsive design that works in Jupyter notebooks and web browsers
- 🎨 Customizable colors, sizes, and themes
- 🔍 Tooltips with detailed intersection information
- 🚀 Support for both Pandas and Polars DataFrames
## Installation
```bash
pip install altair-upset
```
Or with conda:
```bash
conda install -c conda-forge altair-upset
```
## Quick Start
```python
import altair_upset as au
import pandas as pd
# Or use Polars
import polars as pl
# Create sample data with Pandas
data = pd.DataFrame({
'set1': [1, 0, 1, 1],
'set2': [1, 1, 0, 1],
'set3': [0, 1, 1, 0]
})
# Create UpSet plot
chart = au.UpSetAltair(
data=data, # or data_pl.to_pandas()
sets=["set1", "set2", "set3"],
title="Sample UpSet Plot"
)
# Display the chart
chart.show()
```
## Example Gallery
The package includes a comprehensive gallery of examples demonstrating various features and use cases:
### Basic Examples
- **Basic UpSet Plot**: Simple visualization of streaming service subscriptions
- **Sorting and Filtering**: Different ways to organize and present set intersections
- **Custom Styling**: Examples of color schemes, themes, and layout customization
### Real-World Examples
- **Gene Set Analysis**: Visualizing intersections of biological pathways
- **Survey Response Analysis**: Understanding multiple-choice survey patterns
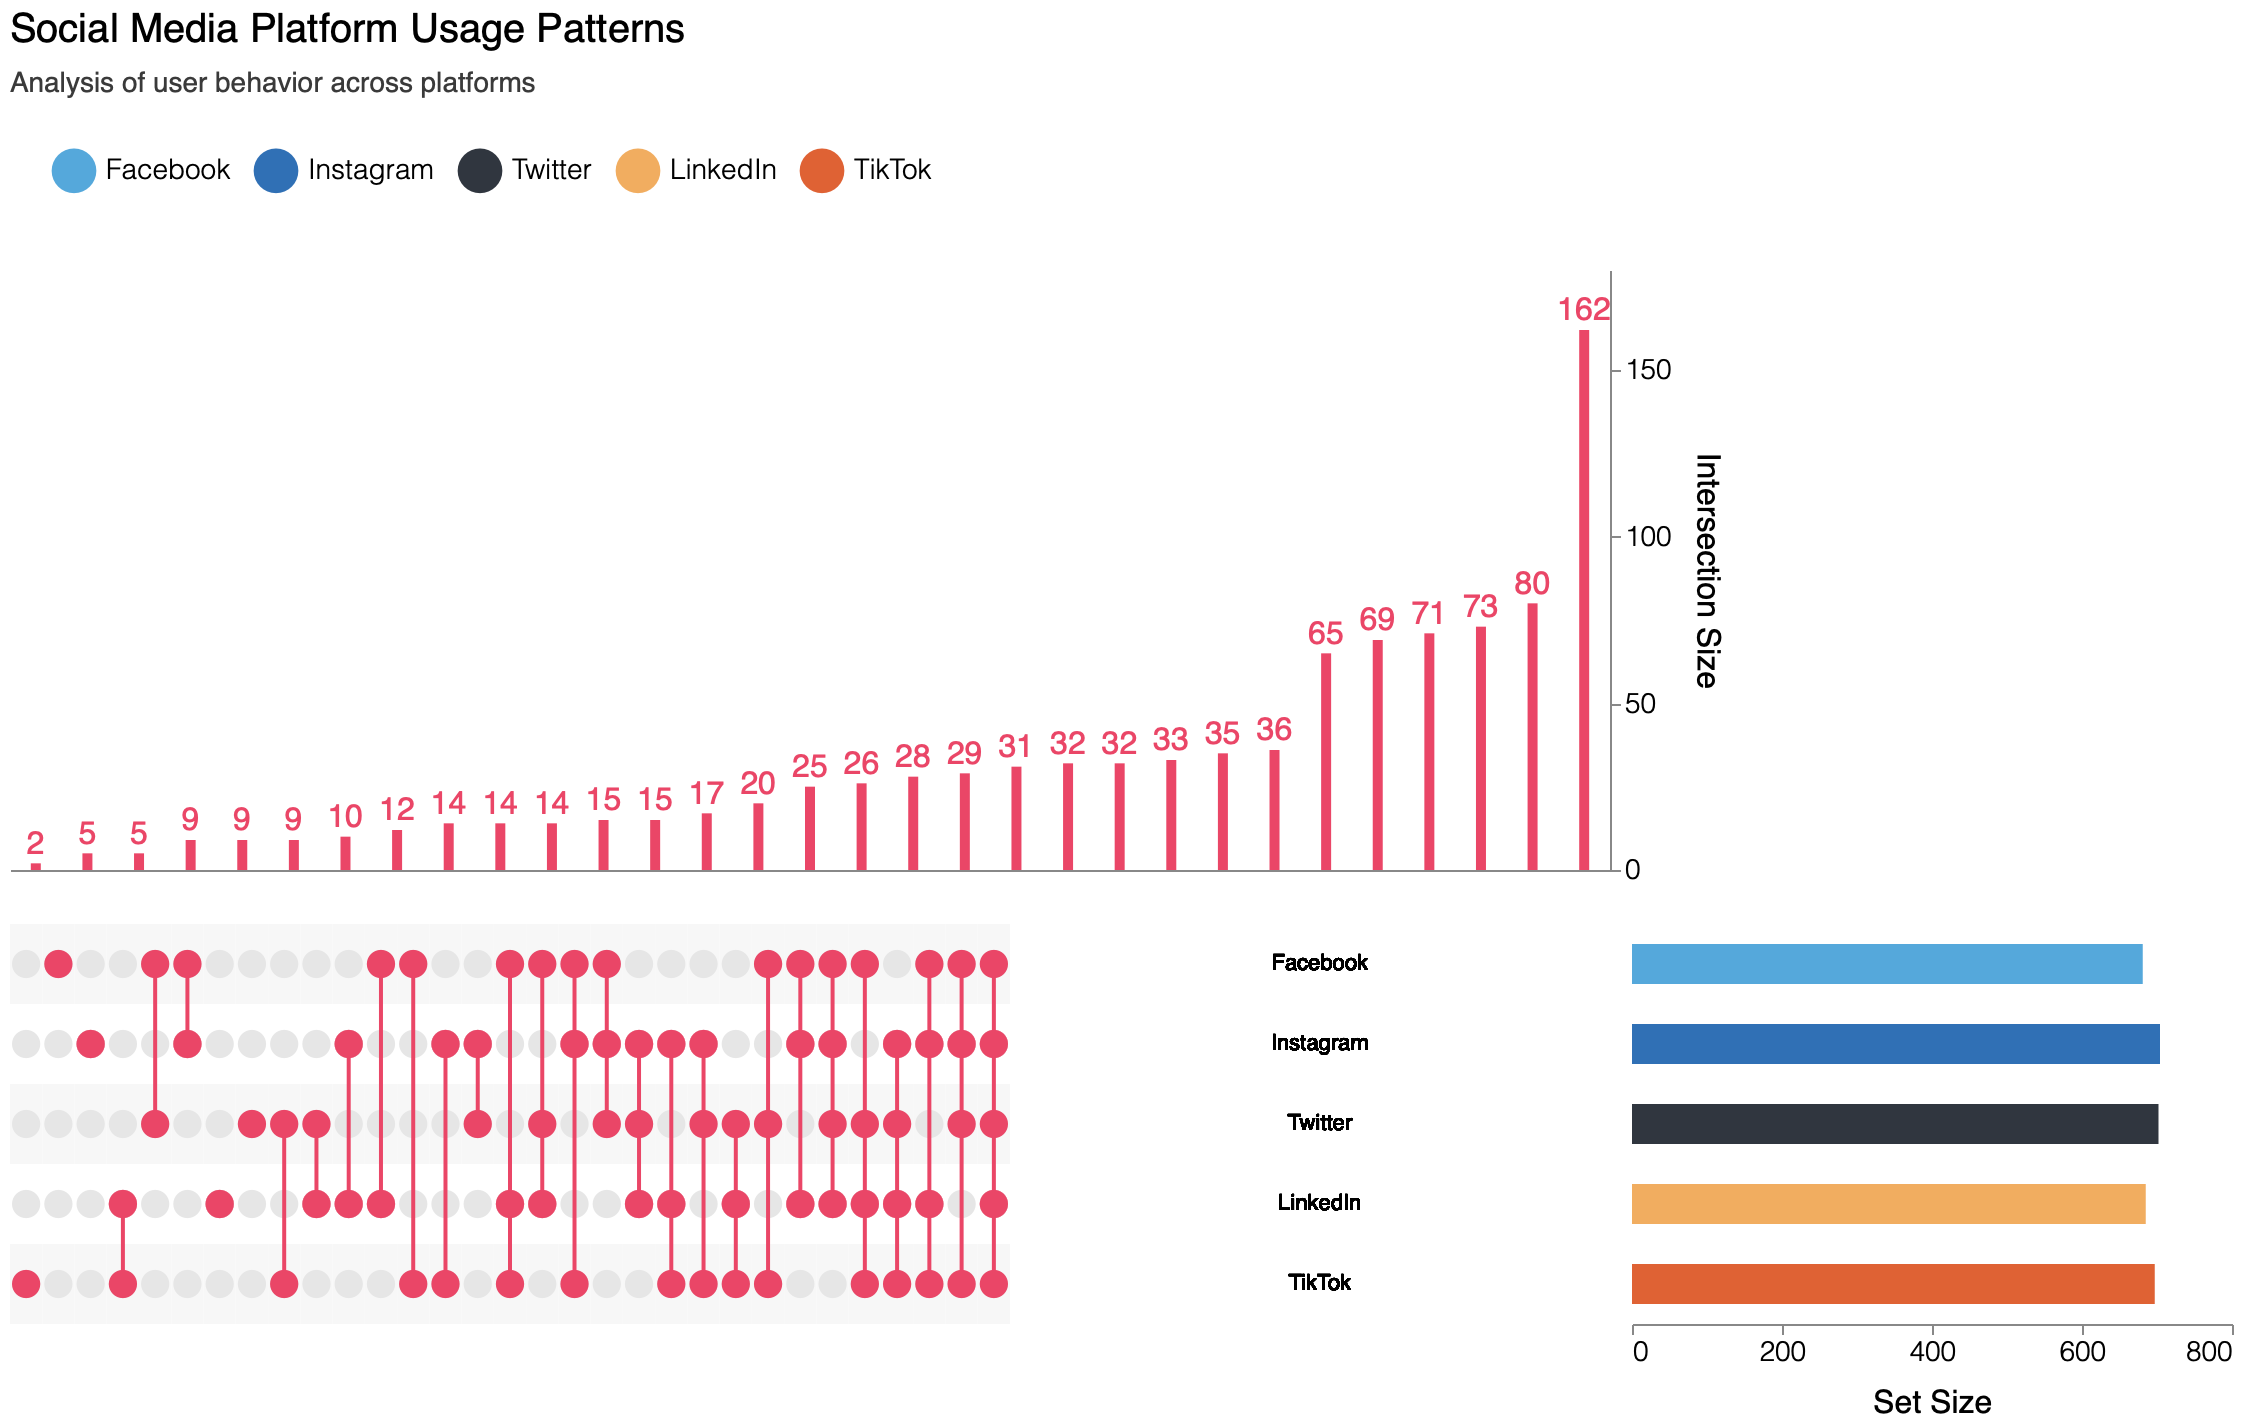
- **Social Media Usage**: Exploring platform usage overlaps with demographics
- **Movie Genre Analysis**: Investigating genre combinations in film datasets
### Advanced Features
- **Interactive Selection**: Enhanced interaction and filtering capabilities
- **Custom Tooltips**: Rich tooltips with additional information
- **Responsive Design**: Adapting to different display sizes
- **Theme Examples**: Using built-in and custom themes
To run the examples:
```bash
git clone https://github.com/edmundmiller/altair-upset.git
cd altair-upset
pip install -e ".[examples]"
python examples/basic_upset.py
```
Each example includes:
- Sample data generation or loading
- Plot creation with different features
- Analysis and statistics
- Detailed comments explaining each step
## Advanced Usage
### Sorting and Filtering
```python
# Sort by degree (number of sets in intersection)
chart = au.UpSetAltair(
data=data,
sets=["set1", "set2", "set3"],
sort_by="degree",
sort_order="descending"
)
```
### Customizing Appearance
```python
# Custom colors and sizes
chart = au.UpSetAltair(
data=data,
sets=["set1", "set2", "set3"],
color_range=["#1f77b4", "#ff7f0e", "#2ca02c"],
highlight_color="#d62728",
width=800,
height=500
)
```
### Using Abbreviations
```python
# Use abbreviations for long set names
chart = au.UpSetAltair(
data=data,
sets=["Very Long Set Name 1", "Very Long Set Name 2", "Very Long Set Name 3"],
abbre=["S1", "S2", "S3"]
)
```
## Development
1. Clone the repository:
```bash
git clone https://github.com/edmundmiller/altair-upset.git
cd altair-upset
```
2. Create a virtual environment and install dependencies:
```bash
python -m venv venv
source venv/bin/activate # On Windows: venv\Scripts\activate
pip install -e ".[dev,test,docs]"
```
3. Install pre-commit hooks:
```bash
pre-commit install
```
4. Run tests:
```bash
pytest
```
## Contributing
Contributions are welcome! Please feel free to submit a Pull Request. For major changes, please open an issue first to discuss what you would like to change.
1. Fork the repository
2. Create your feature branch (`git checkout -b feature/amazing-feature`)
3. Commit your changes (`git commit -m 'Add some amazing feature'`)
4. Push to the branch (`git push origin feature/amazing-feature`)
5. Open a Pull Request
## Credits
This package is based on the [UpSet: Visualization of Intersecting Sets](http://upset.app/) technique. If you use an UpSet figure in a publication, please cite the original paper:
Alexander Lex, Nils Gehlenborg, Hendrik Strobelt, Romain Vuillemot, Hanspeter Pfister,
_UpSet: Visualization of Intersecting Sets_,
IEEE Transactions on Visualization and Computer Graphics (InfoVis '14), vol. 20, no. 12, pp. 1983–1992, 2014.
doi: [10.1109/TVCG.2014.2346248](https://doi.org/10.1109/TVCG.2014.2346248)
The original function was from [hms-dbmi/upset-altair-notebook](https://github.com/hms-dbmi/upset-altair-notebook). The following updates from that are:
1. Turning it into a package
2. Snapshoting the functionality with Altair 4
3. Porting to Altair 5
4. Adding additional advanced features