https://github.com/eea/volto-plotlycharts
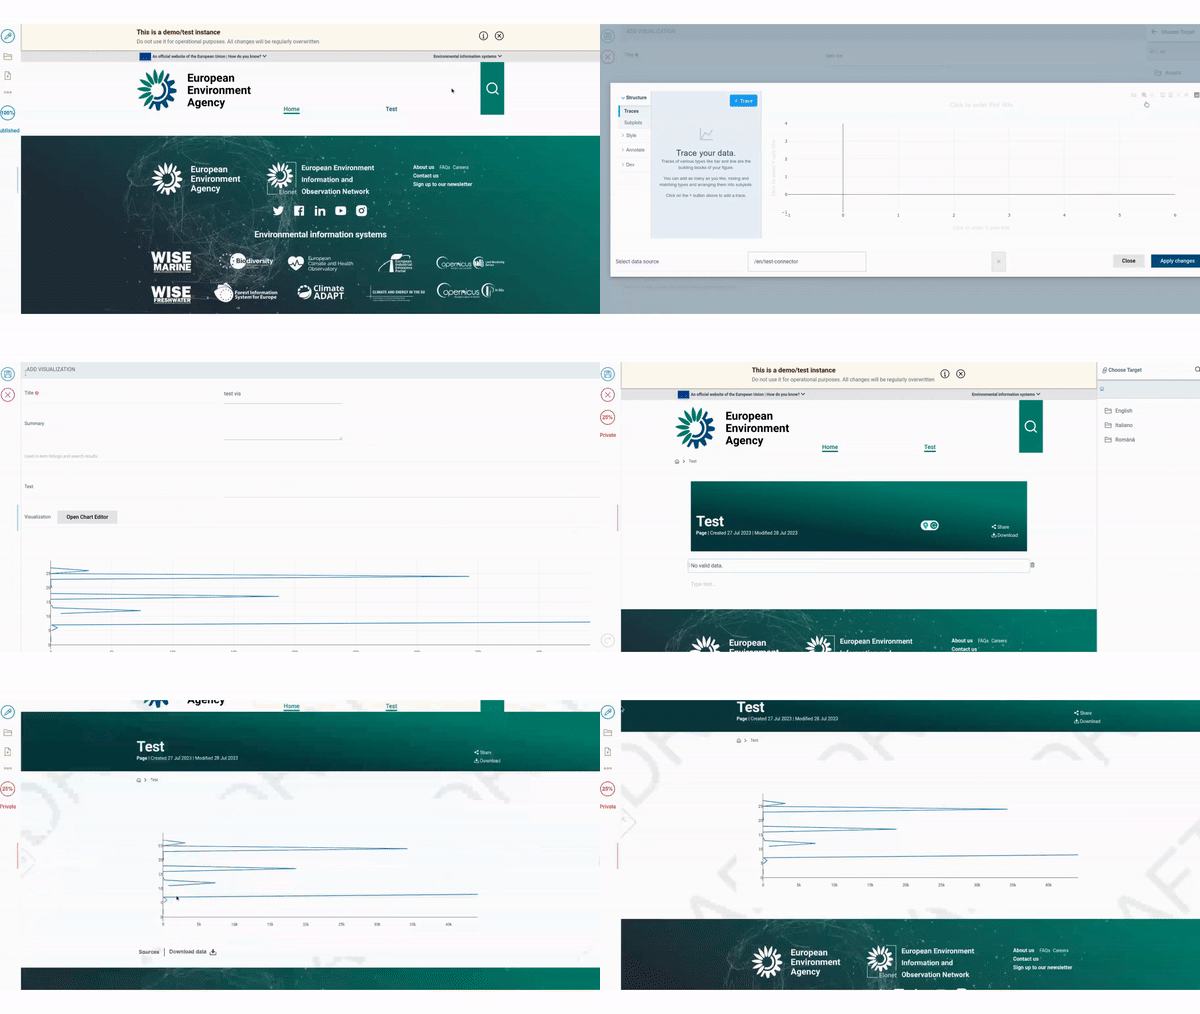
Plotly Charts and Plotly Chart Editor integration with Volto
https://github.com/eea/volto-plotlycharts
Last synced: about 2 months ago
JSON representation
Plotly Charts and Plotly Chart Editor integration with Volto
- Host: GitHub
- URL: https://github.com/eea/volto-plotlycharts
- Owner: eea
- License: mit
- Created: 2019-11-20T19:38:54.000Z (over 5 years ago)
- Default Branch: master
- Last Pushed: 2025-03-20T09:45:31.000Z (3 months ago)
- Last Synced: 2025-03-25T04:41:57.417Z (2 months ago)
- Language: JavaScript
- Size: 5.67 MB
- Stars: 2
- Watchers: 36
- Forks: 1
- Open Issues: 1
-
Metadata Files:
- Readme: README.md
- Changelog: CHANGELOG.md
- License: LICENSE.md
Awesome Lists containing this project
- awesome-volto - volto-plotlycharts - (EEA) Powerful chart editor based on Plotly (Addons)
README
# volto-plotlycharts
[](https://github.com/eea/volto-plotlycharts/releases)
[](https://ci.eionet.europa.eu/view/Github/job/volto-addons/job/volto-plotlycharts/job/master/display/redirect)
[](https://sonarqube.eea.europa.eu/dashboard?id=volto-plotlycharts-master)
[](https://sonarqube.eea.europa.eu/dashboard?id=volto-plotlycharts-master)
[](https://sonarqube.eea.europa.eu/dashboard?id=volto-plotlycharts-master)
[](https://sonarqube.eea.europa.eu/dashboard?id=volto-plotlycharts-master)
[](https://ci.eionet.europa.eu/view/Github/job/volto-addons/job/volto-plotlycharts/job/develop/display/redirect)
[](https://sonarqube.eea.europa.eu/dashboard?id=volto-plotlycharts-develop)
[](https://sonarqube.eea.europa.eu/dashboard?id=volto-plotlycharts-develop)
[](https://sonarqube.eea.europa.eu/dashboard?id=volto-plotlycharts-develop)
[](https://sonarqube.eea.europa.eu/dashboard?id=volto-plotlycharts-develop)
[Volto](https://github.com/plone/volto) add-on
## Features
Plotly Charts and Plotly Chart Editor integration with Volto
- Exports a PlotlyChart Widget, can be used in regular volto edit forms
- Registers a VisualizationView component for a content type named
'visualization'. `eea.restapi` has a behavior to implement such a content
type.

## Upgrade
- Version `^9.0.0` requires `^[email protected]`
- Version `^8.0.0` requires `^[email protected]`
- Version `^6.0.0` requires `^[email protected]`
## Getting started
### Try volto-plotlycharts with Docker
git clone https://github.com/eea/volto-plotlycharts.git
cd volto-plotlycharts
make
make start
Go to http://localhost:3000
### Add volto-plotlycharts to your Volto project
1. Make sure you have a [Plone backend](https://plone.org/download) up-and-running at http://localhost:8080/Plone
```Bash
docker compose up backend
```
1. Start Volto frontend
- If you already have a volto project, just update `package.json`:
```JSON
"addons": [
"@eeacms/volto-plotlycharts"
],
"dependencies": {
"@eeacms/volto-plotlycharts": "*"
}
```
- If not, create one:
```
npm install -g yo @plone/generator-volto
yo @plone/volto my-volto-project --canary --addon @eeacms/volto-plotlycharts
cd my-volto-project
```
1. Install new add-ons and restart Volto:
```
yarn
yarn start
```
1. Go to http://localhost:3000
1. Happy editing!
## Release
See [RELEASE.md](https://github.com/eea/volto-plotlycharts/blob/master/RELEASE.md).
## How to contribute
See [DEVELOP.md](https://github.com/eea/volto-plotlycharts/blob/master/DEVELOP.md).
## Copyright and license
The Initial Owner of the Original Code is European Environment Agency (EEA).
All Rights Reserved.
See [LICENSE.md](https://github.com/eea/volto-plotlycharts/blob/master/LICENSE.md) for details.
## Funding
[European Environment Agency (EU)](http://eea.europa.eu)