https://github.com/eirinimits/node-red-weather-dashboard
Implementation of an IoT platform for analysis of weather conditions using Node-RED
https://github.com/eirinimits/node-red-weather-dashboard
node-red openweathermap-node weather-conditions
Last synced: about 2 months ago
JSON representation
Implementation of an IoT platform for analysis of weather conditions using Node-RED
- Host: GitHub
- URL: https://github.com/eirinimits/node-red-weather-dashboard
- Owner: EiriniMits
- Created: 2019-08-08T09:23:34.000Z (about 6 years ago)
- Default Branch: master
- Last Pushed: 2019-08-16T10:13:53.000Z (about 6 years ago)
- Last Synced: 2024-10-27T22:20:13.113Z (12 months ago)
- Topics: node-red, openweathermap-node, weather-conditions
- Language: JavaScript
- Homepage:
- Size: 10.7 KB
- Stars: 0
- Watchers: 2
- Forks: 5
- Open Issues: 0
-
Metadata Files:
- Readme: README.md
Awesome Lists containing this project
README
# Node-RED-weather-dashboard
This project was created for academic purposes on the subject of 'Internet of Things' at the Aristotle University of Thessaloniki.
In the frame of this coursework we designed and implemented an IoT (Internet of Things) platform for analysis of weather conditions using the Node-RED platform. Node-RED allows us to wire together nodes to create flows, which carry out our programming task. We used the openweathermap node-red node that gets weather report from OpenWeatherMap. An API key is required to use this node.

### TASKS
#### Flow #1
* We visualize in real time, chart graphs (temperature, time), (humidity, time), (atmospheric pressure, time).
* Every 2 hours the system writes a short description of the current weather conditions (eg fog, rain, etc.) as they are taken from https://openweathermap.org.
#### Flow #2
* The code stores in a database(SQLite) from time to time (every 5 seconds) the temperature, humidity and atmospheric pressure data within the node-red editor using the node «sqlite».
* Using the nodes «function» and «sqlite» of node-red we developed a program in Javascript that receives temperature and humidity values and computes their average for the past 2 hours. These values are stored in a separate table within the SQLlite DB. Then the average values are being presented in the UI of node-red.
### INSTALLATION & RUNNING GUIDE
First of all, if you run the Node-red locally, you have to open a browser at the address http://127.0.0.1:1880/ , where the node-red MVC flow is. Otherwise, you could use the FRED sense tecnic cloud https://fred.sensetecnic.com/ .
There is a very large number of modules (Nodes) for Node-RED, available on the online library http://flows.nodered.org/. Some of them were used in the application and it is necessary to install them in Node-RED.
The mοdules used in the application and need to be installed are listed below:
* node-red-node-openweathermap
* node-red-dashboard
* node-red-node-sqlite
If you are running Node-RED on a Pi or desktop computer, nodes are managed through the Node-RED palette manager available in the Node-RED menu in the top right. Select Manage palette, then Install. From there, you can search for any module and click the Install button. If you are using the FRED sense tecnic cloud, the modules are being installed by using the Add or Remove Nodes navigation tab on FRED control panel left side of the Node-RED palette.
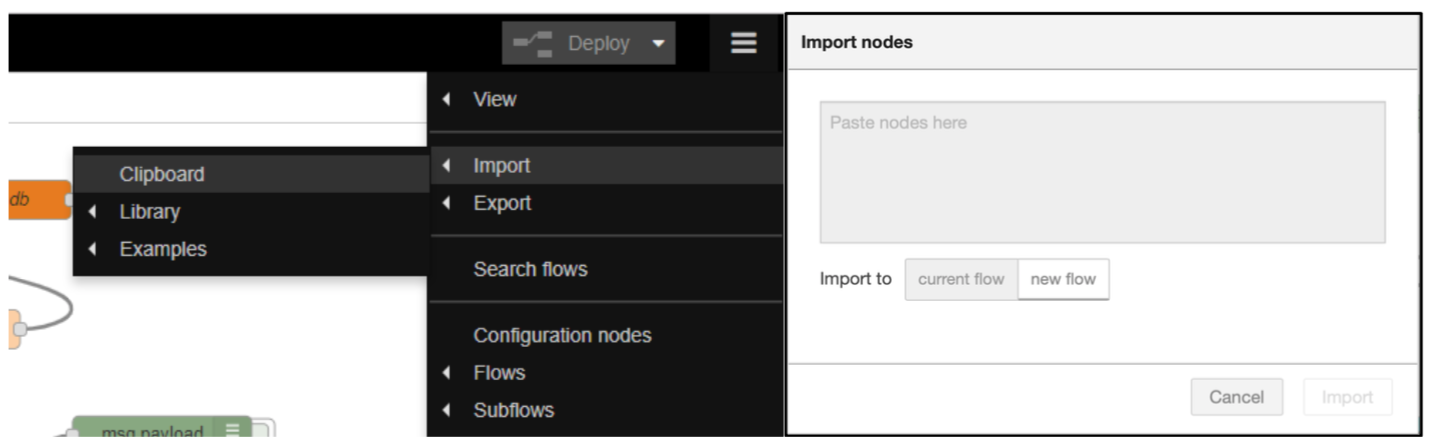
In order to run the application that was described in this report, you should enter the application’s code to the Node-red platform (Import > Clipboard) and you should then press the “new flow” button to import the connected nodes in a new flow.
Note that you will need to get an API key at OpenWeatherMap. OpenWeatherMap offers a great service that provides detailed weather information for worldwide locations. To obtain an API key go to https://openweathermap.org.
Double click on the openweathermap node and fill out the modal form with the API key you obtained, in order to get response from the server. Once you are done, click on “DONE” button.

In the sqlite node, you should define the path of the database that you want to create or use for inserting the weather data:

Once you enter the API key in the openweathermap node and the database’s path in the sqlite node, you should hit the deploy button and after that all the inject nodes in a top-down order. More specifically, you have to hit the inject nodes for the flow 2, following the below order:

In order to see the ui results of running the code you should open a browser tab at the address http://127.0.0.1:1880/ui/, where the dashboard is.