https://github.com/ekenes/elections
Time-series visualization of electoral swing/shift in the U.S presidential elections 2000-2020.
https://github.com/ekenes/elections
data-visualization elections party voting
Last synced: 10 months ago
JSON representation
Time-series visualization of electoral swing/shift in the U.S presidential elections 2000-2020.
- Host: GitHub
- URL: https://github.com/ekenes/elections
- Owner: ekenes
- License: apache-2.0
- Created: 2020-10-26T16:14:13.000Z (over 5 years ago)
- Default Branch: main
- Last Pushed: 2025-01-03T23:11:16.000Z (over 1 year ago)
- Last Synced: 2025-06-03T21:14:58.833Z (about 1 year ago)
- Topics: data-visualization, elections, party, voting
- Language: TypeScript
- Homepage: https://ekenes.github.io/elections
- Size: 1.34 MB
- Stars: 3
- Watchers: 1
- Forks: 2
- Open Issues: 1
-
Metadata Files:
- Readme: README.md
- License: LICENSE
Awesome Lists containing this project
README
# Electoral swing: U.S. presidential elections 2000-2024
[This map](https://ekenes.github.io/elections/) uses composite symbols to visualize voting behaviors in the 2016 U.S. presidential election.
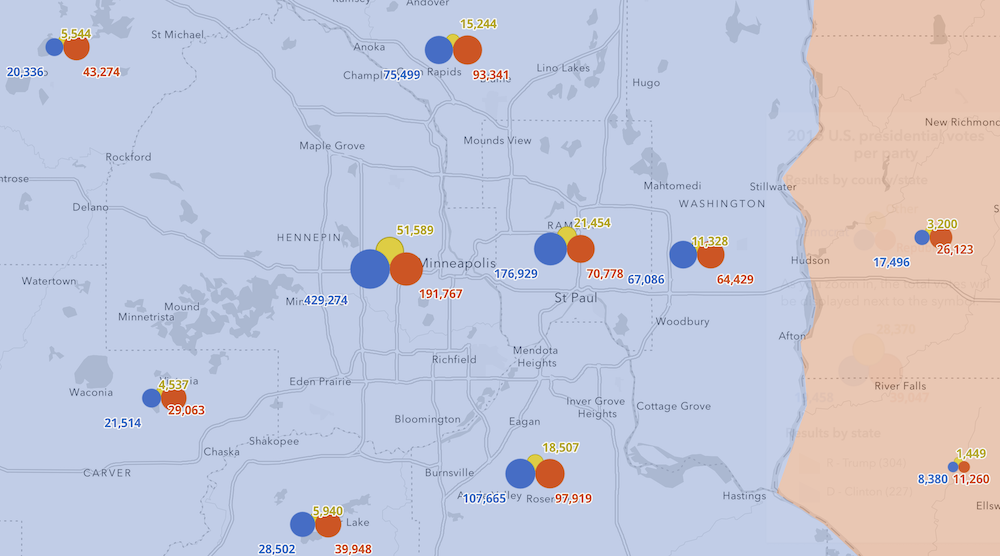
And how they changed from the 2012 election.
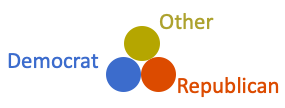
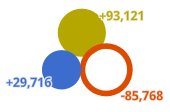
Each symbol consists of three circles offset from one another, each colored based on the party it represents.
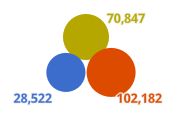
In the visualization showing final voting results, each circle is sized based on the number of votes cast per party.
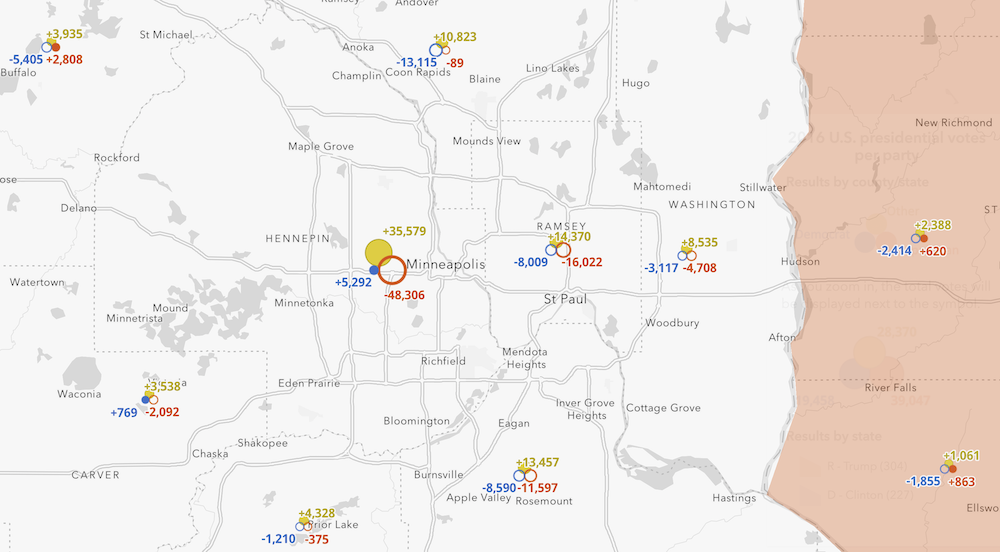
In the visualization showing the **change** in voting patterns between two elections, the size of the circle indicates
the absolute change in total votes.
A filled circle indicates the party gained votes, and a hollow circle indicates the party
lost votes. The following example shows the change in voting between the 2012 and 2016 presidential elections
in Utah County, Utah.
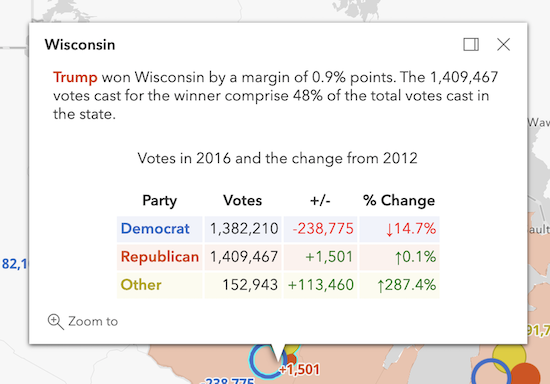
Click or tap a symbol to view more details about the shift in voting between the two elections.
## Configuration
You can use this app to visualize the results and voting changes between two other elections.
The most important requirement for replicating this visualization is to follow a similar schema
in the data. To transition smoothly to other datasets, the layer should have fields containing the
total votes for each party for two elections.
Once the data is in the right format, follow the steps below.
1. Fork this repo.
1. Open the [config](https://github.com/ekenes/elections/blob/master/app/config.ts) file to change the data sources
and other information, such as [years](https://github.com/ekenes/elections/blob/master/app/config.ts#L10) and [candidate](https://github.com/ekenes/elections/blob/master/app/config.ts#L15) names.
1. Update the references to [field names](https://github.com/ekenes/elections/blob/master/app/config.ts#L30) to match those of the new data sources.
1. You can configure the color and sizes of each symbol layer as well.
1. Some aspects of the map may not look as good, such as the label placements, so you may need
to update other parts of the app to improve the visual.
1. The legend contains custom images. You may choose to modify the text and replace the images.