https://github.com/elb4rto/logdoctor
Apache2 / Nginx / IIS logs analyzer: parse access logs and view dynamically generated statistics
https://github.com/elb4rto/logdoctor
analyzer apache2 apache2-logs cpp gui iis iis-logs logs logs-parser nginx nginx-logs qt statistics web-servers-logs
Last synced: about 1 year ago
JSON representation
Apache2 / Nginx / IIS logs analyzer: parse access logs and view dynamically generated statistics
- Host: GitHub
- URL: https://github.com/elb4rto/logdoctor
- Owner: elB4RTO
- License: agpl-3.0
- Created: 2022-06-25T19:17:10.000Z (almost 4 years ago)
- Default Branch: main
- Last Pushed: 2024-11-27T20:57:48.000Z (over 1 year ago)
- Last Synced: 2025-04-02T07:11:32.278Z (about 1 year ago)
- Topics: analyzer, apache2, apache2-logs, cpp, gui, iis, iis-logs, logs, logs-parser, nginx, nginx-logs, qt, statistics, web-servers-logs
- Language: C++
- Homepage:
- Size: 6.52 MB
- Stars: 4
- Watchers: 1
- Forks: 5
- Open Issues: 4
-
Metadata Files:
- Readme: README.md
- Changelog: CHANGELOG.md
- Contributing: CONTRIBUTING.md
- License: LICENSE
- Code of conduct: CODE_OF_CONDUCT.md
Awesome Lists containing this project
README
LogDoctor
Parse Apache2 / Nginx / IIS logs and view dynamically generated statistics


## Table of contents
- [Overview](#overview)
- [Installation and usage](#installation-and-usage)
- [Requirements / dependencies](#requirements--dependencies)
- [Usage without installation](#usage-without-installation)
- [Usage with installation](#usage-with-installation)
- [How to compile](#how-to-compile)
- [Updates](#updates)
- [Version check](#version-check)
- [How to update](#how-to-update)
- [Before to start](#before-to-start)
- [Logs data](#logs-data)
- [Storage](#storage)
- [Examined fields](#examined-fields)
- [Logs options](#logs-options)
- [Usage control](#usage-control)
- [Logs path](#logs-path)
- [Logs format](#logs-format)
- [Apache2](#apache2)
- [Nginx](#nginx)
- [IIS](#iis)
- [Blacklist](#blacklist)
- [Warnlist](#warnlist)
- [Statistics](#statistics)
- [Warnings](#warnings)
- [Counts](#counts)
- [Speed](#speed)
- [Time of day](#time-of-day)
- [Relational](#relational)
- [Extra features](#extra-features)
- [Log files viewer](#log-files-viewer)
- [Block note](#block-note)
- [Games](#games)
- [Final considerations](#final-considerations)
- [Backups](#backups)
- [Estimated working speed](#estimated-working-speed)
- [Languages](#languages)
- [Contributions](#contributions)
- [Translations](#translations)
## Overview
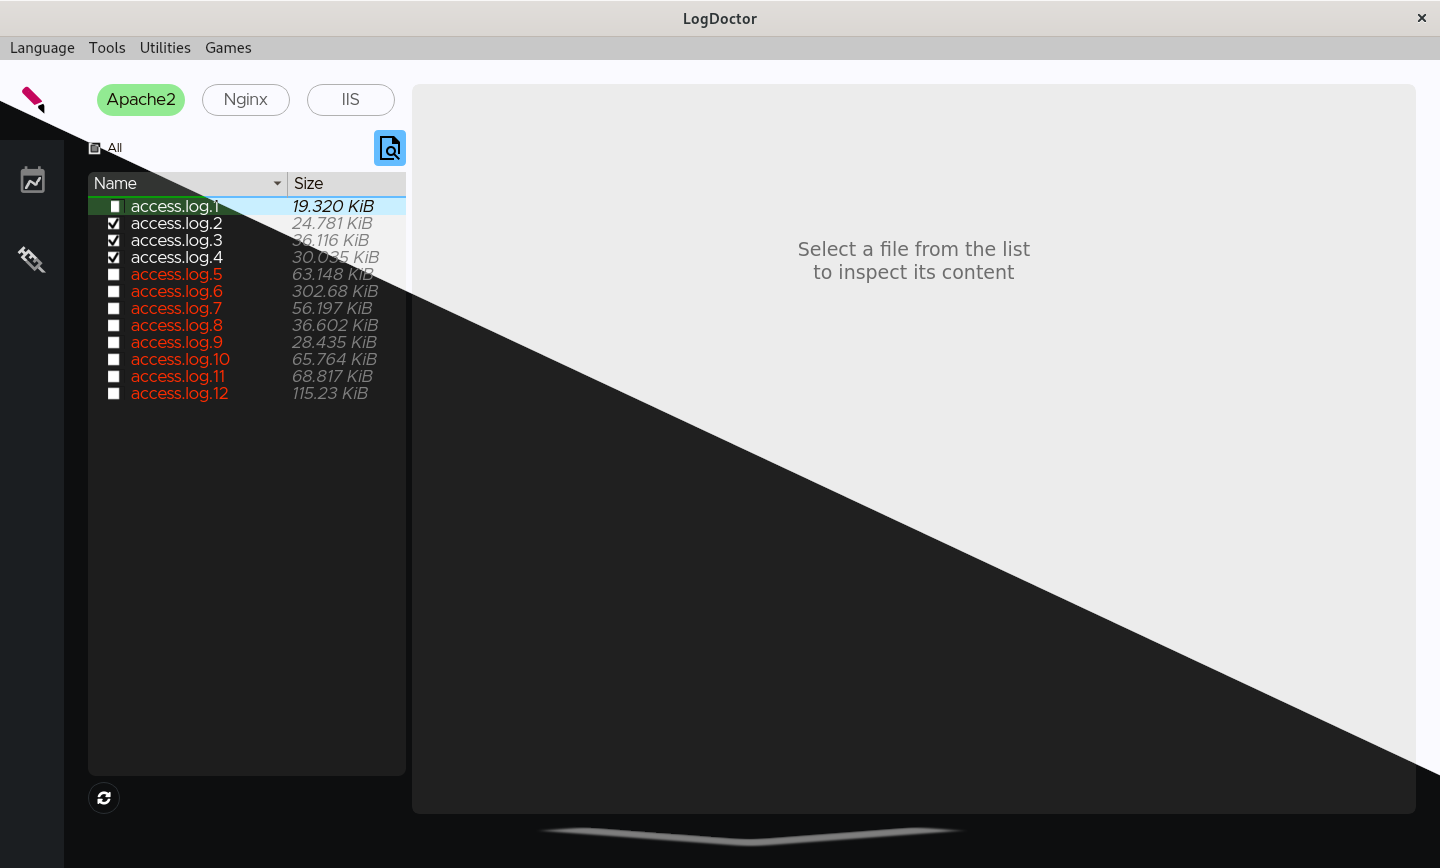
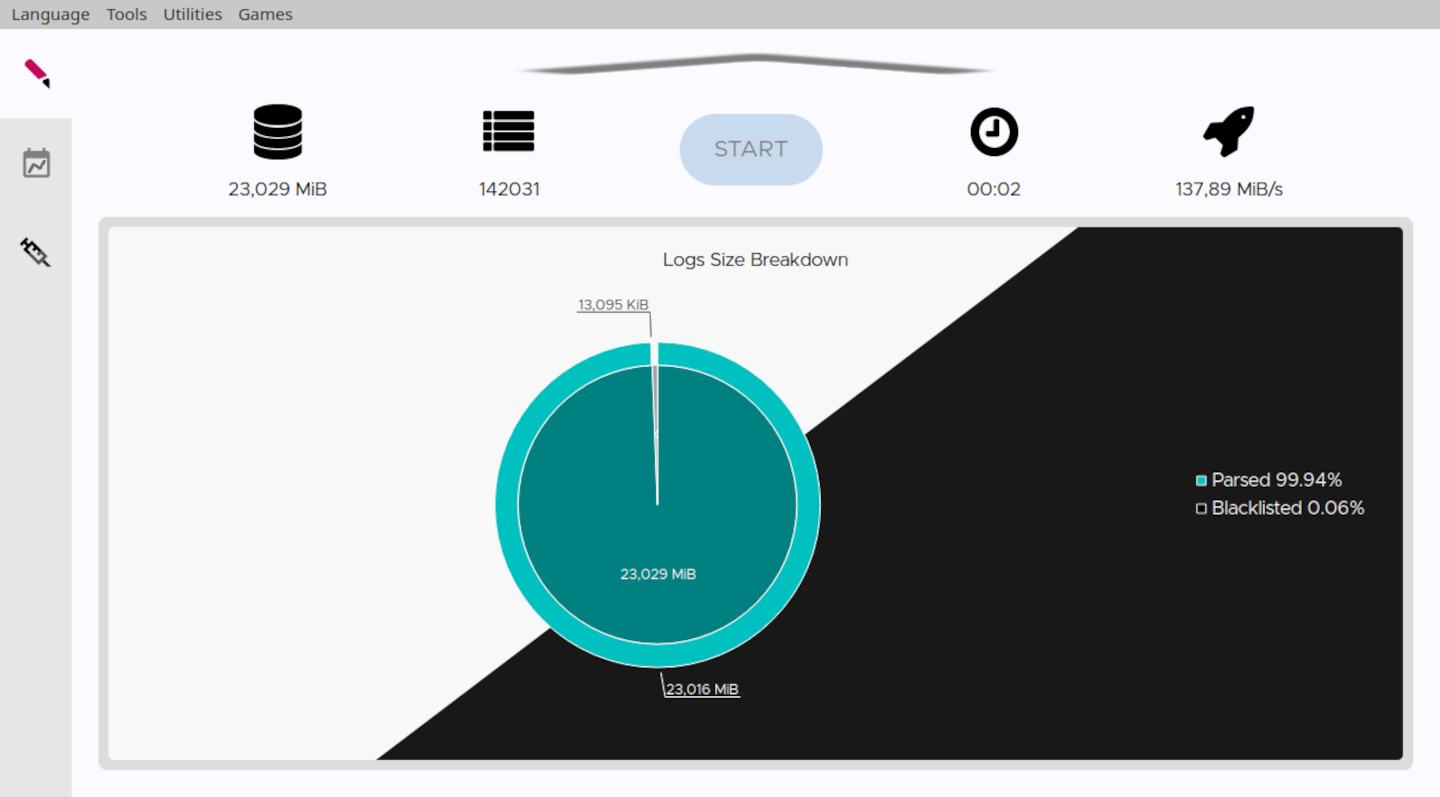
LogDoctor is a web servers' access logs parser which allows to view dynamic satistics of the collected data.
Supported web servers are **Apache2**, **Nginx** and **IIS**.
LogDoctor is a hard fork of [Craplog](https://github.com/elB4RTO/CRAPLOG).
## Installation and usage
### Requirements / Dependencies
- **From binary**:
- C++ 20
- Qt6 *(Framework 6.6+, Linguist, Widgets, Charts, Sql, Network)*
- **From source**:
- *all the above*
- CMake
- gcc / clang / msvc
- **As Docker**:
- Docker
### Usage without installation
- Download a pre-compiled [Release](https://github.com/elB4RTO/LogDoctor/releases)
*or*
Follow the step-by-step guide in [HOW_TO_COMPILE.md](https://github.com/elB4RTO/LogDoctor/blob/main/HOW_TO_COMPILE.md)
- Run the executable
### Usage with installation
See [HOW_TO_INSTALL.md](https://github.com/elB4RTO/LogDoctor/blob/main/HOW_TO_INSTALL.md)
### How to compile
See [HOW_TO_COMPILE.md](https://github.com/elB4RTO/LogDoctor/blob/main/HOW_TO_COMPILE.md)
## Updates
### Version check
To check for updates, open the menu `Utilities`→`Version check`.
### How to update
See [HOW_TO_UPDATE.md](https://github.com/elB4RTO/LogDoctor/blob/main/HOW_TO_UPDATE.md)
## Before to start
When you run LogDoctor for the first time, you will most likely see an empty list of log files.
Head to the **configurations** section and give a look at least at the [logs format](#logs-format) settings. Only files containings logs that match the given format will be shown in the list.
## Logs data
Archived (**gzipped**) log files can be used as well as normal files.
### Storage
Parsed data will be stored in an [SQLite](https://www.sqlite.org/about.html) database, which makes it easy to transport/view/edit it as you please.
If LogDoctor's funcionalities aren't enough for your needs, you can always use a *DB manager* or the SQLite *API* to make your own queries and retrieve the data you need.
### Examined fields
Not all the available log fields (expecially for *Apache2* and *Nginx*) are taken into consideration.
The considered fields are:
- **Date** and **Time**
- Request stuff: **Protocol**, **Method**, **URI** and **Query**
- Server stuff: **Bytes received**, **Bytes sent** and **Time taken**
- Client stuff: **User-agent**, **IP address**, **Cookie** and **Referrer site**
Further informations can be found in the [wiki](https://github.com/elB4RTO/LogDoctor/wiki/Examined-fields) or while running LogDoctor.
### Logs options
Various options can be configured about log files.
#### Usage control
When you parse a file, it will be hashed using the **SHA256** algorithm and the hash will be stored in another database, to keep track of which files you've already used and help you not parsing them twice.
##### Note
The *SHA256* algorithm produces an irreversible hash, which means that no information about the file can be retrieved from the hash.
LogDoctor will **never** grab and/or use any information about you or the usage you make of it.
#### Logs path
A different logs path can be used for any of the three supported *Web Servers*.
It can be the default system folder or any folder you decide to use, just set it in the options.
#### Logs format
Before to start parsing logs, you must set-up the *loga format*.
Head to the **configurations** section, under `Logs` select the **Web Server** you want to configure and tap `Format`.
Once inside the **Format** section, you can insert the *log format string* you're using. Don't forget to use the `Generete preview` button to generate a *log line sample* and **check the correctness** of the format!
For reliability reasons, LogDoctor **does not** support the usage of the **Carriage Return** inside the log format string.
##### Apache2
The log format string must be specified. Any format is supported, if valid.
To retrieve your format string:
- open the configuration file `/etc/apache2/apache2.conf`
- *usually*, the line you're looking for is the one starting with `LogFormat` and ending with `combined`. It should be somewhere near to the end of the file.
- you must not paste the whole line, just the part holding the *format string*.
Example:
- this is the whole line:
```
LogFormat "%h %l %u %t \"%r\" %>s %b \"%{Referer}i\" \"%{User-agent}i\"" combined
```
- this is the *format string*:
```
%h %l %u %t \"%r\" %>s %b \"%{Referer}i\" \"%{User-agent}i\"
```
please notice that you have to remove the enclosing quotes/apostrophes as well
More informations can be found in the [wiki](https://github.com/elB4RTO/LogDoctor/wiki/Apache2) or while setting the format.
##### Nginx
The log format string must be specified. Any format is supported, if valid.
To retrieve your format string:
- open the configuration file `/usr/local/etc/nginx/nginx.conf`
- *usually*, the line you're looking for is the one starting with `log_format main`. It should be somwehere in the middle of the file
- one **important** thing: don't paste the indentations and new lines! The default line is usualy declared in consecutive lines, and indented. You must reduce it to a one consecutive string (by also removing the *apostrophes* in the middle of it). The best way is to do this job inside the configuration file, then save and restart Nginx to see if any error is thrown.
Example:
- this is the whole line:
```
log_format main '$remote_addr - $remote_user [$time_local] '
'"$request" $status $body_bytes_sent '
'"$http_referer" "$http_user_agent" "$gzip_ratio"';
```
- this is the resulting *format string*:
```
$remote_addr - $remote_user [$time_local] "$request" $status $bytes_sent "$http_referer" "$http_user_agent" "$gzip_ratio"
```
please notice that you have to remove the enclosing apostrophes/quotes as well
More informations can be found in the [wiki](https://github.com/elB4RTO/LogDoctor/wiki/Nginx) or while setting the format.
##### IIS
Supported log formats are: **W3C**, **NCSA** and **IIS**.
The *NCSA* and *IIS* modules doesn't allow any modification from the user, so nothing more have to be specified.
The *W3C* module instead allows the user to decide which fields to log, and thus you must declare the *log format string* you're using.
To retrieve your format string (for the *W3C* module only):
- open any of the log files which have been generated by this module
- the line you're looking for is the one starting with `#Fields:`, usually at the beginning of the file.
Example:
- this is the whole line:
```
#Fields: date time s-ip cs-method cs-uri-stem cs-uri-query s-port cs-username c-ip cs(User-Agent) cs(Referer) sc-status sc-substatus sc-win32-status time-taken
```
- this is the *format string*:
```
date time s-ip cs-method cs-uri-stem cs-uri-query s-port cs-username c-ip cs(User-Agent) cs(Referer) sc-status sc-substatus sc-win32-status time-taken
```
More informations can be found in the [wiki](https://github.com/elB4RTO/LogDoctor/wiki/IIS) or while setting the format.
#### Blacklist
You can add elements to the **blacklist** to avoid storing the lines containing those elements.
Each web server has its own list.
#### Warnlist
As for the *blacklist*, you can add elements to the **warnlist**.
*Warnlists* will mark with a **warning** the lines triggering them. Warnings can be viewed in the relative [statistics](#warnings) section.
Each web server has its own lists.
## Statistics
Most of the *statistics sections* allows you to set filters to the log fields, to skim data by only including lines matching those parameters.
### Warnings
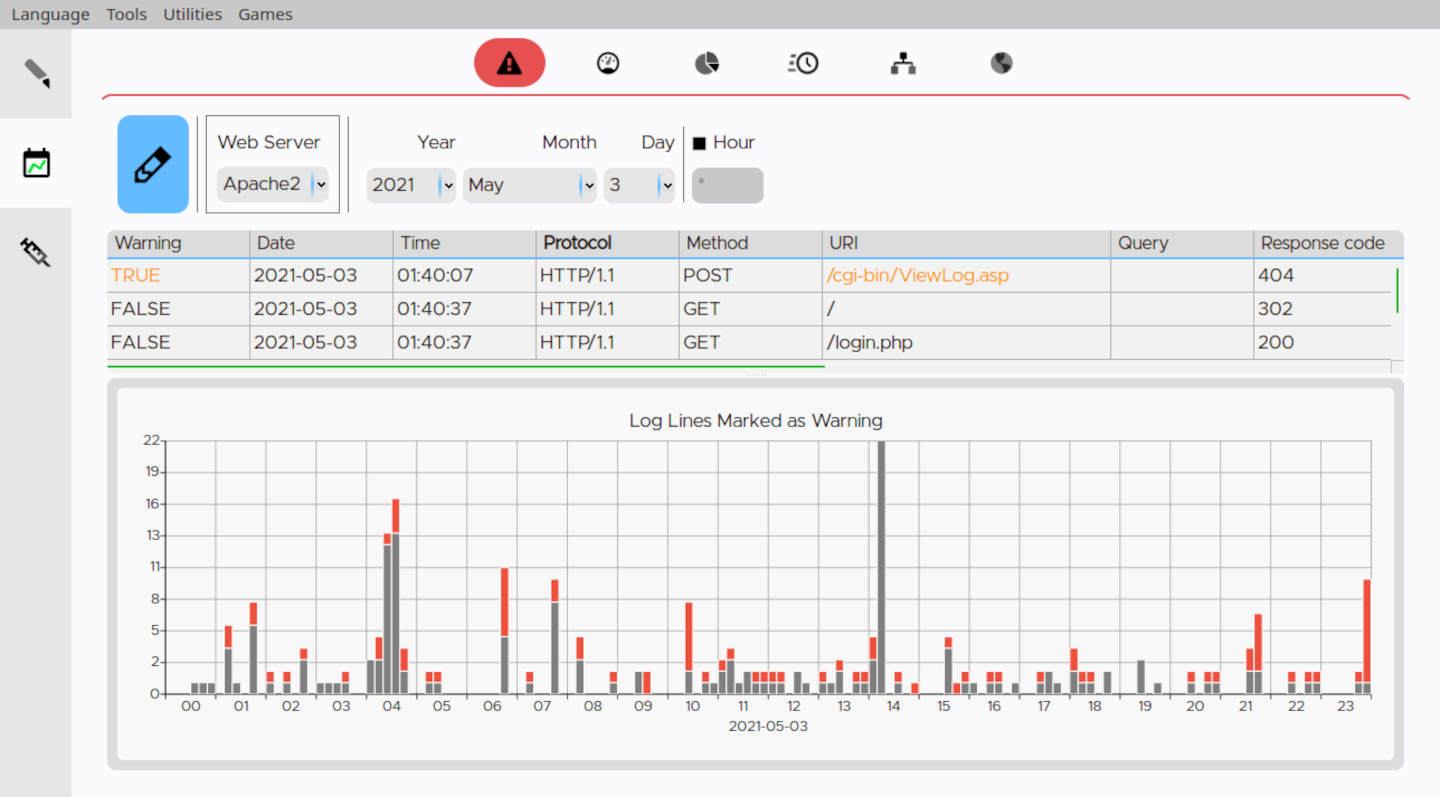
In the *warning* section you can view the lines which are triggering a warning.
Warnings are generated dinamically depending on your [warnlists](#warnlist): changing the elements in the *warnlists* will produce different warnings.
### Speed
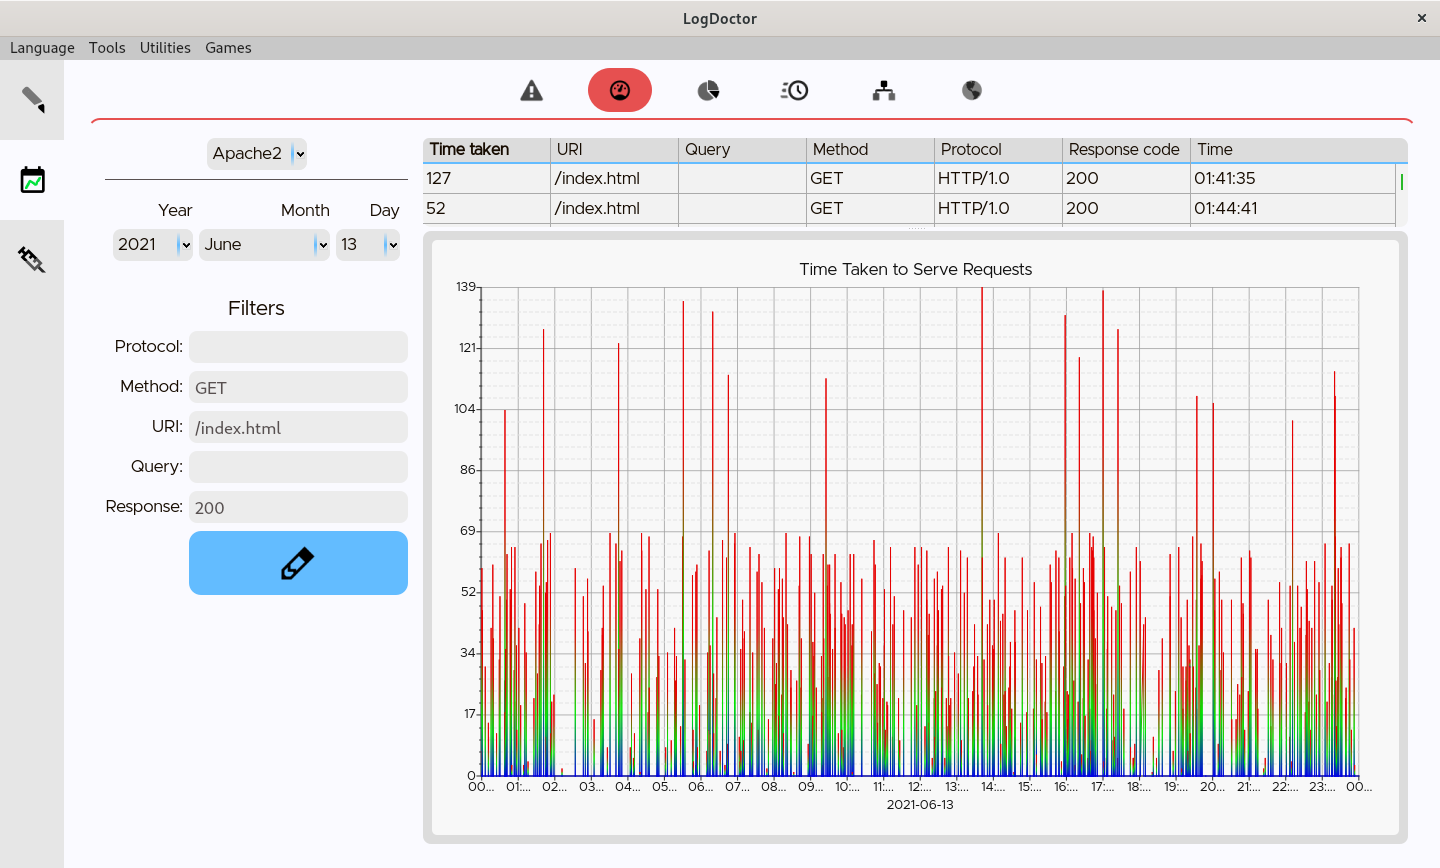
In the *speed* section you can view how fast has been your server at serving contents (if you logged the *time taken*, of course).
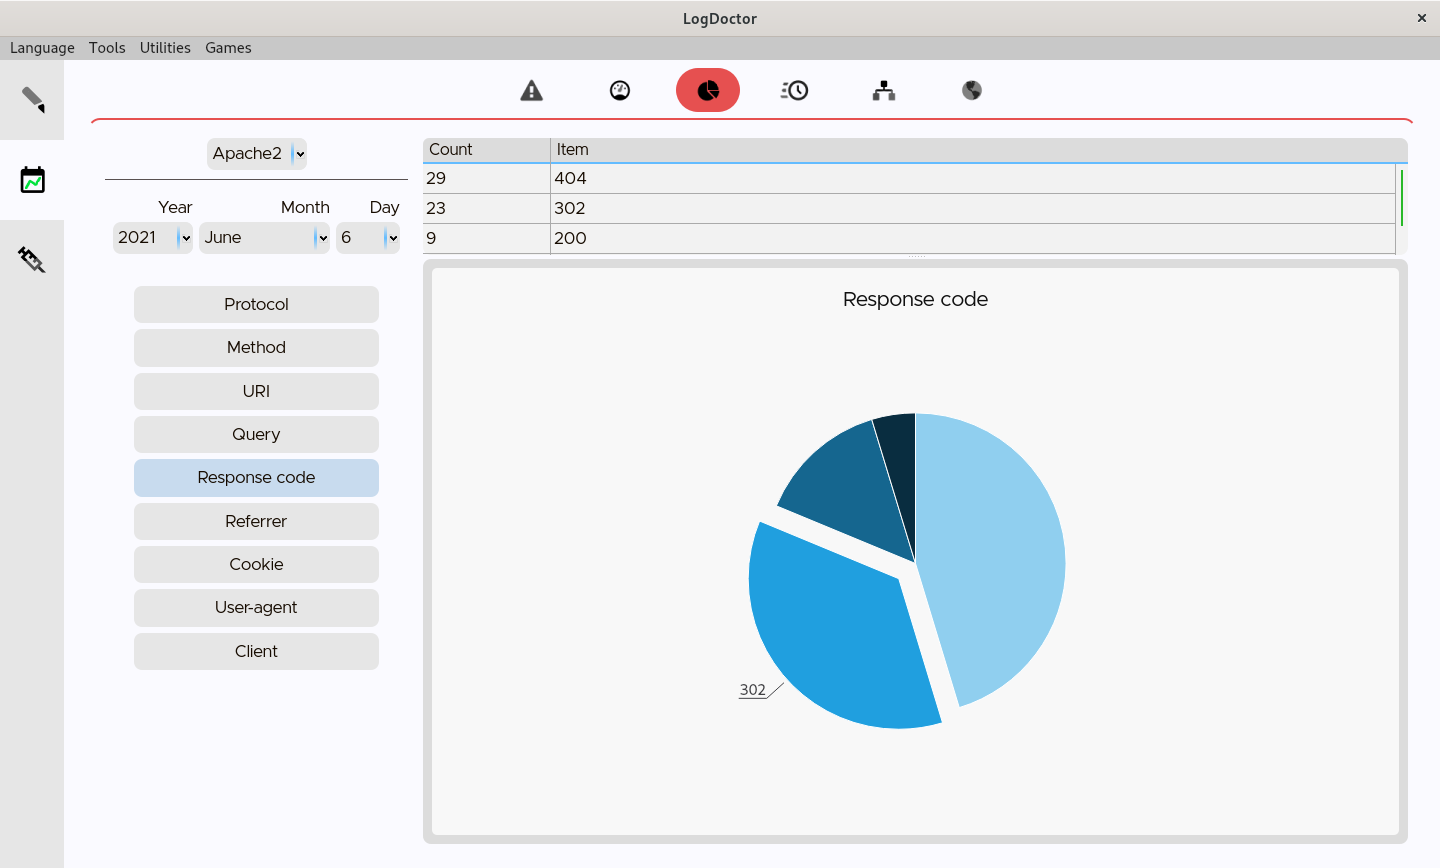
### Counts
The *count* section is very simple. It just shows the recurrence of the elements for a specific field.
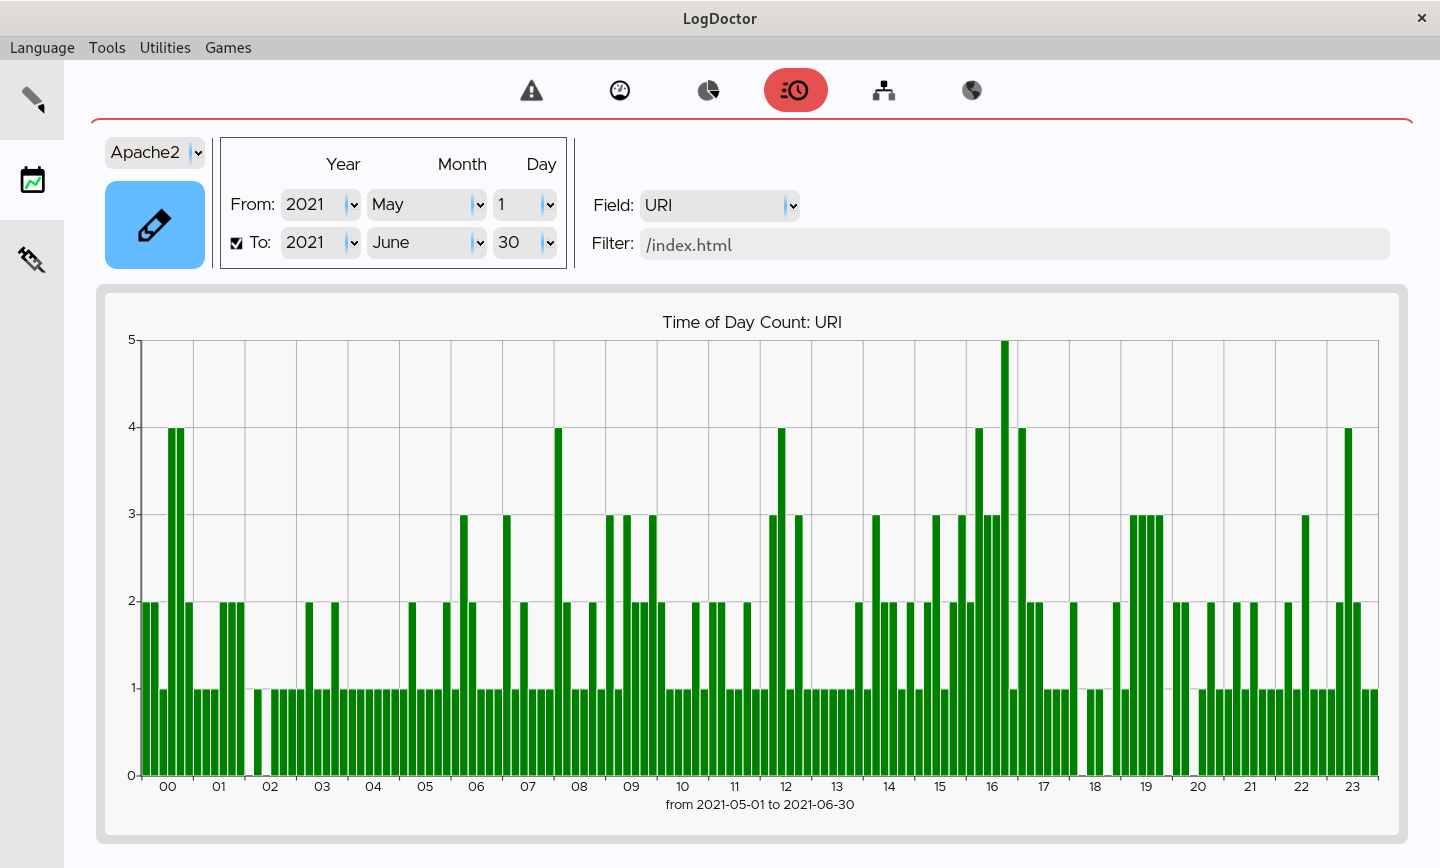
### Time of day
In the *time of day* section you can see the traffic, in terms of number of requests logged.
When viewing a period of time, the mean value (of all the logged days in that period) is shown.
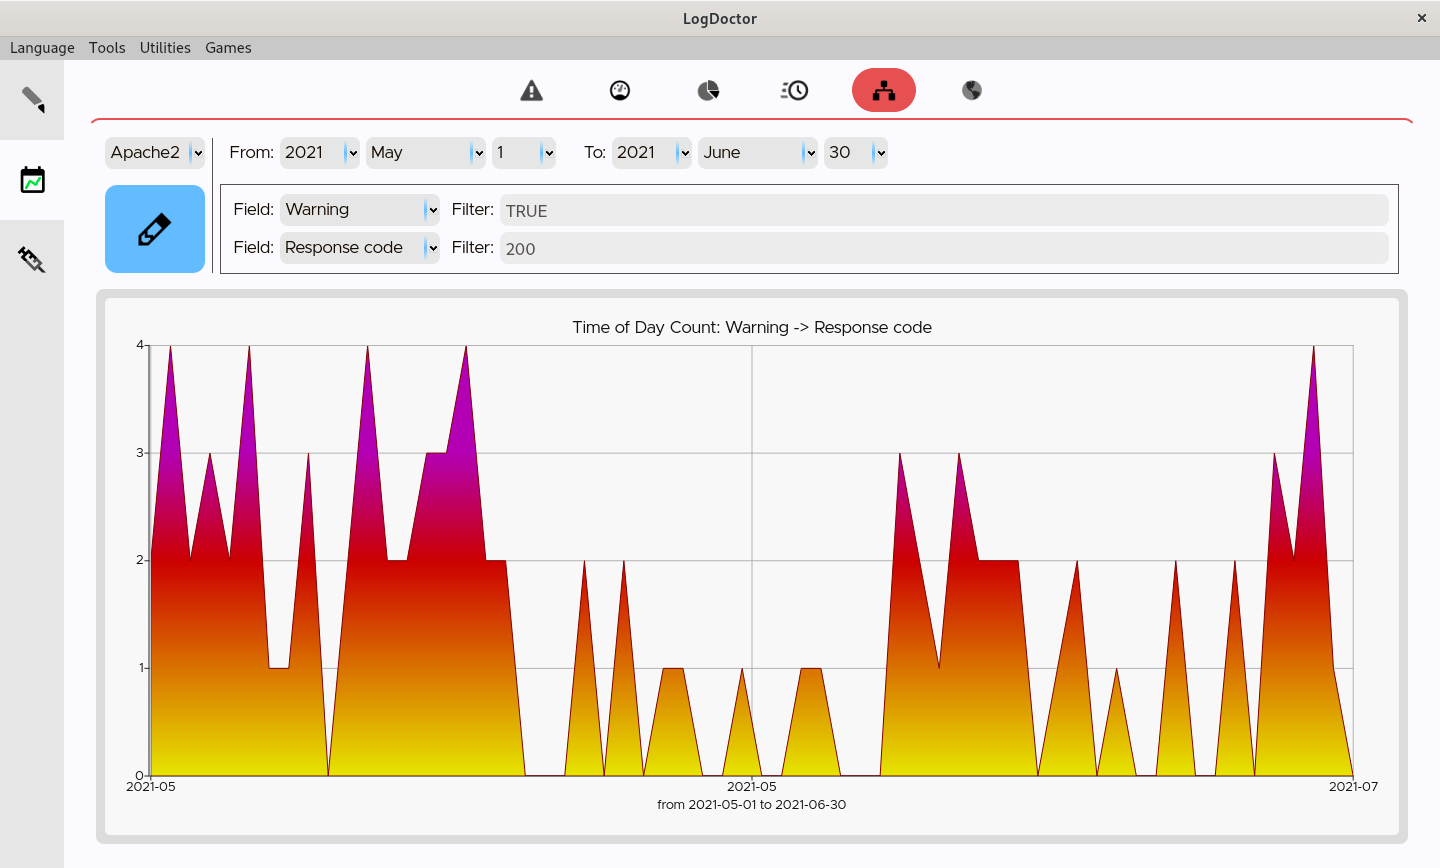
### Relational
In the *relational* section you can view how many times a specific field brought to another.
This section is more suited for long periods of time.
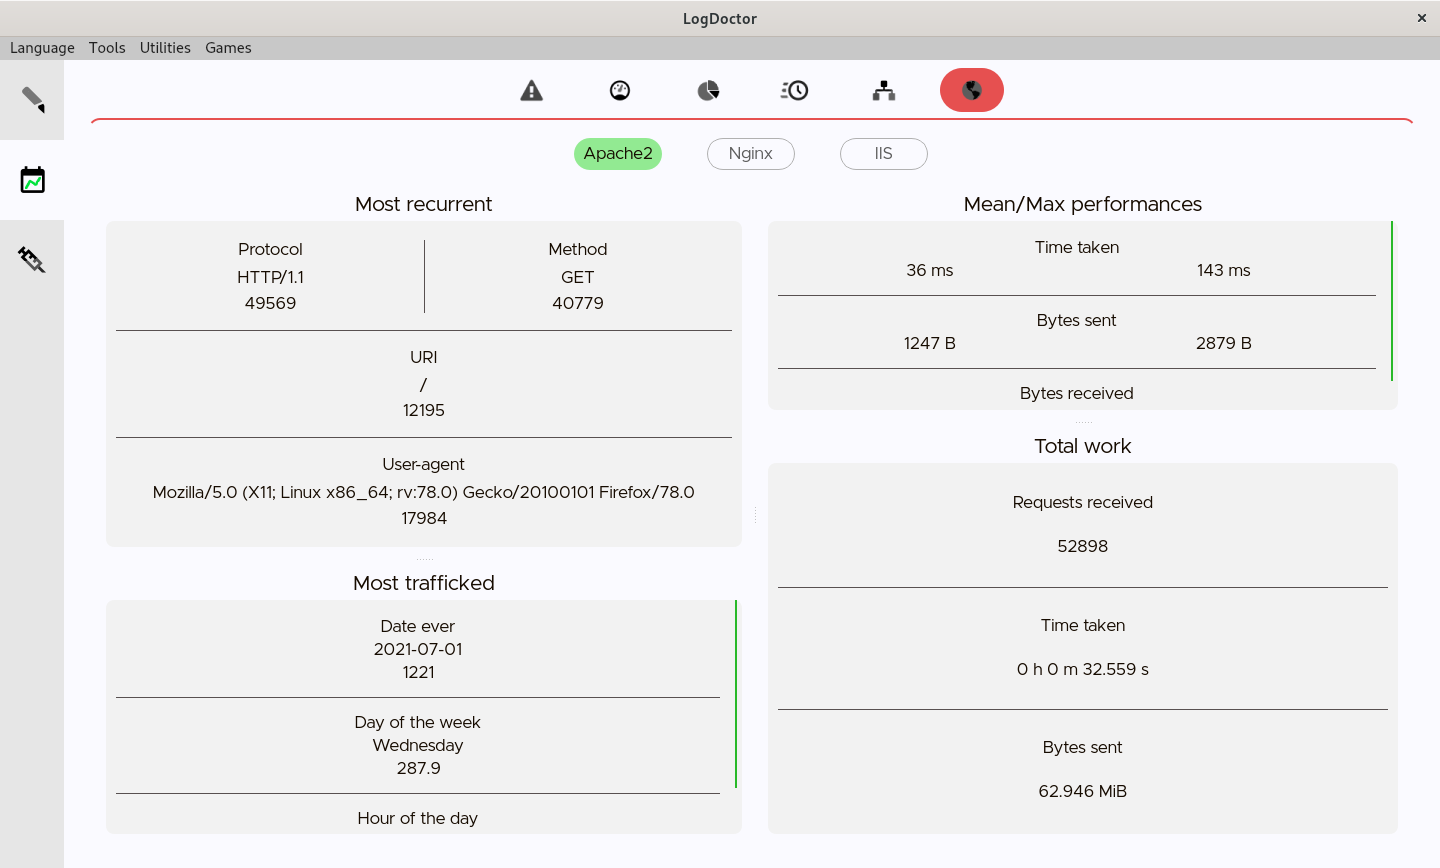
### Globals
In the *globals* section you can have an overview of your logs history.
## Extra features
### Log files viewer
Use the built-in logs viewer to inspect the content of your log files.
Color schemes will be applied using the currently set log format.
### Block-note
A block-note utility is available at `Tools`→`BlockNote` which can be used to temporary write text, notes, etc.
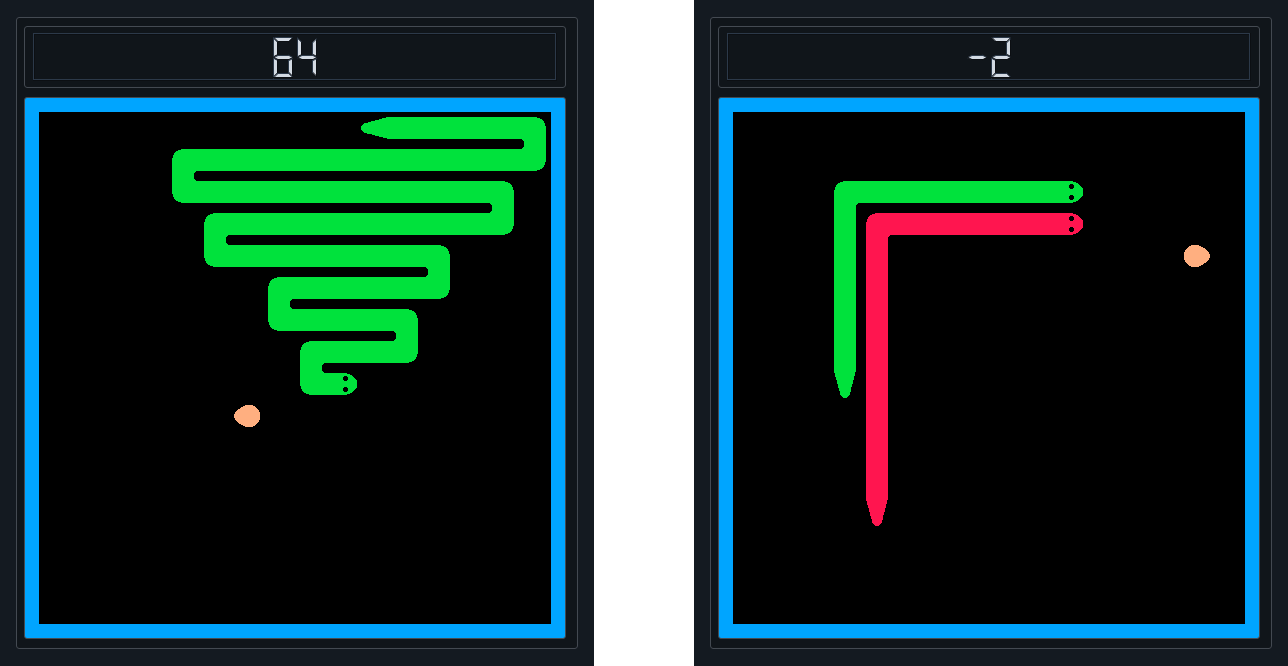
### Games
Simple mini-games to kill the time.
#### CrissCross

#### Snake
## Final considerations
### Backups
LogDoctor can automatically do a backup of your **logs database** file, so you can recover your data in case something goes wrong.
Move inside LogDoctor's folder (if you don't know/remember the path, open the `Utilities`→`Infos`>`Paths` menu to view it) and open the folder named "**backups**'.
Here you will find the backups with an increasing index, where '.1' represents the newest.
A new backup is made every time you quit LogDoctor after doing a job which affected the database in any way.
#### Note
Only the *logs-data database* will be backed-up, the *hashes database* **won't**.
This is because it is unlikely (supposedly impossible) that a hash equals another, therefore they're supposed to be useful for a short period of time (that is, until you or your web server delete the original log files).
### Estimated working speed
10~200 MB/s
Take this estimation with a grain of salt, it may be even higher or lower depending on a variety of factors, like: the build type, your hardware, the complexity of the logs, the complexity of the blacklist, the workload of your system during the execution...
## Languages
LogDoctor is available in multiple languages, most of which are automatically translated. *Wanna [contribute](https://github.com/elB4RTO/LogDoctor/blob/main/TRANSLATING.md) to improve them?*)
## Contributions
LogDoctor is under constant development.
If you have suggestions about how to improve it, please open an [issue](https://github.com/elB4RTO/LogDoctor/issues).
If you want to contribute to the code, please read the [Contribution Guidelines](https://github.com/elB4RTO/LogDoctor/blob/main/CONTRIBUTING.md).
If you want to contribute to the translation, please read the [Translation Guidelines](https://github.com/elB4RTO/LogDoctor/blob/main/TRANSLATING.md).