Ecosyste.ms: Awesome
An open API service indexing awesome lists of open source software.
https://github.com/ennerf/HdrHistogramVisualizer
Visualizer for HdrHistogram and JHiccup logs
https://github.com/ennerf/HdrHistogramVisualizer
Last synced: 4 months ago
JSON representation
Visualizer for HdrHistogram and JHiccup logs
- Host: GitHub
- URL: https://github.com/ennerf/HdrHistogramVisualizer
- Owner: ennerf
- License: apache-2.0
- Created: 2015-07-05T19:31:24.000Z (over 9 years ago)
- Default Branch: main
- Last Pushed: 2022-09-11T11:35:32.000Z (over 2 years ago)
- Last Synced: 2024-11-06T05:22:29.631Z (4 months ago)
- Language: CSS
- Size: 1.02 MB
- Stars: 45
- Watchers: 9
- Forks: 11
- Open Issues: 0
-
Metadata Files:
- Readme: README.md
- License: LICENSE
Awesome Lists containing this project
README
HdrHistogramVisualizer
========
[](https://gitter.im/ennerf/HdrHistogramVisualizer?utm_source=badge&utm_medium=badge&utm_campaign=pr-badge&utm_content=badge)
An alternative visualizer for [HdrHistogram](https://github.com/HdrHistogram/HdrHistogram) logs as created by [jHiccup](https://github.com/giltene/jHiccup). Note that it has been **deprecated** since [Azul](http://www.azulsystems.com/product/jHiccup) made their [HistogramLogAnalyzer](https://github.com/HdrHistogram/HistogramLogAnalyzer) tool open source.

You can download the latest packaged version for your OS [here](https://ennerf.github.io/HdrHistogramVisualizer/download.html).
Maven
execute from commandline
mvn clean compile test exec:java
Screenshots
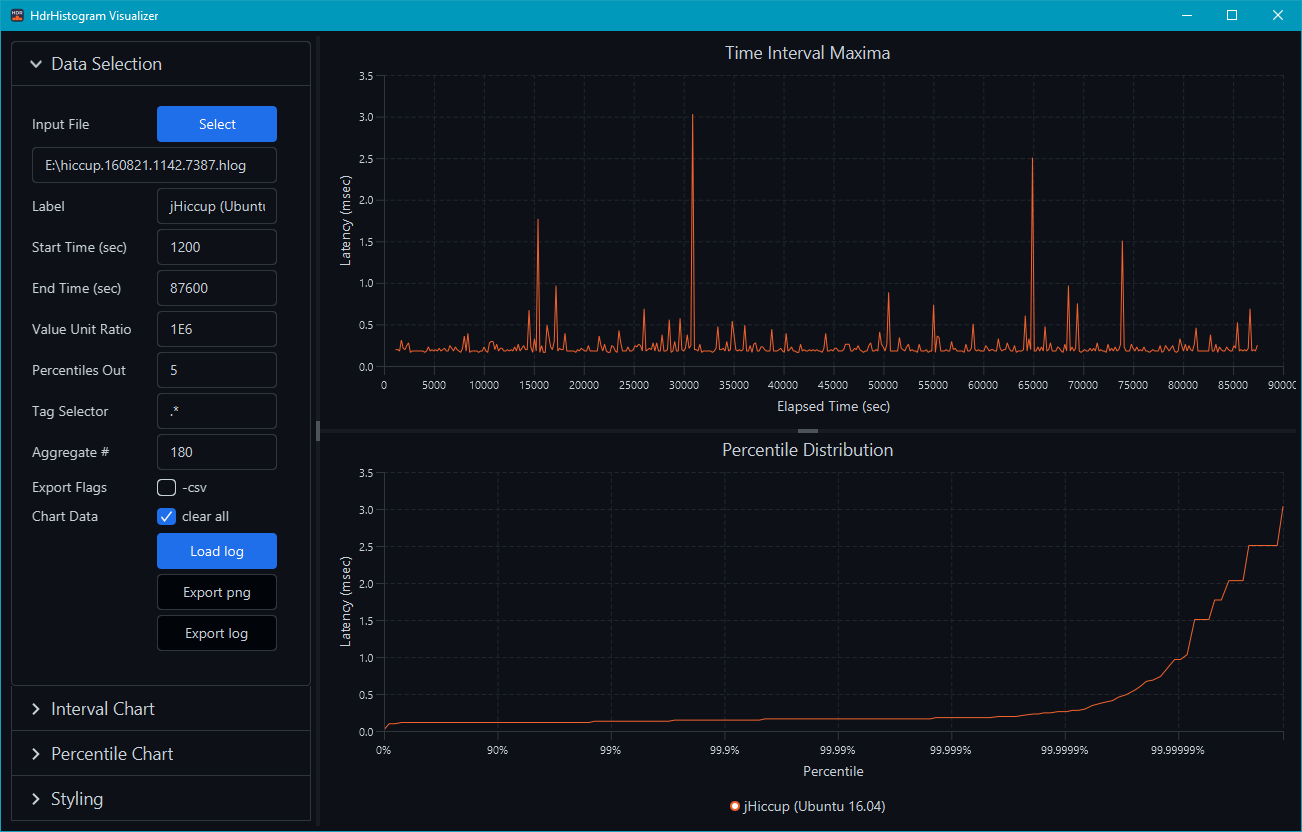
* **Main Screen (Dark)**
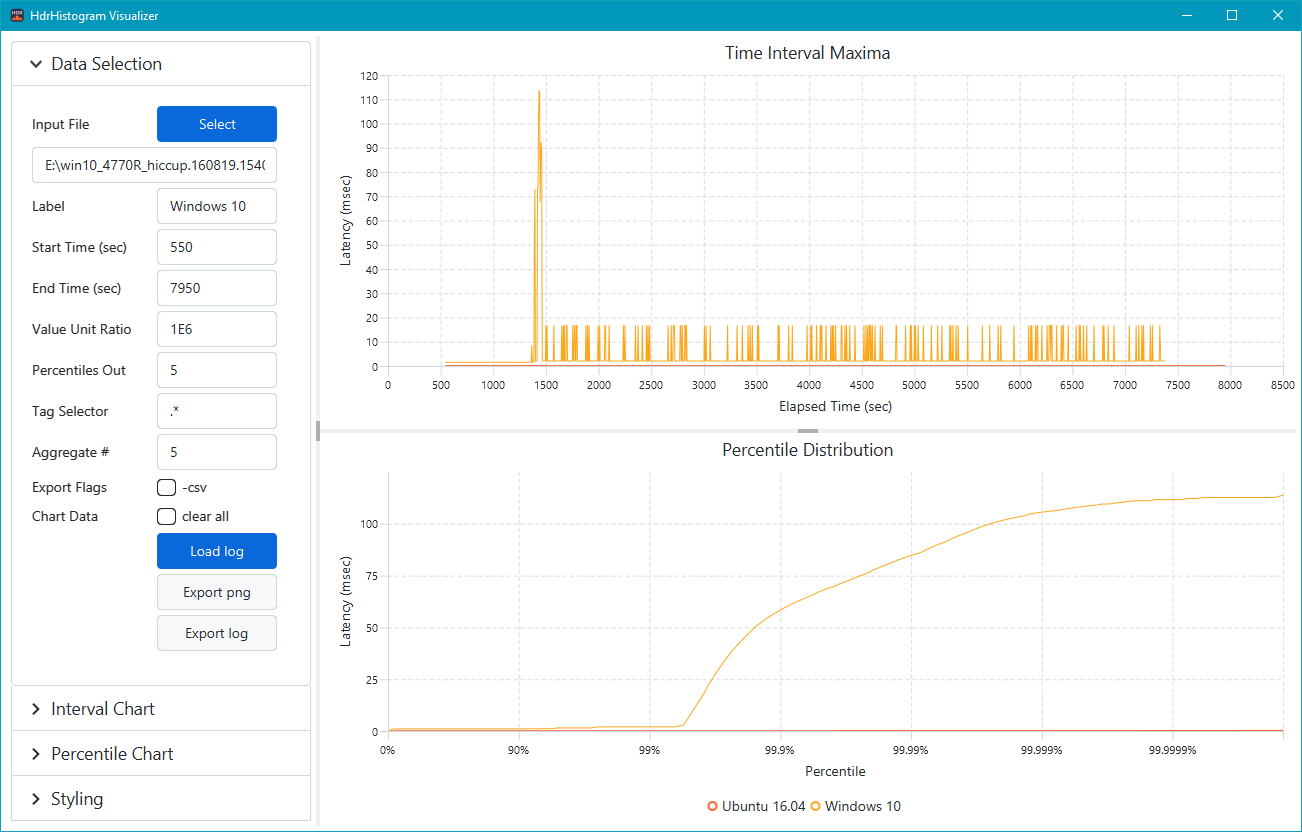
* **Main Screen (Light)**
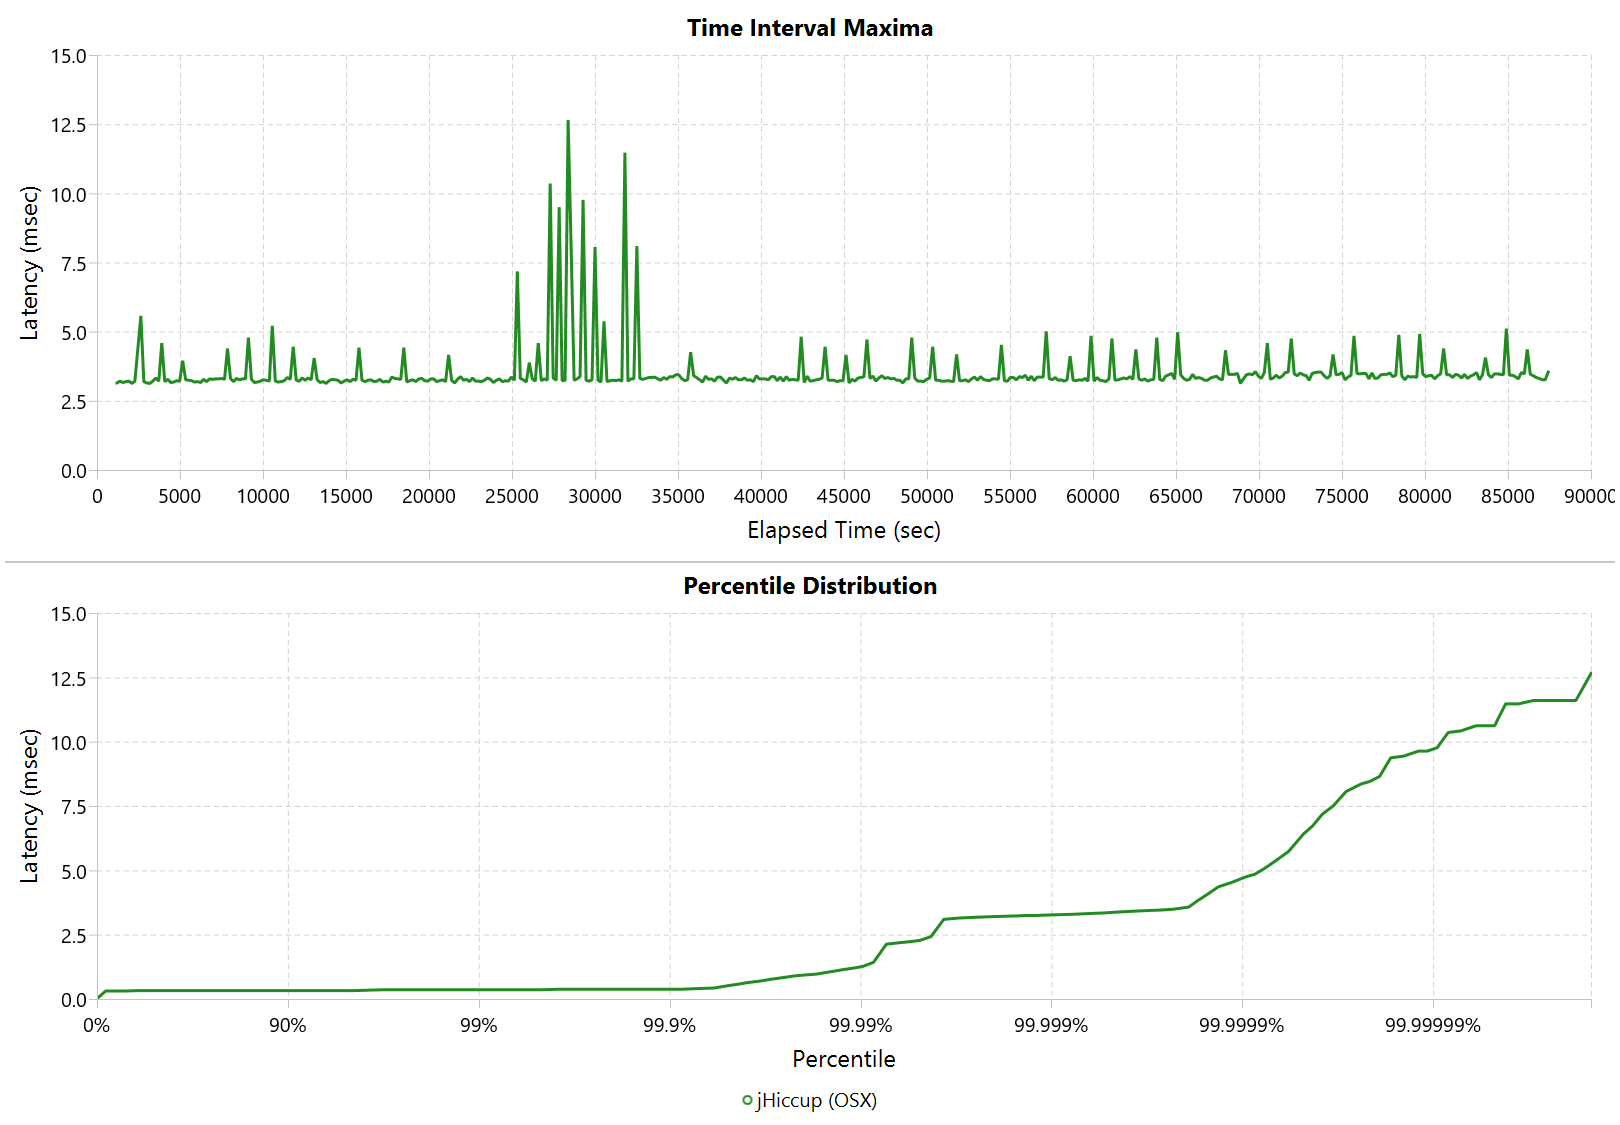
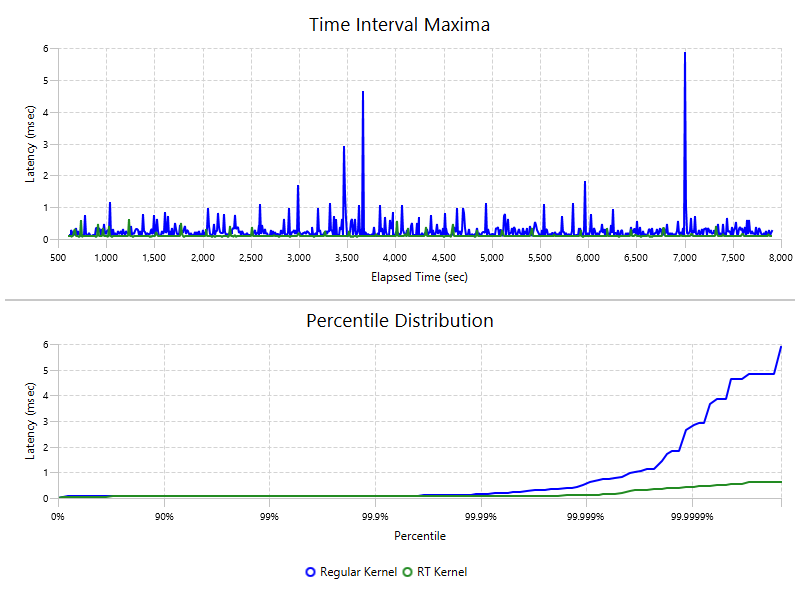
* **Exported png image**
Instructions
**Clear all** removes any existing data from the charts before loading new data. Deactivate this flag if you want to plot multiple lines.
**Export png** saves a snapshot of the current chart region. Be aware of this in case all exported images should have the same resolution.
**Export Log** internally uses the same methods as jHiccupLogProcessor. The input options are mapped to the corresponding commandline options.
**-csv** adds the '-csv' option to log export. It does not have an effect on the visualization.
**Aggregate Intervals** downsamples the time interval maxima by combining N sequential histograms. For example, if histogram were recorded in second intervals, a value of 60 would emulate the same behavior as if histograms were recorded in minute intervals. This can reduce clutter on the interval maxima chart and improve the loading performance.
Custom Labels
Titles, axis labels, and time units can be changed in the Interval Chart and Percentile Chart sections.
Custom Styling
HdrHistogramVisualizer monitors a 'visualizer.css' file in the start directory. If it exists, or gets changed, it will automatically be reloaded and applied. This allows you to overwrite any default css settings. This is useful for exporting nicer looking figures.
For example, the following 'visualizer.css' file,
```
/* --- Axes and Labels --- */
.chart-content {
-fx-font-size: 18px;
-fx-padding: 10 20 10 0px;
}
.chart-legend {
-fx-font-size: 20px;
-fx-padding: 0px;
}
.chart-title {
-fx-font-size: 24px;
-fx-text-fill: black;
-fx-font-weight: bold;
}
.axis {
-fx-font-size: 24px;
-fx-tick-label-font-size: 20px;
-fx-font-weight: normal;
}
/* --- Chart Lines --- */
.chart-series-line {
-fx-stroke-width: 3px;
}
.default-color0.chart-series-line, .default-color0.chart-line-symbol {
-fx-stroke: forestgreen;
-fx-background-color: forestgreen, white;
}
```
creates the following output,