https://github.com/esipfed/environmental-enforcement-watch
Environmental Enforcement Watch (EEW)
https://github.com/esipfed/environmental-enforcement-watch
Last synced: 4 months ago
JSON representation
Environmental Enforcement Watch (EEW)
- Host: GitHub
- URL: https://github.com/esipfed/environmental-enforcement-watch
- Owner: ESIPFed
- License: cc0-1.0
- Created: 2021-08-05T17:35:50.000Z (almost 5 years ago)
- Default Branch: main
- Last Pushed: 2021-11-16T21:51:52.000Z (over 4 years ago)
- Last Synced: 2025-08-13T10:51:30.759Z (10 months ago)
- Size: 25.4 KB
- Stars: 0
- Watchers: 4
- Forks: 0
- Open Issues: 0
-
Metadata Files:
- Readme: README.md
- License: LICENSE
Awesome Lists containing this project
README
# Environmental Enforcement Watch
The [Environmental Enforcement Watch (EEW)](https://www.environmentalenforcementwatch.org/) is a project of the [Environmental Data & Governance Initiative](https://envirodatagov.org/) receiving 2021 ESIP Lab funding for the project "Developing an Environmental Enforcement Data Portal for Grassroots and Congressional Action".
# Project Assets
* [Website](//environmentalenforcementwatch.org)
* [Website source code](https://github.com/edgi-govdata-archiving/EEW-Website)
* [Jupyter Notebooks](https://github.com/edgi-govdata-archiving/ECHO-Cross-Program)
* [EEW Report Card generation code](https://github.com/edgi-govdata-archiving/EEW-ReportCard-Data)
* [Support code for Jupyter Notebooks](https://github.com/edgi-govdata-archiving/ECHO_modules)
* [ESIP summer meeting session](https://2021esipsummermeeting.sched.com/event/b7bfcfb7b3efd99bd9dedaa8341a2b82)
* [Notes from ESIP workshop](https://docs.google.com/document/d/1xFD8Luv6u34uKQHh48znXWiykcFUiZpKfroBSn-1wls/edit)
* [Watershed notebook blog](https://envirodatagov.org/whats-in-my-watershed-a-tool-for-community-analysis-of-water-pollution-and-polluters/)
* [Watershed notebook](https://colab.research.google.com/github/edgi-govdata-archiving/ECHO-Watershed/blob/main/ECHO_Watershed.ipynb)
# What’s the purpose of this project?
## Project Background
Vital data about federal environmental enforcement actions against facilities that pollute the soil, air, and water is currently available but largely inaccessible in the U.S. Environmental Protection Agency’s (EPA) [Enforcement and Compliance History Online (ECHO) database](https://echo.epa.gov/). There has been a continuous pattern of insufficient enforcement of the nation’s environmental protection laws over the past 20 years. Accessible data on environmental permit enforcement means communities can take their concerns into their own hands and present evidence of insufficient enforcement to their elected representatives and the media. In this project, we are building a web portal to share accessible data tools so the public can use ECHO data to answer questions about polluting facilities in their areas of interest and draw attention to their findings.
EDGI has been working since January 2020 on the Environmental Enforcement Watch Project with data analysts, nonprofits, and community groups to develop well-documented and open source cloud-based Jupyter Notebooks that make ECHO data readily accessible by zip code, hydrologic unit code (to assess watersheds), state, and congressional district. The Notebooks draw data from a database hosted by our partner Stony Brook University which mirrors and stitches together several data sources from ECHO that are not accessible via the EPA’s GUI, opening up a more direct pathway to query for data science questions around the enforcement of environmental regulations.
In this project, we have built a web portal to help members of the public better access our research—and begin their own. The fully rebuilt site reorganizes around questions from environmental justice advocacy groups. For the first time, our Notebooks are fully accessible through our site, to allow visitors to dive into the data—and mirrored database—to seek answers to their mission-critical questions: what facilities are violating permits in my watershed area? How many facilities in my area are permitted for hazardous waste? How much enforcement is there of violations?
We reach though our partners’ networks to invite members of the public to use our tools to engage with environmental science data, letting them ask meaningful questions even at a novice level of data science and form critical questions of data quality that are often glossed over by the time “results” reach the public.
# What did the money fund?
ESIP Lab 2021 funding primarily supported the hiring of a designer/developer to help us rebuild our website, transforming it from a portfolio site for a specific project to a portal designed to help environmental justice activists. It also funded team member time for UX work, a design workshop at ESIP’s summer 2021 meeting, and the attendance of several team members.
# Key Learnings
## Website and Accessibility:
* Created a dataset of specific user questions from community partners— this will let us prioritize common questions and return to those partners as our work/database better covers specific questions.
* People come to us and our resources with many different types of need; our resources should be built to support very self-directed drilling-down into a topic, rather than high-level reports and abstractions.
* At the same time, high-level overviews are necessary to help people identify which resources are appropriate to their problem area.
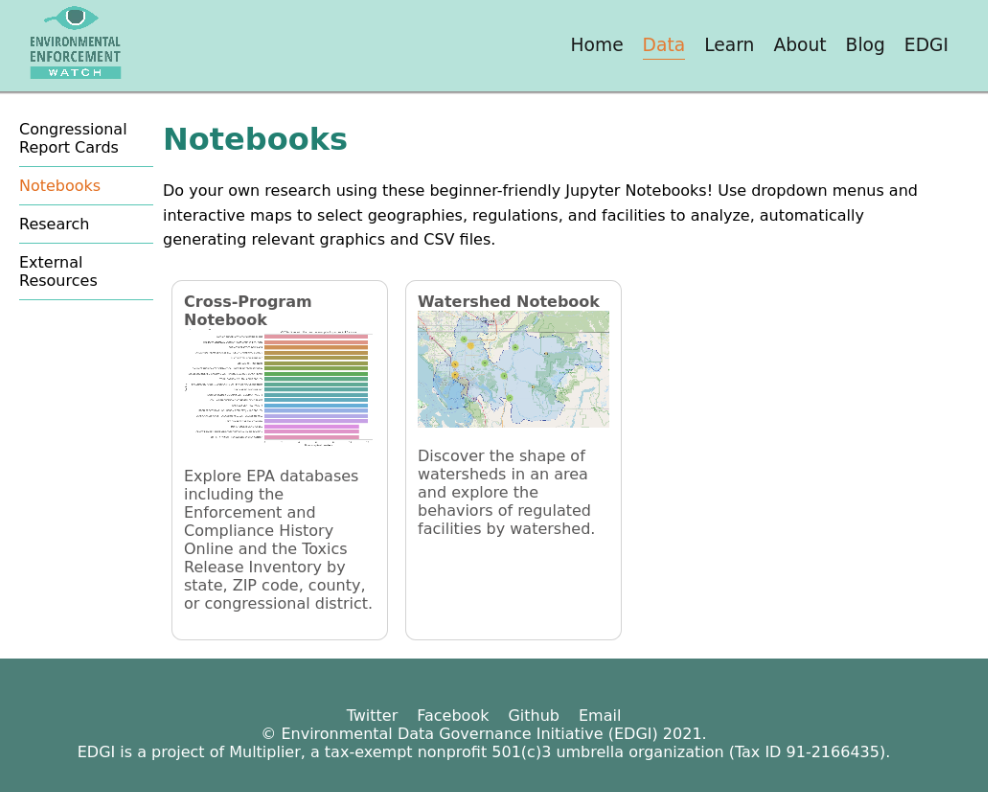
* Per user needs, website rebuild focuses on making specific resources more findable: a report for a specific area or across a topic, a Notebook for a particular type of question, a tutorial, etc.
* Design concept of the "info card" deployed across website, creating a more visually-focused and easily expanded design paradigm for many formats of information.
See an example of more findable resources, where pages have been turned into visually compelling tabs, with short descriptions.
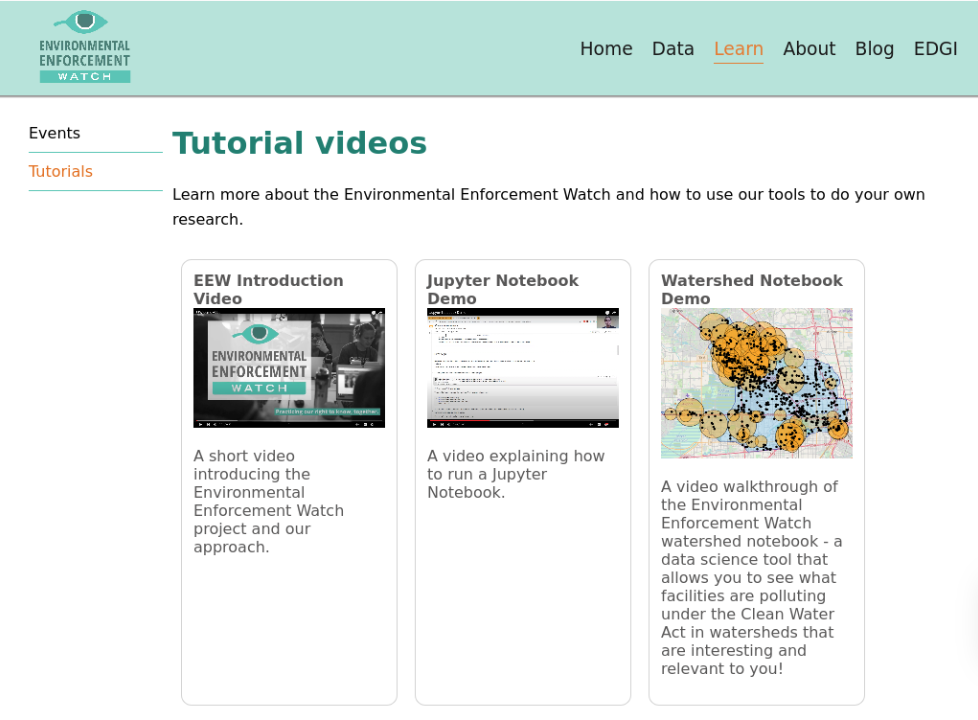
* We have also developed more accessible video and written tutorials for using the notebooks
* Improvements to the website framework include e.g. .mdx files, which make file organization more straightforward and more easily edited by less-technically-trained team members.
## Website and Content
* We developed a spreadsheet of extensive participant feedback from 11 usergroups including: 7 grassroots organizations, 2 national non-profits, 1 citizen science organization and 1 congressional office.
* We identified 11 of their 55 questions that were within scope to address in current projects, we worked to improve the website, notebooks and reports to address those questions and connect them with our outputs.
Questions selected were:
1. What facilities are continuously in CWA permit violation in our area, so we can talk to them?
1. Where can we focus our work? What chemicals are present, and what facilities are emitting?
1. What are violations we can pinpoint at the neighborhood scale?
1. How can we analyze at the scale of our specific smaller watershed (Niagara)?
1. How can we visualize who is polluting where?
1. What are the top pollutants, criteria pollutants, in an area of interest?
1. Can we see report cards for every legislative district?
1. Can we demonstrate regulatory failure at the scale of a legislative district?
1. Where are there increases in violations by legislative district?
1. Can we identify regions where the worst violations are happening and ID specific issues/polluters
1. What's going on with enforcement nationally, in a nutshell?
We addressed these questions in two interrelated outputs:
1. Our expanded congressional district report cards, and
2. Our newly developed watershed notebook.
# Outputs
* Dataset of user questions not shared publicly to protect the privacy of participants, but please let us know if it would be helpful to your work to learn more.
* Fully rebuilt and improved website at environmentalenforcementwatch.org, including site upgrades and excellent accessibility standards.
* New Watershed Notebook allows a deep dive on facility violations and enforcement across various types of EPA legislation by watershed boundary.
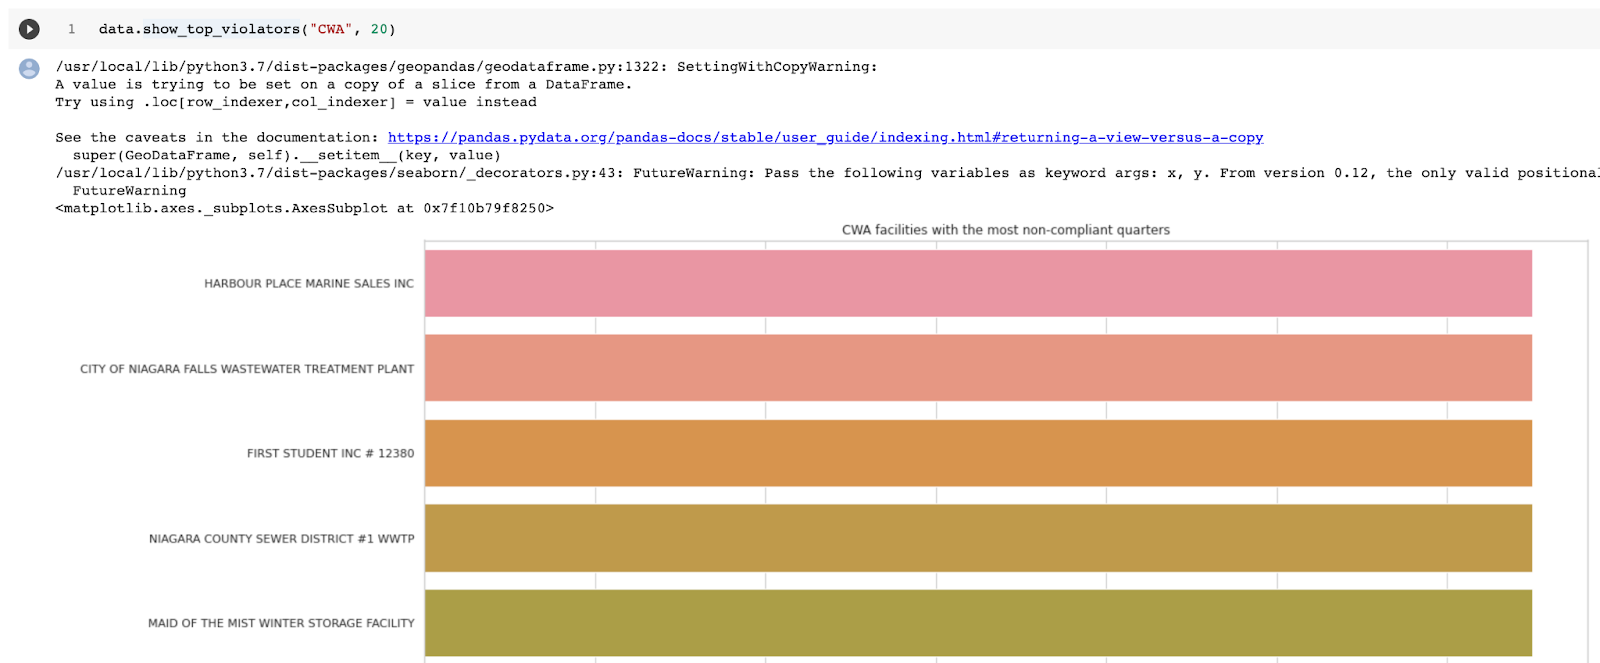
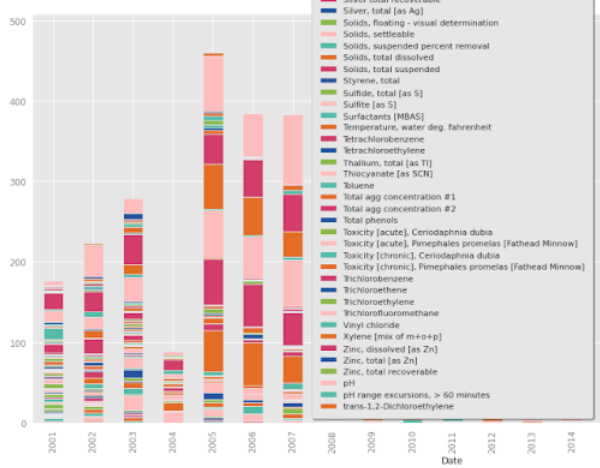
* The Watershed notebooks address questions 1-6 above. These allow analysis of the major emitters and the composition of what is being emitted, such as facilities that are most non-compliant with the Clean Water Act over the past 13 quarters, or a little over three years
* Analysis can be scaled in the notebooks from a single watershed to an entire river network using USGS HUC codes.
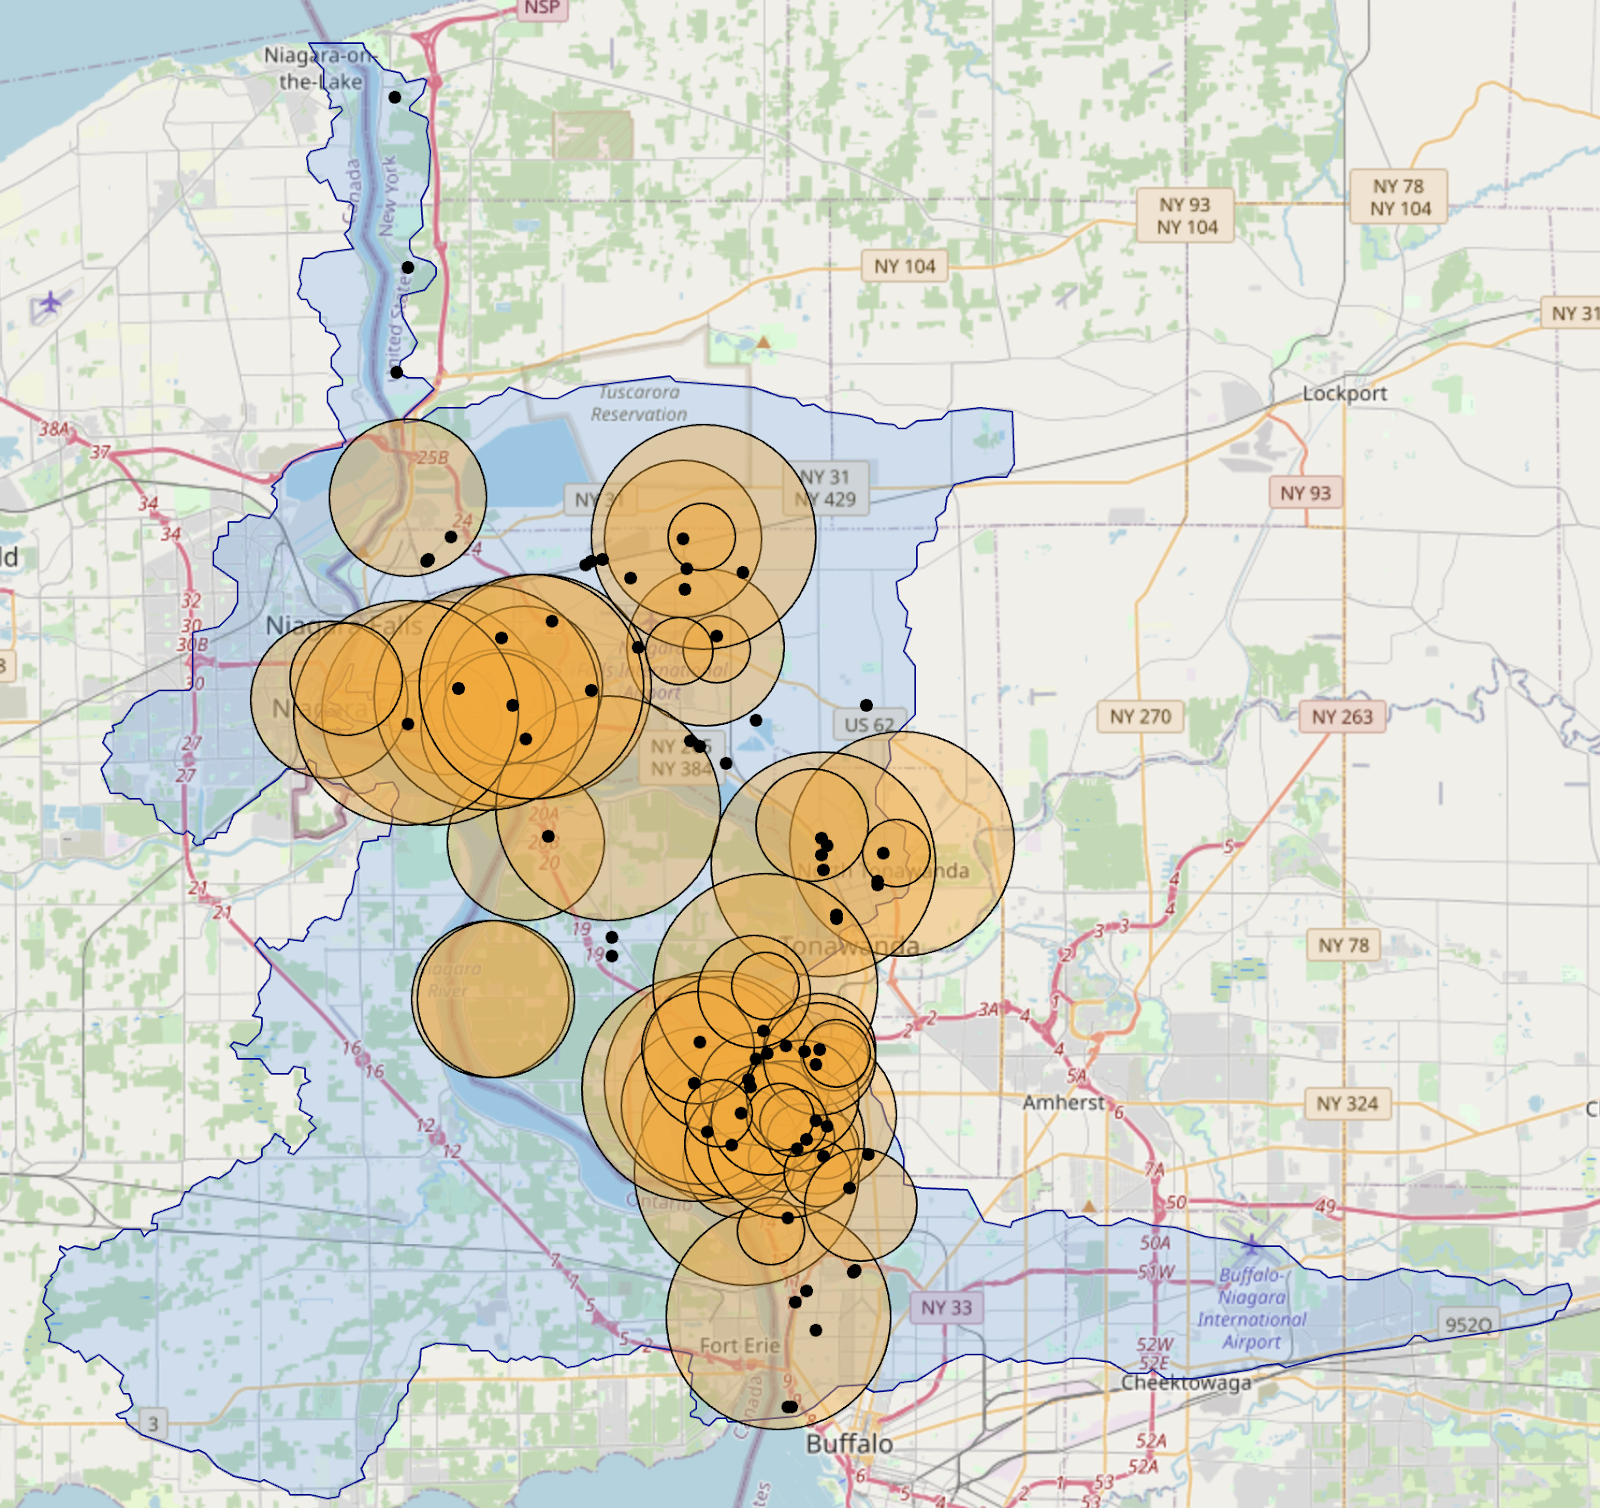
* The notebooks generate maps of the location of emitters and the scale of their emissions.
These are orange circles, sized to the number of violations reported. Those that have not reported violations are represented by small black circles:
* Previously, there were 76 report cards across two key committees, one in the House and one in the Senate, in advance of the 2020 election. Now, there are reports for every state and congressional district, and they update automatically every few weeks with new information.
* These expanded congressional district report cards address questions 7-11. They show the levels of violations, inspections and enforcement actions under the major environmental laws CWA, CAA, RCRA since 2001 and allow user to track overall patterns. They identify the top 10 facilities out of compliance and link to reports on those specific facilities emission from the EPA. We are working on a national-level summary from these reports.
# Licensing
This repository is [CC-0 licensed](https://github.com/ESIPFed/Environmental-Enforcement-Watch/blob/main/LICENSE).
Materials linked from this repository have licensing on their own repos. In general, [GPLv3](http://gplv3.fsf.org/) is our _preferred_ license for code and [Creative Commons Attribution-ShareAlike 4.0 International (CC BY-SA 4.0)](https://creativecommons.org/licenses/by-sa/4.0/) for creative works and documentation.
All EDGI repos are open source and openly licensed.
